3. (DPPH), ferric chloride hexahydrate, ferrous chloride hexahydrate,
ferrozine, ascorbic acid, caffeic acid, gallic acid, isoquercitrin, luteolin,
vitexin, sodium phosphate, sodium acetate, 4-nitrophenyl-α-D-
glucopyranoside (PNPG), α-glucosidase, acetic acid, acarbose, 6-
hydroxy-2,5,7,8-tetramethylchromane-2-carboxylic acid (Trolox), and
trichloroacetic acid were purchased from Sigma-Aldrich Chemicals (St.
Louis, MO, USA). Potassium ferricyanide, aluminum chloride,
anhydrous sodium carbonate, potassium acetate, and dimethyl
sulfoxide (DMSO) were purchased from Fluka (Switzerland).
Extraction. The extraction process for each sample was carried out
in triplicate using fruits from different vines. Each sample (50 g) was
successively extracted by four different solvents (n-hexane, chloroform,
ethyl acetate, and methanol) with ascending order of polarity using a
Soxhlet apparatus. The extracts were filtered and concentrated using a
rotary evaporator (EYELA, Japan). The dried extracts were stored at 4
°C until further analysis. The extracts were weighed using a
microbalance (Sartorius, Germany) and reconstituted with 99.9%
(v/v) DMSO to prepare a stock solution at a concentration of 10 mg/
mL.
Determination of Total Phenolic Content (TPC). TPC was
determined according to the Folin−Ciocalteu method.29
In brief, 0.5
mL of each extract (1.0 mg/mL in concentration) was mixed with 1
mL of 2 N (10% v/v) Folin−Ciocalteu reagent. After 3 min, 3 mL of
2% (w/v) sodium carbonate was added to the previous mixture. The
absorbance of the reaction products was measured at 760 nm using a
Genesys 20 spectrophotometer (Thermo Fisher Scientific, Waltham,
MA, USA) after 2 h of incubation at room temperature. The same
procedure was repeated using different concentrations (0−200 μg/
mL) of gallic acid. The total phenolic content of a sample was
calculated from the gallic acid calibration curve, and the results were
expressed as milligrams of gallic acid equivalents (GAE) per gram of
dry weight of extract (mg GAE/g extract).
Chelating Power Assay. Chelating power was determined
according to the method of Ooi et al.30
Different concentrations of
each extract (50 μL) were mixed with 5 μL of 2.0 mM ferrous chloride
hexahydrate and 130 μL of methanol in different wells of a 96-well
plate. After 5 min of incubation, the reaction was initiated by the
addition of 15 μL of ferrozine (5.0 mM). After 10 min of incubation at
room temperature, the absorbance was measured at 562 nm using a
Multiskan EX microplate reader (Thermo Fisher Scientific, Finland).
The chelating power activity (%) was calculated according to the
following equation: chelating power activity (%) = [(absorbance of
negative control − absorbance of extract)/absorbance of negative
control] × 100%. Each EC50 value, the effective concentration that
could chelate 50% of ferrous [Fe(II)] ions, was derived from a
nonlinear sigmoidal dose response curve (GraphPadPrism, San Diego,
CA, USA).
DPPH Free Radical Scavenging Assay. Free radical scavenging
activities of the extracts were measured using the method described by
Sulaiman et al.31
The reaction mixture in each well of the 96-well plate
used consisted of 50 μL of extract (1.0 mg/mL) and 150 μL of 300
μM DPPH ethanolic solution. The plate was wrapped with aluminum
foil to avoid exposure to light and was incubated at 37 °C for 30 min.
The decrease in absorbance was determined at 515 nm using a
Multiskan EX microplate reader (Thermo Fisher Scientific, Finland).
Trolox was used as a reference for this assay. A standard curve was
obtained using different concentrations of Trolox (from 31.25 to 4000
μM). The absorbance of the reaction sample was compared to that of
the Trolox standard curve, and all results were expressed in terms of
millimolar Trolox equivalents (TE) per gram dry weight of extract
(mM TE/g extract).
Reducing Power Assay. Reducing powers of the extracts were
determined according to the method of Zhuang et al.32
with a slight
modification. An aliquot (125 μL) of each extract (1.0 mg/mL) was
mixed with 125 μL of sodium phosphate buffer (0.2 M, pH 6.6) and
125 μL of 1% potassium ferricyanide, and the reaction mixture was
incubated at 50 °C for 20 min. After the addition of 125 μL of 10%
trichloroacetic acid, the mixture was centrifuged at 704g for 10 min
using an EBA 20 Centrifuge (Hettich, Japan). The supernatant
solution (100 μL) was mixed with 100 μL of distilled water and 20 μL
Table
1.
continued
scientific
name
extract
phenolic
compound
and/or
content
other
compound
and/or
content
aqueous
and
95%
ethanol
extracts
of
dried
fruit
12
total
phenolic
content
in
95%
ethanol
extract:
51.6
mg
GAE/g
extract
12
vitamin
C:
88
mg/100
g
of
edible
portion
40
aqueous,
20,
40,
60,
80,
95%
ethanol
extracts
of
dried
immature,
mature
and
ripe
pulps
16
total
phenolic
contents
in
aqueous,
20,
40,
60,
80,
95%
ethanol
extracts
of
dried
immature,
mature,
and
ripe
pulps
ranged
from
4.3
to
15.7
mg
GAE/g
extract
16
momordicoside
K
(a
triterpenoid
glycoside)
42
acetone/water/acetic
acid
(70:29.5:0.5)
extract
of
freeze-dried
sample
26
aqueous
extract
of
fresh
sample
27
60%
methanolic
extract
containing
0.1%
hydrochloric
acid
of
fresh
edible
portion
28
Sechium
edule
trace
amount
of
vicenin
2,
vitexin,
and
luteolin
7-O-rutinoside
34
total
carotenoids:
97
μg/100
g
fresh
weight
39
β-carotene:
2
μg/100
g
fresh
weight
39
Trichosanthes
cucumerina
methanol
and
water
extracts
of
fresh
edible
portion
23
total
phenolic
content
in
aqueous
extract:
71.90
mg
GAE/100
g
fresh
weight
10
α-carotene:
10.7
mg/100
g
fresh
weight
10
20%
acetone
extract
of
freeze-dried
fully
ripe
pulp.
10
β-carotene:
2.80
mg/100
g
fresh
weight
10
Journal of Agricultural and Food Chemistry Article
dx.doi.org/10.1021/jf4031037 | J. Agric. Food Chem. 2013, 61, 10080−10090
10082
4. of 1% ferric chloride hexahydrate to react for 10 min. The absorbance
was then measured at 700 nm using a Multiskan EX microplate reader
(Thermo Fisher Scientific, Finland). Ascorbic acid was used as a
standard antioxidant compound to produce a standard curve at
concentrations between 1.95 and 4000 μM. Values were expressed as
millimolar ascorbic acid equivalents (AscAE) per gram dry weight of
extract (mM AscAE/g extract).
α-Glucosidase Inhibitory Assay. The α-glucosidase inhibitory
activity was determined according to the method of Ooi et al.30
The
extract (25 μL; 10 mg/mL) was mixed with 25 μL of 0.1 M sodium
phosphate buffer (pH 7), 25 μL of 15 mM PNPG, and 25 μL of α-
glucosidase enzyme solution (5 U/mL). The mixture was then
incubated for 40 min at 37 °C. One hundred microliters of 0.2 M
sodium carbonate solution was added to terminate the reaction.
Acarbose was used as a positive control. The increase in absorbance
due to hydrolysis of PNPG by α-glucosidase was measured using a
Multiskan EX microplate reader (Thermo Fisher Scientific, Finland).
The inhibition percentage was calculated as follows: % α-glucosidase
inhibition = [(absorbance of negative control − absorbance of
extract)/absorbance of negative control] × 100%. All measurements
were done in triplicate.
Bioactivity-Guided Fractionation of the Methanol Extract of
L. siceraria and the Ethyl Acetate Extract of S. edule. The
methanol extract of L. siceraria and the ethyl acetate extract of S. edule
were selected for further studies because they showed high TPCs as
well as scavenging and reducing values and α-glucosidase inhibitory
activity. The extracts were also fractionated by applying each of them
separately as a streak on 15−20 sheets of 3 mm Chr (46 × 57 cm)
chromatography paper (Whatman, UK) and run in a solvent of n-
butanol/acetic acid/water (BAW) in 4:1:5 relative proportions (upper
layer) for 16 h. The chromatograms were left to air-dry in a fume
cupboard. The dried chromatograms were later viewed under long-
wave ultraviolet (UV) light, and the Rf values and colors for each band
were recorded prior to cutting of the bands. The separated bands were
eluted using methanol. The dried fractions (1.0 mg/mL) were tested
for their antioxidant activities using the DPPH and ferric reducing
assays and α-glucosidase inhibitory activity. Fraction LS3 from the
methanol extract of L. siceraria, with an Rf value (×100) of 65 in BAW,
and fraction SE4 from the ethyl acetate extract of S. edule, with an Rf
value (×100) of 75 in BAW, were further purified. The fractions were
streaked and rerun on chromatography paper in a 15% acetic acid (v/
v) solvent. Subsequently, the separated bands were cut out and eluted
in methanol. To test its purity, each fraction was spotted onto thin
layer chromatography plates (Polygram Cel 400 UV254, Macherey
Nagel, Germany) and rerun with BAW, 15% acetic acid, and water.
The solvent producing the greatest separation was chosen for further
Table 2. Total Phenolic Contents and Antioxidant and α-Glucosidase Inhibitory Activities of Dried Extracts Obtained from the
Pulps of the Seven Cucurbit Vegetablesa
total phenolic content
(mg GAE/g extract)
EC50 values of chelating
activity (mg/mL)
DPPH free radical scavenging
activity (mM TE/g extract)
reducing power
(mM AscAE/g extract)
α-glucosidase
inhibition activity (%)
Benincasa hispida
hexane 9.99 ± 0.15no 8.37 ± 0.42p 327.35 ± 5.84k 8.70 ± 4.99l 37.93 ± 1.31f
chloroform 14.87 ± 0.08h 0.44 ± 0.03a 380.76 ± 3.66j 118.06 ± 6.18g 42.93 ± 0.48e
ethyl acetate 20.29 ± 0.24d 2.52 ± 0.04ghij 161.53 ± 14.78p 279.64 ± 17.98d 48.73 ± 0.98d
methanol 17.73 ± 0.27e 7.47 ± 1.31o 66.30 ± 7.06q 275.83 ± 8.64d 18.94 ± 0.55kl
Cucurbita maxima
hexane 12.99 ± 0.11i 2.05 ± 0.07fgh 268.39 ± 1.76lm 8.16 ± 4.90l 11.76 ± 1.85m
chloroform 11.59 ± 0.04k 3.65 ± 0.27kl 395.45 ± 5.87ij 78.89 ± 13.88hi 10.63 ± 1.06m
ethyl acetate 6.04 ± 0.27s 1.15 ± 0.05bcd 598.38 ± 22.26d 99.56 ± 12.95gh 22.11 ± 0.90jk
methanol 10.50 ± 0.04l 1.95 ± 0.22efg 252.53 ± 2.10m 207.28 ± 23.02f 9.93 ± 0.93m
Lagenaria siceraria
hexane 4.03 ± 0.07u 3.05 ± 0.48jk 273.80 ± 3.03lm 18.50 ± 3.40kl 26.44 ± 3.30i
chloroform 11.66 ± 0.11k 0.62 ± 0.09ab 469.30 ± 7.57g 84.87 ± 1.63hi 38.61 ± 1.12f
ethyl acetate 10.33 ± 0.04lm 0.98 ± 0.14abc 556.94 ± 10.62f 218.16 ± 24.93f 56.04 ± 1.72c
methanol 20.85 ± 0.12c 4.39 ± 0.37m 649.32 ± 17.70c 324.25 ± 30.29c 61.25 ± 2.57b
Luffa acutangula
hexane 8.34 ± 0.15q 9.56 ± 0.19q 201.12 ± 6.11o 43.52 ± 4.11jk 22.81 ± 2.82j
chloroform 28.04 ± 0.37a 2.02 ± 0.09efgh 226.16 ± 0.71n 367.77 ± 9.97b 50.82 ± 3.25d
ethyl acetate 15.55 ± 0.07g 1.72 ± 0.21def 274.66 ± 1.32l 348.19 ± 22.28bc 43.93 ± 1.28e
methanol 13.27 ± 0.04i 4.16 ± 0.67lm 698.14 ± 19.87b 248.63 ± 10.87e 11.59 ± 2.99m
Momordica charantia
hexane 2.34 ± 0.04v 8.37 ± 0.55p 37.04 ± 1.40r 22.31 ± 0.94kl 19.93 ± 2.31jkl
chloroform 8.92 ± 0.07p 3.51 ± 0.25k 448.23 ± 5.06h 84.87 ± 10.70hi 21.62 ± 0.21jk
ethyl acetate 16.43 ± 0.31f 4.28 ± 0.19lm 393.05 ± 11.15ij 221.97 ± 17.20f 66.64 ± 2.94a
methanol 10.08 ± 0.10mn 1.36 ± 0.34cde 403.87 ± 7.91i 692.56 ± 43.38a 18.04 ± 0.47l
Sechium edule
hexane 4.02 ± 0.19u 8.11 ± 0.28p 313.53 ± 3.75k 75.62 ± 6.18hi 34.59 ± 2.22g
chloroform 9.08 ± 0.20p 1.16 ± 0.17bcd 443.02 ± 11.29h 126.76 ± 7.36g 27.62 ± 2.82hi
ethyl acetate 22.69 ± 0.15b 2.76 ± 0.07ij 951.73 ± 29.14a 289.97 ± 22.52d 51.49 ± 2.13d
methanol 9.74 ± 0.23o 2.13 ± 0.18fghi 439.23 ± 4.86h 216.53 ± 21.30f 29.96 ± 3.35h
Trichosanthes cucumerina
hexane 5.29 ± 0.19t 1.59 ± 0.14cdef 38.87 ± 0.89r 68.55 ± 11.42ij 30.87 ± 0.79h
chloroform 12.15 ± 0.23j 5.19 ± 0.23n 256.00 ± 2.46lm 192.59 ± 12.32f 38.08 ± 0.00f
ethyl acetate 17.45 ± 0.27e 2.66 ± 0.07hij 577.04 ± 30.46e 212.72 ± 8.38f 61.91 ± 1.96b
methanol 7.36 ± 0.18r 4.47 ± 0.31m 378.08 ± 11.46j 277.46 ± 4.32d 12.62 ± 1.75m
a
Values are means ± standard deviations of triplicate analyses. The results from different assays were analyzed separately. Values for each assay
followed by different letters are significantly different (p < 0.05) as measured by Duncan’s test.
Journal of Agricultural and Food Chemistry Article
dx.doi.org/10.1021/jf4031037 | J. Agric. Food Chem. 2013, 61, 10080−10090
10083
5. purification. The fractions were further purified using a Sephadex LH-
20 column with methanol. Identification of the compounds was made
on the basis of spectroscopic analyses, Rf values, retention times,
spiking with authentic markers, and comparison of results with those
reported for L. siceraria33
and S. edule.34
The dried compounds at a
concentration of 1.0 mg/mL were tested for their antioxidant and α-
glucosidase inhibitory activities.
Quantitative Analysis of Phenolic Compounds in L. siceraria
and S. edule Extracts. Quantitative analyses of phenolic compounds
in the L. siceraria and S. edule extracts were performed in triplicate
using an Acquity ultraperformance liquid chromatography (UPLC)
system (Waters, Milford, MA, USA) equipped with a reverse-phase
Acquity UPLC BEH C18 column, 1.7 μm (100 mm × 2.1 mm i.d.) and
a photodiode array detector. The mobile phase consisted of solvent A
(1% acetic acid) and solvent B (methanol/acetic acid/water; 18:1:1).
Each extract was separated using a gradient mode that was initially set
at an A:B ratio of 85:15 and then linearly increased to 65:35 at 1.5 min,
40:60 at 2 min, and 10:90 at 6.3 min until 7.3 min. The detector was
set at 280 nm for quantification of gallic acid and at 350 nm for caffeic
acid, isoquercitrin, luteolin, and vitexin, with a flow rate of 0.20 mL/
min and an injection volume of 5.0 μL. Phenolic compounds in the
extracts were identified and quantified by comparison of their
retention times and UV spectra (detected by the photodiode array
detector) with those of authentic standards. A standard calibration
curve of different concentrations (31.25−1000 μg/mL) of each
standard was plotted. The concentration of the phenolic compound in
each extract was calculated using the regression equation of its peak
area to the peak area of a known concentration of standard from the
calibration curve. The results were expressed as milligrams of phenolic
compound per 100 g of extract (mg/100 g extract).
Statistical Analysis. All data were expressed as the means ±
standard deviations. Data were analyzed by means of a one-way
ANOVA using SPSS 16.0 for Windows (SPSS Inc., Chicago, IL, USA),
and Duncan’s test was used to assess the differences between the
means. Pearson’s correlation test was used for determination of
correlations between the antioxidant activities of the three
independent tests (DPPH, reducing power, and metal chelating), α-
glucosidase inhibitory activity, and total phenolic contents using Prism
3.02 statistical software (GraphPadPrism). A p value less than 0.05 (p
< 0.05) was considered statistically significant.
■ RESULTS AND DISCUSSION
Total Phenolic Content. The TPCs of the extracts are
shown in Table 2. The polarity and solubility of chemical
constituents in an extracting solvent may influence the
extraction yield and TPC in an extract. Therefore, in this
study, each sample was sequentially extracted using four
different polarities of solvents, and the recovery of TPC in
each extract was determined.
The highest value of TPC was exhibited by the chloroform
extract of L. acutangula (28.04 ± 0.37 mg GAE/g extract). This
suggests that the initial extraction using hexane may have
facilitated greater recovery of lipophilic phenolics from the
chloroform extract of this dried fruit. According to a
comparative assessment of TPCs from extracts of 60%
methanol containing 0.1% hydrochloric acid of fresh vegetables
that are commonly consumed in India, the lowest value was
obtained from the fresh edible portion of L. acutangula (Table
1).28
Meanwhile, another study found that the amount of
antioxidant components in the 80% methanol extract of L.
acutangula fresh pulp prepared by boiling was higher than that
obtained by cold maceration.21
In this study, the heat treatment
applied during the Soxhlet extraction may optimize the
extraction of phenolic compounds from the samples by
accelerating their solubility and diffusion rates.
The ethyl acetate extracts of most of the vegetables
(excluding C. maxima and L. siceraria) were found to have
more than 15 mg GAE/g extract of TPC. Several sequential
solvent partitioning studies of dry-ground pulps also revealed
the highest recovery of TPC from the ethyl acetate fraction.35,36
Among the extracts of C. maxima, the highest TPC was
measured from the hexane extract. The TPC in the hexane
extract of C. maxima (12.99 ± 0.11 mg GAE/g extract) was
found to be comparable to those reported by Attarde et al.15
and Gacche et al.25
from methanol and 50% ethanol extracts,
respectively (Table 1). The methanol extract of L. siceraria was
found to have the highest TPC (20.85 ± 0.12 mg GAE/g
extract) compared with the other methanol extracts and other
extracts of L. siceraria. As indicated in Table 1, four flavone C-
glycosides, two flavonols, two phenolic acids, and four
hydroxycinnamic acids were isolated from the fruit of L.
siceraria.18,33,37
Antioxidant Assessments. Many antioxidant studies on
these vegetables had been carried out using various in vitro and
in vivo assays. Table 1 shows the extracts used in the earlier
antioxidant evaluations of the vegetables. With the exception of
the studies done by Chanwitheesuk et al.22
and Isabelle et al.,26
previous comparative studies were found to have utilized fresh
samples. The fruit ripening stages were not highlighted in most
papers. The use of different assays and sample matrices can lead
to different results. In addition, on the basis of our observations,
discrepancies in comparative analysis of literature data could be
due to the lack of descriptions (of methodologies), the samples
used,26,27
and the definitions of fresh edible portions not being
clearly specified.23,24,28
An edible portion may exclude the peel
and the seed or can refer to the entire fruit. For instance,
studies by Kubola and Siriamornpun,11
Wu and Ng,12
and
Chanwitheesuk et al.22
on M. charantia were found to employ
the entire dried fruit instead of dried pulp. Only studies by
Attarde et al.15
on C. maxima and by Horax et al.16
on M.
charantia utilized dried pulp and the DPPH method. However,
it is still inappropriate to compare our results with theirs due to
the dissimilar quantitative units (i.e., percentage of free radical
scavenging activity and EC50, respectively) used.
The metal chelating assay assesses the indirect involvement
of an extract as a secondary antioxidant by binding the ferrous
[Fe(II)] ion that catalyzes oxidation and subsequently prevents
the formation of the Fe(II)−ferrozine complex (intense red-
purple in color). The extract with the lowest EC50 value is
considered to have the highest activity. The chloroform extract
of B. hispida exhibited the highest activity, with an EC50 value of
0.44 ± 0.03 mg/mL (Table 2). This was followed by the
chloroform and ethyl acetate extracts of L. siceraria, the ethyl
acetate extract of C. maxima, and the chloroform extract of S.
edule, with no significant differences (p < 0.05).
All of the extracts with promising activities were found to
have low TPC (Table 2). Therefore, the results revealed the
insignificant contribution of TPC to the chelating power. In
addition, the metal chelating ability of polyphenols has been
suggested to be related to the presence of an o-dihydroxy
moiety in their chemical structures or to catechol or galloyl
groups.38
Several compounds that were previously isolated
from these fruit vegetables (Table 1), such as astilbin and
catechin from B. hispida; caffeic acid, isoorientin, and
isoquercitrin from L. siceraria; catechin, epicatechin, and
chlorogenic acid from M. charantia; and luteolin 7-O-rutinoside
from S. edule, have o-dihydroxy or catechol groups in their
chemical structures, whereas gallic acid (a 3,4,5-trihydrox-
ybenzoic acid), which was found at high concentration in M.
charantia, bears a galloyl moiety.
Journal of Agricultural and Food Chemistry Article
dx.doi.org/10.1021/jf4031037 | J. Agric. Food Chem. 2013, 61, 10080−10090
10084
6. DPPH free radical scavenging and ferric reducing assays were
used to measure the direct involvement of an extract as a
primary antioxidant. An extract with antioxidant activity may
react with DPPH radicals (purple in color) and convert them to
stable diamagnetic molecules (diphenylpicrylhydrazine, which
is yellow in color). As shown in Table 2, ethyl acetate is the
best solvent for extracting DPPH free radical scavenging
constituents from C. maxima, S. edule, and T. cucumerina. The
highest activity indicated by the ethyl acetate extract of S. edule
(951.73 ± 29.14 mM TE/g extract) can be associated with its
high TPC (22.69 ± 0.15 mg GAE/g extract; Table 2). This was
followed by the methanol extracts of L. acutangula (698.14 ±
19.87 mM TE/g extract) and L. siceraria (649.32 ± 17.70 mM
TE/g extract). This is the first antioxidant evaluation using S.
edule and L. acutangula dried pulp samples because previous
antioxidant studies of these two fruits were focused on
vegetative parts and fresh fruit samples (Table 1). The
scavenging activity of L. acutangula and L. siceraria was also
influenced by the increasing polarity of extracting solvents as
the highest activity was observed in the most polar extract (i.e.,
methanol). The higher activity of the methanol extract of L.
siceraria was also in line with its TPC (20.85 ± 0.12 mg GAE/g
extract; Table 2). Polyphenolics and other chemical constitu-
ents that were identified from the fruit (Table 1) might be
responsible for the activity.
Due to the low TPC in the methanol extract of L. acutangula,
it is suggested that its higher scavenging activity might be
elicited by a strong antioxidant compound in the extract that
could potentiate the activity at a very low concentration.
However, such a compound has yet to be isolated from this
fruit. Nevertheless, the activity might also be correlated with its
moderate total carotenoid, β-carotene,39
vitamin A, thiamin
(vitamin B1), and vitamin C contents (Table 1).40
Furthermore, higher activities of the chloroform extracts of B.
hispida and M. charantia were also not correlated with their
TPC values and might be associated with synergistic effects of
the chloroform-soluble phytochemicals. Several sequential
extraction studies of dried fruits also revealed the highest
recovery of radical scavenging compounds from the chloroform
extracts.31,41
As shown in Table 1, momordicoside K (a
cucurbitane-type triterpenoid glycoside) is an antioxidant
constituent that was isolated from the dichloromethane extract
of fresh fruit of M. charantia.42
In the ferric reducing assay, the presence of an antioxidant in
an extract may lead to the reduction of the Fe(III)/ferric
cyanide complex to form ferrous iron [Fe(II)] by donating an
electron. As indicated in Table 2, higher activities were mostly
shared by the methanol and ethyl acetate extracts. This might
be due to the efficiency of these solvents in extracting polar
reducing power compounds compared to the other two
extracting solvents. The methanol extract of M. charantia was
found to demonstrate the highest activity (692.56 ± 43.38 mM
AscAE/g extract). Catechin, gallic acid, gentisic acid, chloro-
genic acid, and epicatechin are major phenolic constituents that
have been quantified from the fruit extracts (Table 1). The
methanol extract was followed by the chloroform (367.77 ±
9.97 mM AscAE/g extract) and ethyl acetate extracts (348.19 ±
22.28 mM AscAE/g extract) of L. acutangula, with no
significant difference (p < 0.05). Moreover, in accordance
with having TPCs of >20 mg GAE/g extract (Table 2), the
chloroform extract of L. acutangula, the ethyl acetate extracts of
B. hispida and S. edule, and the methanol extract of L. siceraria
also exhibited among the greatest reducing capacities compared
to their other extracts. Furthermore, for the fruits with activities
best extracted by methanol, their activities were successively
increased due to the increase in polarity of the extracting
solvents.
α-Glucosidase Inhibitory Activity. Table 2 also shows the
α-glucosidase inhibitory activity of the extracts. The extracts
were tested at an initial concentration of 10 mg/mL (a final
concentration of 1.25 mg/mL). Only six extracts were found
having above 50% of activity. The ethyl acetate extract of M.
charantia showed the highest percentage of α-glucosidase
inhibition activity (66.64 ± 2.94%). The antidiabetic activity of
this fruit had been scientifically proven by various pharmaco-
logical evaluations.6
Among the sequential extracts, the ethyl
acetate extract of M. charantia was found to have the highest
recovery of α-glucosidase inhibitors. Thus, sequential extraction
using hexane followed by chloroform and ethyl acetate could be
considered as the most appropriate procedure for extracting α-
glucosidase inhibitors from M. charantia.
This comparative evaluation confirmed the contribution of α-
glucosidase inhibitors in enhancing the antidiabetic potential of
the extract. Several antidiabetic compounds with low ability to
inhibit α-glucosidase had been isolated from the fruit.43,44
According to a study by Kwon et al.,45
phenolic compounds
such as protocatechuic acid, vanillic acid, caffeic acid, and
catechin, which were identified from M. charantia fruit (Table
1), have high α-glucosidase inhibitory activity. Therefore, these
results suggest that phenolic compounds in M. charantia may
play an important role in the inhibition of α-glucosidase. The
ethyl acetate extract of T. cucumerina (61.91 ± 1.96%) and the
methanol extract of L. siceraria (61.25 ± 2.57%) were ranked
top two, when analyzed by the assay. Their activities are in line
with their high TPCs (17.45 ± 0.27 μg GAE/mg extract and
20.85 ± 0.12 μg GAE/mg extract).
This is the first study highlighting the antidiabetic activity of
T. cucumerina fruit. Earlier studies had reported the
hypoglycemic activity of the seed and leaf extracts.46,47
Meanwhile, the presence of various classes of phenolic
compounds in L. siceraria fruit (Table 1) may be responsible
for the activity of the methanol and ethyl acetate extracts. The
results also revealed lower α-glucosidase inhibitory activity of
the sequential extracts of L. acutangula in comparison with the
results obtained by Pimple et al.7
using the crude water and
methanol extracts.
The results obtained from this study may provide more data
to the compilation of α-glucosidase inhibitors from plants by
Benalla et al.8
L. acutangula and M. charantia are no longer the
representatives of the cucurbit fruits that are reputed for having
α-glucosidase inhibitory activity, but the fruit extracts of L.
siceraria, S. edule, and T. cucumerina also demonstrated positive
results.
Correlation between Total Phenolic Content and
Bioactivities. As indicated in Table 3, the highest positive
linear correlation (r = 0.99) was observed between the TPCs
and DPPH free radical scavenging activities of the extracts of S.
edule. Similarly, the TPCs in the extracts of B. hispida were
notably correlated with their reducing power values (r = 0.97).
These findings strongly suggested that the antioxidant activities
of these two fruits were related to their TPCs. Several flavones
have been identified from different plant parts of S. edule, with
trace amounts of vicenin 2, vitexin, and luteolin 7-O-rutinoside
in the methanol extract of the fruit (Table 1).34
Meanwhile,
three flavonoids isolated from B. hispida fruit pulp were astilbin,
catechin, and naringenin (Table 1).48
These compounds might
Journal of Agricultural and Food Chemistry Article
dx.doi.org/10.1021/jf4031037 | J. Agric. Food Chem. 2013, 61, 10080−10090
10085
7. act synergistically or individually to enhance the activities of the
extracts. The scavenging, reducing, and α-glucosidase inhibitory
activities of L. siceraria and S. edule extracts were found to be
strongly correlated with their TPCs (with r values >0.80).
In contrast, the highest correlation between TPC and
chelating capacity, with a lower r value of 0.73, was obtained
among the extracts of L. acutangula. The low and inverse
correlations of TPC with this antioxidant activity proved that
the mechanism of action of this assay was not influenced by the
TPC, but may possibly rely on the structure−activity
relationships of the active compounds.38
For the extracts of
C. maxima, inverse correlations were observed between their
TPCs and bioactivities. This means that there were compounds
other than phenolics that possibly contributed to the activities.
As indicated in Table 1, the major contents of total carotenoids,
β-carotene,39
and vitamin A40
and the presence of a water-
soluble polysaccharide14
in C. maxima fruit might also account
for the increased antioxidant activities. Our findings also
assisted in verifying the weak to moderate correlations between
the TPCs and antioxidant activities of M. charantia16
and T.
cucumeria as previously reported.10
However, their TPCs were
well correlated with the α-glucosidase inhibitory activities (with
r values >0.80). A study by Wongsa et al.49
found a higher
contribution of TPC than individual phenolic (caffeic acid and
p-coumaric acid) in increasing the potential inhibition against
α-glucosidase of 30 culinary herbs commonly consumed in
Thailand.
Different reports were found in the literature whereby some
authors suggested correlations between TPCs and antioxidant
activities, but others found no such relationship.16,31,32
These
variations in correlations could be due to the possible
interaction (either synergistic or antagonistic) of diverse types
and relative amounts of phytochemicals in the extracts that
might have led to different responses in different antioxidant
assays.28
Fractionation of the Methanol Extract of L. siceraria
and the Ethyl Acetate Extract of S. edule. The results in
Table 3 reveal a strong correlation between TPC and primary
antioxidant activity (measured by the DPPH and ferric
reducing assays) and the α-glucosidase inhibitory activity of
extracts obtained from L. siceraria and S. edule pulps. Among
their extracts, the methanol extract of L. siceraria and the ethyl
acetate extract of S. edule with the highest TPCs and activities
(Table 2) were further analyzed. Four fractions were separated
from each extract and were subjected to DPPH, ferric reducing,
and α-glucosidase inhibitory tests. The results are shown in
Table 4. Fraction LS3 from the methanol extract of L. siceraria
and fraction SE4 from the ethyl acetate extract of S. edule with
the highest activities in all assays were further purified.
Isoquercitrin (quercetin-3-O-glucoside), which was previ-
ously reported by Gangwal et al.33
in L. siceraria, was purified
and identified from fraction LS3, whereas gallic acid was
identified from fraction SE4. The identities of the compounds
were confirmed by cochromatographic comparisons with
authentic markers (using various mobile phases on paper
chromatography and UPLC). The Rf values in paper
chromatographies, UPLC retention times, and UV spectra of
the compounds were found to be similar to those of the
markers or standards. After spiking with the standard (1:1), the
peak area on the UPLC chromatogram and the absorbance
value of the UV spectrum (detected by photodiode array
Table 3. Pearson’s Correlation Coefficients (r) between
Total Phenolic Contents and Antioxidant Activities
(Obtained from Three Independent Tests) within the
Extracts Obtained from Each Vegetablea
metal chelating
activity DPPH
reducing
power
α-glucosidase
inhibition
Benincasa hispida 0.43 −0.69 0.97* 0.04
Cucurbita
maxima
−0.62 −0.86 −0.34 −0.89
Lagenaria
siceraria
0.41 0.91 0.88 0.82
Luffa acutangula 0.73 −0.22 0.79 0.76
Momordica
charantia
0.60 0.76 0.34 0.80
Sechium edule 0.47 0.99* 0.91 0.83
Trichosanthes
cucumerina
−0.14 0.81 0.37 0.86
a
An asterisk (*) indicates significance at p < 0.05.
Table 4. Rf Values and Colors of Bands Developed in Paper Chromatograms of Fractions and Compounds Isolated from the
Methanol Extract of Lagenaria siceraria and the Ethyl Acetate Extract of Sechium edule and Their Antioxidant Activitiesa
Rf value (×100) in
BAW
color (in long-wave
UV light)
DPPH
(mM TE/g sample)
reducing power
(mM AscAE/g sample)
α-glucosidase
inhibition (%)
methanol extract of Lagenaria
siceraria
625.24 ± 19.88f 337.33 ± 12.09f 61.25 ± 2.57b
fraction LS1 30 yellow 171.24 ± 3.28h 226.70 ± 5.66g na
fraction LS2 55 blue 606.12 ± 11.02f 636.12 ± 14.29e na
fraction LS3 65 dark 801.76 ± 10.24e 1722.92 ± 12.86d 63.90 ± 6.00b
fraction LS4 90 blue 267.64 ± 8.58gh 349.12 ± 3.93f na
isoquercitrin (isolated from
fraction LS3)
65 dark 3128.40 ± 22.71b 2536.32 ± 16.45b 83.03 ± 0.68a
ethyl acetate extract of Sechium
edule
946.88 ± 22.24d 312.39 ± 7.49f 51.49 ± 2.13c
fraction SE1 30 yellow 286.08 ± 15.12gh 28.11 ± 2.08h na
fraction SE2 40 dark 302.36 ± 11.92g 181.36 ± 5.50g na
fraction SE3 60 dark 349.32 ± 10.92g 401.71 ± 4.16f na
fraction SE4 75 blue 1404.04 ± 14.68c 2132.80 ± 17.79c 58.76 ± 3.45b
gallic acid (isolated from fraction
SE4)
75 blue 5371.20 ± 17.07a 4285.54 ± 11.76a 35.07 ± 0.98d
a
Values are means ± standard deviations of triplicate analyses. Values followed by different letters are significantly different (p < 0.05) as measured
by Duncan’s test. na, no activity.
Journal of Agricultural and Food Chemistry Article
dx.doi.org/10.1021/jf4031037 | J. Agric. Food Chem. 2013, 61, 10080−10090
10086
8. detector) of each isolated compound were found to be
increased. No effect on the maximum wavelength (λmax, nm)
of each UV spectrum was observed. We believe that this is the
first report on the occurrence of gallic acid in an S. edule fruit
extract. A study had found only a trace amount of three
glycosidic flavones in the methanol extract of S. edule fruit.33
In
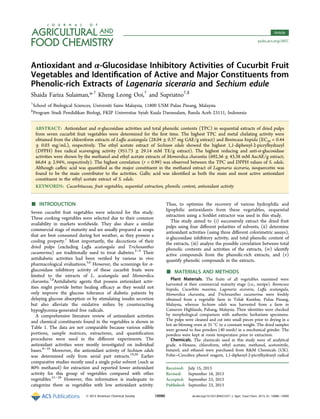
Figure 1. UPLC chromatograms of (a) ethyl acetate extract of Lagenaria siceraria (at 280 nm), (b) methanol extract of Lagenaria siceraria (at 350
nm), (c) ethyl acetate extract of Sechium edule (at 280 nm), and (d) methanol extract of Sechium edule (at 350 nm). The UV spectra of peaks 1−8
assessed by a photodiode array detector are also indicated.
Journal of Agricultural and Food Chemistry Article
dx.doi.org/10.1021/jf4031037 | J. Agric. Food Chem. 2013, 61, 10080−10090
10087
9. this study, the flavones in the ethyl acetate extract appeared as
dark bands (in long-wave UV light) and were separated as SE2
and SE3. However, the antioxidant activities of these flavone
fractions were significantly lower than that of fraction SE4.
The antioxidant activities of the isolated compounds were
found to be higher than those of their original extracts and
fractions (Table 4). Thus, they could be considered as major
contributors to the antioxidant activities of the extracts. The
highest activity of gallic acid in both assays could be related to
its chemical structure containing galloyl groups. In comparison,
isoquercitrin is a glycosidic quercetin with glycosylation of the
glucoside at the 3-position of the C-ring, which has been found
to decrease its efficiency as an antioxidant compared with that
of quercetin.50
Its quercetin structure with antioxidant
functional groups such as o-dihydroxy groups at the B-ring
and a 2,3-double bond in conjugation with a 4-oxo function are
essential structural elements that strengthen its activities.51
The isolated compounds were also tested for their α-
glucosidase inhibitory activity, and the results revealed the
highest inhibitory activity of isoquercitrin from the methanol
extract of L. siceraria. According to Shibano et al.,52
the α-
glucosidase inhibiting potential of isoquercitrin is comparable
with that of 1-deoxynojirimycin (a commercial α-glucosidase
inhibitor). They also found higher activity of this compound
compared with other glycosidic flavonols and flavones (such as
isorhamnetin 3-O-rutinoside and vitexin). Thus, isoquercitrin is
identified as the major contributor to the α-glucosidase
inhibitory activity of the methanol extract of L. siceraria. Gallic
acid (with higher antioxidant activities) showed lower ability as
an α-glucosidase inhibitor than the ethyl acetate extract of S.
edule. Thus, the higher activity of the extract might be
contributed by the synergistic effect of the compounds in the
extract. Gallic acid was previously reported to have low α-
glucosidase activity in comparison with other phenolic
compounds.45
Quantification of Phenolic Constituents in L. siceraria
and S. edule Extracts. As indicated in Table 1, many
polyphenolics have been identified from extracts of L.
siceraria18,33,37
and S. edule fruits.34
Thus, some of the
polyphenolics were used as standards. Figure 1 shows the
UPLC chromatograms of the ethyl acetate extracts of L.
siceraria and S. edule (at 280 nm), the methanol extracts of L.
siceraria and S. edule (at 350 nm), and the UV spectra of eight
labeled peaks determined by the photodiode array detector.
Only five peaks (1, 2, 3, 5, and 8) were positively identified by
comparisons with standards. The UV spectra of peaks 4 and 6
are very similar to those derived from luteolin and were
quantified as luteolin equivalents. The UV spectrum of peak 7
is most likely a derivative of caffeic acid and was quantified as
caffeic acid equivalents. The contents of these compounds in
the extracts are summarized in Table 5.
No phenolic compounds were detected in the hexane
extracts of both samples and the chloroform extract of S.
edule. Only peak 7 (caffeic acid derivative; UV λmax 240.4 and
324.7 nm) was detected in the chloroform extract of L. siceraria.
Caffeic acid (peak 3; UV λmax 242.6 and 329.5 nm) and the
caffeic acid derivative (peak 7) were measured at the highest
level from the ethyl acetate extract of L. siceraria (Figure 1a;
Table 5). Mohan et al.18
had isolated caffeic acid and three
caffeic acid derivatives from the ethyl acetate extract of L.
siceraria (Table 1). One of the derivatives was 3,4-
dimethoxycinnamic acid, which is derived from caffeic acid (a
3,4-dihydroxycinnamic acid) by the substitution of the o-
dihydroxy at the 3- and 4-positions with methoxy groups. The
other two derivatives originate from the coupling of caffeic acid
with the glucosidic phenolic acids p-hydroxybenzoic acid [to
form (E)-4-(hydroxymethyl)phenyl-6-O-caffeoyl-β-D-glucopyr-
anoside] and protocatechuic acid [to form 1-(2-hydroxy-4-
hydroxymethyl)phenyl-6-O-caffeoyl-β-D-glucopyranoside]. The
caffeic acid derivative that was detected in this study is most
likely one of these. The UV spectrum and retention time of
peak 5 in the UPLC chromatogram of the methanol extract of
L. siceraria (Figure 1b) corresponded to that of the
isoquercitrin standard (UV λmax 259 and 363 nm). However,
the low content of this compound was measured from the
extract and caffeic acid (peak 3) was also identified as the major
compound. The catechol moiety of isoquercitrin and caffeic
acid might be the key contributor to the antioxidant activity of
this extract.
The ethyl acetate extract of S. edule (Figure 1c) was found to
have the highest content of gallic acid (peak 1; UV λmax 220.6
and 271.4 nm). Low content of caffeic acid (peak 3) and
moderate contents of luteolin (peak 8; UV λmax 268 and 350
nm) and luteolin derivative 2 (peak 6; UV λmax 253 and 345.7
Table 5. Contents of Phenolic Constituents in Extracts of Lagenaria siceraria and Sechium edulea
1 2 3 4 5 6 7 8
(gallic acid) (vitexin) (caffeic acid)
(luteolin
derivative 1)b
(isoquercitrin)
(luteolin
derivative 2)b
(caffeic acid
derivative)c
(luteolin)
retention time
(min)
1.45 3.38 3.49 3.53 3.62 3.71 3.76 4.50
Lagenaria siceraria
hexane
chloroform 52.39 ± 3.92
ethyl acetate 8.99 ± 0.71 97.69 ± 5.35 63.25 ± 3.28
methanol 5.70 ± 0.59 95.37 ± 3.83 13.70 ± 1.23
Sechium edule
hexane
chloroform
ethyl acetate 93.41 ± 10.86 7.22 ± 0.48 31.48 ± 3.57 24.58 ± 2.01
methanol 4.82 ± 0.32 5.35 ± 0.14 10.49 ± 0.81 10.03 ± 0.83
a
Values are means ± standard deviations (mg/100 g extract, except as noted) of triplicate analyses. b
Expressed as luteolin equivalents. c
Expressed as
caffeic acid equivalents.
Journal of Agricultural and Food Chemistry Article
dx.doi.org/10.1021/jf4031037 | J. Agric. Food Chem. 2013, 61, 10080−10090
10088
10. nm) were also quantified from the extract. Andarwulan et al.20
also quantified a low content of caffeic acid in a hydrolyzed leaf
extract of this plant. As indicated in Table 5, low contents of
gallic acid (peak 1), vitexin (peak 2; UV λmax 271.4 and 335.6
nm), and two luteolin derivatives (peak 4; UV λmax 254.9 and
351.3 nm and peak 6) were also detected from the methanol
extract of S. edule (Figure 1d). Luteolin derivative 1 (peak 4) is
most likely luteolin 7-O-rutinoside (an O-glycosidic flavone),
which was detected in a methanol extract of S. edule fruit.34
The
results in Table 5 also revealed 100% recovery of this
compound in the methanol extract, which was similar to that
of another C-glycosidic flavone (vitexin; peak 2) and an O-
glycosidic flavonol (isoquercitrin; peak 5). Moreover, 100%
recovery of luteolin (peak 8) was observed in the ethyl acetate
extract of S. edule. Luteolin derivative 2 (peak 6), which was
76% recovered by ethyl acetate, might be a methylated luteolin.
Two methylated luteolins that were previously detected in the
leaves and stems of S. edule are chrysoeriol (3′-methoxyluteo-
lin) and diosmetin (4′-methoxyluteolin).34
Furthermore, the
recoveries of gallic acid (peak 1), caffeic acid (peak 3), and the
caffeic acid derivative (peak 7) were also found to be higher in
ethyl acetate extracts than in extracts acquired using methanol.
The results obtained from this study revealed the effect of
sequential extraction using ascending polarity of extracting
solvents on the TPCs and antioxidant and α-glucosidase
inhibitory activities of the fruit vegetables. Although the pulps
of these vegetables were obtained from the same family
(Cucurbitaceae) at similar commercial maturity stages (unripe),
different solvent systems were required to optimize the
recovery of their TPCs and antioxidant compounds. The
correlation analysis suggested a strong relationship between
TPC and primary antioxidant and α-glucosidase inhibitory
activities of extracts obtained from L. siceraria and S. edule fruits.
On the basis of the results obtained from the bioactivity-guided
fractionation of two phenolic-rich extracts (the methanol
extract of L. siceraria and the ethyl acetate extract of S. edule),
two phenolic compounds (isoquercitrin and gallic acid),
isolated from the respective extracts, were found to be
responsible for enhancing the antioxidant activities of the
extracts. Isoquercitrin was also identified as an α-glucosidase
inhibitor. Gallic acid was measured as the most abundant
phenolic in the ethyl acetate extract of S. edule, whereas only a
low content of isoquercitrin was detected in the methanol
extract of L. siceraria. As these vegetables are widely available,
the antioxidant information obtained by this study would be
useful for promoting their consumption and for further
epidemiology research.
■ AUTHOR INFORMATION
Corresponding Author
*(S.F.S.) Phone: +60-4-6534095. Fax: +60-4-6565125. E-mail:
shaida@usm.my.
Funding
We acknowledge the Universiti Sains Malaysia for financial
support (research university grant 1001/PBIOLOGI/813049).
Notes
The authors declare no competing financial interest.
■ REFERENCES
(1) Ong, H. C. Sayuran: Khasiat Makanan & Ubatan; Utusan
Publication and Distributors: Kuala Lumpur, Malaysia, 2004; pp 2−9.
(2) Him-Che, Y. Handbook of Chinese Herbs and Formulas; Institute
of Chinese Medicine: Los Angeles, CA, USA, 1985; pp 120−201.
(3) Covington, M. B. Traditional Chinese medicine in the treatment
of diabetes. Diabetes Spectr. 2001, 14, 154−159.
(4) Andrade-Cetto, A.; Heinrich, M. Mexican plants with
hypoglycaemic effect used in the treatment of diabetes. J. Ethno-
pharmacol. 2005, 99, 325−348.
(5) Zhang, Y.; Yao, H. Study on the effect of hypoglycemia of
different type pumpkin. J. Chin. Food Sci. 2002, 23, 118−120.
(6) Dhiman, K.; Gupta, A.; Sharma, D. K.; Gill, N. S.; Goyal, A. A
review on the medicinally important plants of the family
Cucurbitaceae. Asian J. Clin. Nutr. 2012, 4, 16−26.
(7) Pimple, B. P.; Kadam, P. V.; Patil, M. J. Antidiabetic and
antihyperlipidemic activity of Luffa acutangula fruit extracts in
Streptozotocin induced NIDDM rats. Asian J. Pharm. Clin. Res. 2011,
4, 156−163.
(8) Benalla, W.; Bellahcen, S.; Bnouham, M. Antidiabetic medicinal
plants as a source of α-glucosidase inhibitors. Curr. Diabetes Rev. 2010,
6, 247−254.
(9) Huang, H. Y.; Huang, J. J.; Tso, T. K.; Tsai, Y. C.; Chang, C. K.
Antioxidant and angiotension-converting enzyme inhibition capacities
of various parts of Benincasa hispida (wax gourd). Nahrung 2004, 48,
230−233.
(10) Adebooye, O. C. Phyto-constituents and antioxidant activity of
the pulp of snake tomato (Trichosanthes cucumerina L.). Afr. J. Tradit.
Complem. 2008, 5, 173−179.
(11) Kubola, J.; Siriamornpun, S. Phenolic contents and antioxidant
activities of bitter gourd (Momordica charantia L.) leaf, stem and fruit
fraction extracts in vitro. Food Chem. 2008, 110, 881−890.
(12) Wu, S.-J.; Ng, L.-T. Antioxidant and free radical scavenging
activities of wild bitter melon (Momordica charantia Linn var.
abbreviata Ser.) in Taiwan. LWT−Food Sci. Technol. 2008, 41, 323−
330.
(13) Erasto, P.; Mbwambo, Z. H. Antioxidant activity and HPTLC
profile of Lagenaria siceraria fruits. Tanzan. J. Health Res. 2009, 11,
79−83.
(14) Nara, K.; Yamaguchi, A.; Maeda, N.; Koga, H. Antioxidative
activity of water soluble polysaccharide in pumpkin fruits (Cucurbita
maxima Duchesne). Biosci., Biotechnol., Biochem. 2009, 73, 1416−1418.
(15) Attarde, D. L.; Kadu, S. S.; Chaudhari, B. J.; Kale, S. S.;
Bhamber, R. S. In vitro antioxidant activity of pericarp of Cucurbita
maxima Duch. ex Lam. Int. J. PharmTech Res. 2010, 2, 1533−1538.
(16) Horax, R.; Hettiarachchy, N.; Chen, P. Extraction, quantifica-
tion, and antioxidant activities of phenolics from pericarp and seeds of
bitter melons (Momordica charantia) harvested at three maturity stages
(immature, mature, and ripe). J. Agric. Food Chem. 2010, 58, 4428−
4433.
(17) Reddy, B. P.; Mohan, S. V.; Sarma, P. N. The protective role of
Luffa acutangula fruit methanolic fraction against t-BHP induced
oxidative damage in human erythrocytes. Curr. Trends Biotechnol.
Pharm. 2011, 5, 1073−1082.
(18) Mohan, R.; Birari, R.; Karmase, A.; Jagtap, S.; Bhutani, K. K.
Antioxidant activity of a new phenolic glycoside from Lagenaria
siceraria Stand. fruits. Food Chem. 2012, 132, 244−251.
(19) Ordonez, A. A. L.; Gomez, J. D.; Vattuone, M. A.; Isla, M. I.
Antioxidant activities of Sechium edule (Jacq.) Swartz extracts. Food
Chem. 2006, 97, 452−458.
(20) Andarwulan, N.; Kurniasih, D.; Apriady, R. A.; Rahmat, H.;
Roto, A. V.; Bolling, B. W. Polyphenols, carotenoids, and ascorbic acid
in underutilized medicinal vegetables. J. Funct. Foods 2012, 4, 339−
347.
(21) Ansari, N. M.; Houlihan, L.; Hussain, B.; Pieroni, A. Antioxidant
activity of five vegetables traditionally consumed by South-Asian
migrants in Bradford, Yorkshire, UK. Phytother. Res. 2005, 19, 907−
911.
(22) Chanwitheesuk, A.; Teerawutgulrag, A.; Rakariyatham, N.
Screening of antioxidant activity and antioxidant compounds of
some edible plants of Thailand. Food Chem. 2005, 92, 491−497.
(23) Yang, R.-Y.; Tsou, S. C. S.; Lee, T.-C.; Wu, W.-J.; Hanson, P.
M.; Kuo, G.; Engle, L. M.; Lai, P.-Y. Distribution of 127 edible plant
Journal of Agricultural and Food Chemistry Article
dx.doi.org/10.1021/jf4031037 | J. Agric. Food Chem. 2013, 61, 10080−10090
10089
11. species for antioxidant activities by two assays. J. Sci. Food Agric. 2006,
86, 2395−2403.
(24) Stangeland, T.; Remberg, S. F.; Lye, K. A. Total antioxidant
activity in 35 Ugandan fruits and vegetables. Food Chem. 2009, 113,
85−91.
(25) Gacche, R. N.; Kabaliye, V. N.; Dhole, N. A.; Jadhav, A. D.
Antioxidant potential of selected vegetables commonly used in diet in
Asian subcontinent. Indian J. Nat. Prod. Resour. 2010, 1, 306−313.
(26) Isabelle, M.; Lee, B. L.; Lim, M. T.; Koh, W.-P.; Huang, D.;
Ong, C. N. Antioxidant activity and profiles of common vegetables in
Singapore. Food Chem. 2010, 120, 993−1003.
(27) Raghu, K. L.; Ramesh, C. K.; Srinivasa, T. R.; Jamuna, K. S.
DPPH scavenging and reducing power properties in common
vegetables. Res. J. Pharm. Biol. Chem. Sci. 2010, 1, 399−406.
(28) Sreeramulu, D.; Raghunath, M. Antioxidant and phenolic
content of roots, tuber and vegetables commonly consumed in India.
Food Res. Int. 2010, 43, 1017−1020.
(29) Singleton, V. L.; Orthofer, R.; Lamuela-Raventos, R. M. Analysis
of total phenols and other oxidation substrates and antioxidants by
means of Folin-Ciocalteau reagent. Method Enzymol. 1999, 299, 152−
178.
(30) Ooi, K. L.; Muhammad, T. S. T.; Tan, M. L.; Sulaiman, S. F.
Cytotoxic, apoptotic and anti-α-glucosidase activities of 3,4-di-O-
caffeoyl quinic acid, an antioxidant isolated from the polyphenolic-rich
extract of Elephantopus mollis Kunth. J. Ethnopharmacol. 2011, 135,
685−695.
(31) Sulaiman, S. F.; Yusoff, N. A. M.; Eldeen, I. M.; Seow, E. M.;
Sajak, A. A. A.; Supriatno; Ooi, K. L. Correlation between total
phenolic and mineral contents with antioxidant activity of eight
Malaysian bananas (Musa sp.). J. Food Compos. Anal. 2011, 24, 1−10.
(32) Zhuang, Y.; Chen, L.; Sun, L.; Cao, J. Bioactive characteristics
and antioxidant activities of nine peppers. J. Funct. Foods 2012, 4, 331−
338.
(33) Gangwal, A.; Parmar, S. K.; Sheth, N. R. Triterpenoid,
flavonoids and sterols from Lagenaria siceraria fruits. Pharm. Lett.
2010, 2, 307−317.
(34) Siciliano, T.; De Tommasi, N.; Morelli, I.; Braca, A. Study of
flavonoids of Sechium edule (Jacq) Swartz (Cucurbitaceae) different
edible organs by liquid chromatography photodiode array mass
spectrometry. J. Agric. Food Chem. 2004, 52, 6510−6515.
(35) Liu, X.; Cui, C.; Zhao, M.; Wang, J.; Luo, W.; Yang, B.; Jiang, Y.
Identification of phenolics in the fruit of emblica (Phyllanthus emblica
L.) and their antioxidant activities. Food Chem. 2008, 109, 909−915.
(36) Prasad, K. N.; Chew, L. Y.; Khoo, H. E.; Kong, K. W.; Azlan, A.;
Ismail, A. Antioxidant capacities of peel, pulp, and seed fractions of
Canarium odontophyllum Miq. Fruit. J. Biomed. Biotechnol. 2010,
871379.
(37) Krauze-Baranowska, M.; Cisowski, W. Isolation and identi-
fication of C-glycosides flavone from Lagenaria siceraria L. Acta Pol.
Pharm. 1995, 52, 137−139.
(38) Andjelković, M.; Camp, J. V.; Meulenaer, D. B.; Depaemelaere,
G.; Socaciu, C.; Verloo, M.; Verhe, R. Iron-chelation properties of
phenolic acids bearing catechol and galloyl groups. Food Chem. 2006,
98, 23−32.
(39) Kandlakunta, B.; Rajendran, A.; Thingnganing, L. Carotene
content of some common (cereals, pulses, vegetables, spices and
condiments) and unconventional sources of plant origin. Food Chem.
2008, 106, 85−89.
(40) Rahman, A. H. M. M.; Anisuzzaman, M.; Ferdous, A.; Rafiul
Islam, A. K. M.; Naderuzzaman, A. T. M. Study of nutritive value and
medicinal uses of cultivated cucurbits. J. Appl. Sci. Res. 2008, 4, 555−
558.
(41) Sahreen, S.; Khan, M. R.; Khan, R. A. Evaluation of antioxidant
activities of various solvent extracts of Carissa opaca fruits. Food Chem.
2010, 122, 1205−1211.
(42) Lin, K.-W.; Yang, S.-C.; Lin, C.-N. Antioxidant constituents
from stems and fruits of Momordica charantia. Food Chem. 2011, 127,
609−614.
(43) Nhiem, N. X.; Kiem, P. V.; Minh, C. V.; Ban, N. K.; Cuong, N.
X.; Tung, N. H.; Ha, L. M.; Kim, Y. H. α-Glucosidase inhibition
properties of cucurbitane-type triterpene glycosides from the fruits of
Momordica charantia. Chem. Pharm. Bull. 2010, 58, 720−724.
(44) Mata, R.; Cristians, S.; Escandón-Rivera, S.; Juárez-Reyes, K.;
Rivero-Cruz, I. Mexican antidiabetic herbs: valuable sources of
inhibitors of α-glucosidases. J. Nat. Prod. 2013, 76, 468−483.
(45) Kwon, Y.-I.; Apostolidis, E.; Shetty, K. Inhibitory potential of
wine and tea against α-amylase and α-glucosidase for management of
hyperglycemia linked to type 2 diabetes. J. Food Biochem. 2008, 32,
15−31.
(46) Kar, A.; Choudhary, B. K.; Bandyopadhyay, N. G. Comparative
evaluation of hypoglycemic activity of some Indian medicinal plants in
alloxan diabetic rats. J. Ethnopharmacol. 2003, 84, 105−108.
(47) Kirana, H.; Srinivasan, B. P. Trichosanthes cucumerina Linn.
improves glucose tolerance and tissue glycogen in non insulin
dependent diabetes mellitus induced rats. Indian J. Pharmacol. 2008,
40, 103−106.
(48) Du, Q.; Zhang, Q.; Ito, Y. Isolation and identification of
phenolic compounds in fruit of Benincasa hispida by HSCCC. J. Liq.
Chromatogr. Relat. Technol. 2005, 28, 137−144.
(49) Wongsa, P.; Chaiwarit, J.; Zamaludien, A. In vitro screening of
phenolic compounds, potential inhibition against α-amylase and α-
glucosidase of culinary herbs in Thailand. Food Chem. 2012, 131, 964−
971.
(50) Firuzi, O.; Lacanna, A.; Petrucci, R.; Marrosu, G.; Saso, L.
Evaluation of the antioxidant activity of flavonoids by “ferric reducing
antioxidant power” assay and cyclic voltammetry. Biochim. Biophys.
Acta 2005, 1721, 174−184.
(51) Soobrattee, M. A.; Neergheen, V. S.; Luximon-Ramma, A.;
Aruoma, O. I.; Bahorun, T. Phenolics as potential antioxidant
therapeutic agents: mechanism and actions. Mutat. Res.−Fundam.
Mol. Mech. Mutagen. 2005, 579, 200−213.
(52) Shibano, M.; Kakutani, K.; Taniguchi, M.; Yasuda, M.; Baba, K.
Antioxidant constituents in dayflower (Commelina communis L.) and
their α-glucosidase inhibitory activity. J. Nat. Med. 2008, 62, 349−353.
(53) Dragovic-Uzelac, V.; Delonga, K.; Levaj, B.; Djakovic, S.;
Pospisil, J. Phenolic profiles of raw apricots, pumpkins and their purees
in the evaluation of apricot nectar and jam authenticity. J. Agric. Food
Chem. 2005, 53, 4836−4842.
(54) Ghosh, K.; Chandra, K.; Ojha, A. K.; Sarkar, S.; Islam, S. S.
Structural identification and cytotoxic activity of a polysaccharide from
the fruits of Lagenaria siceraria (Lau). Carbohydr. Res. 2009, 344, 693−
698.
Journal of Agricultural and Food Chemistry Article
dx.doi.org/10.1021/jf4031037 | J. Agric. Food Chem. 2013, 61, 10080−10090
10090