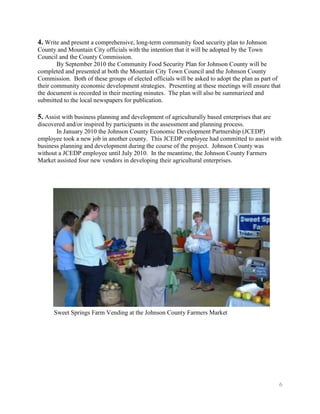
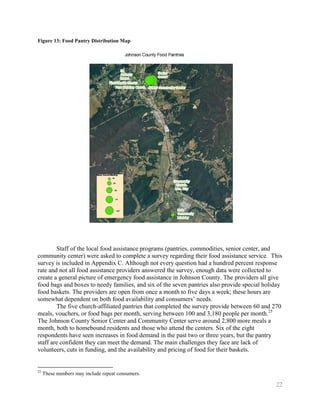
This document summarizes a community food assessment project conducted in Johnson County, Tennessee. It describes the socioeconomic characteristics of the county, analyzes food resources and production/consumption patterns, and identifies opportunities and challenges for improving food security. Community engagement activities revealed residents' desire to increase access to locally-grown foods. The report concludes by outlining five projects to pursue, as identified by the community, to develop a more self-sufficient and equitable local food system.
![economy. [They] do this by providing education, engaging in community and economic
development, and promoting the availability and benefits of local food and agriculture.‖26
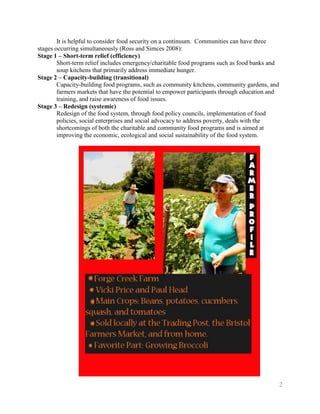
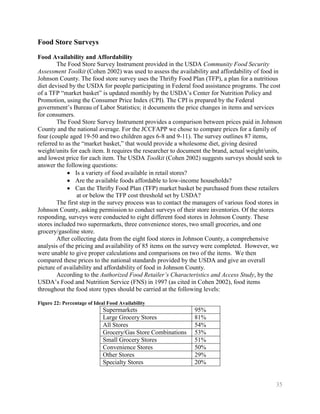
The Johnson County Farmers Market received a grant from the USDA Farmers Market
Promotion Program in September 2009 with Appalachian Native Plants, Inc. as the fiscal agent.
This grant allows vendors to accept food stamps (Supplemental Nutrition Assistance Program) at
this market, provided support materials and labor needed to implement this program, and
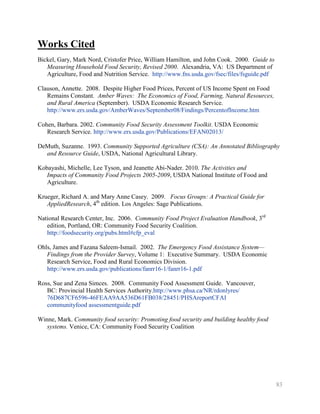
promoted this service, the market, and its vendors. Nationwide, farmers markets started
accepting food stamps only five years ago whereas grocery stores have been accepting these
benefits for many years. JCFM subsequently received the opportunity to double dollars for food
stamp customers. This program made possible by a sub-grant through Appalachian Sustainable
Development from the Wholesome Wave Foundation. The double dollar opportunity is a great
example of how private funding can help support federal programs and increase the power of
local food dollars that recycle within the community.
With the assistance of our local health educator, the Johnson County Farmers Market
submitted applications in 2009 for to the Senior and WIC Farmers Market Nutrition Assistance
Program (SFMNP and WICFMNP). The application was not selected. The FMNP programs are
also eligible for double dollar assistance with private funds. Residents believe that locally
produced food is more expensive and is therefore unaffordable for low-income families. These
types of farmers market programs help put money in the pockets of local food producers and also
offer affordable fresh local foods for low-income consumers.
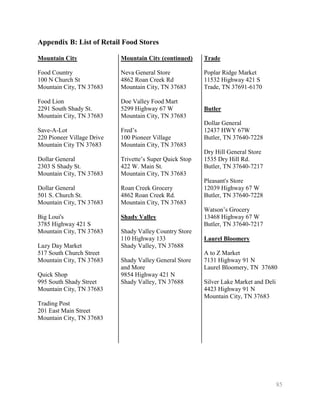
Most retail food stores, including the farmers market, are located within Mountain City
making accessibility an issue for residents living in the outskirts of the county. These consumers
access retail food stores in Virginia, North Carolina, and nearby cities like Elizabethton,
Tennessee. Sales tax rates are lower in neighboring states, encouraging travel to make food
purchases.
Educational Programs
Many educational programs are offered throughout Johnson County. The Vocational
Agriculture program at the high school, Johnson County Farmers Market, local businesses,
University of Tennessee Extension, and other organizations and individuals teach others about
food production, nutrition, cooking, and preservation.
Johnson County High School has one of the nation’s leading Vocational Agriculture
programs. Students can select from classes ranging from greenhouse production, hydroponics,
aquaponics, leadership, floriculture, agricultural mechanics, and various other topics.
The Johnson County Farmers Market has hosted workshops open to the public: food
safety and Good Agricultural Practices (GAPs), domestic kitchen certification, seed saving and
swapping, food independence/growing your own, beneficial garden insects, and ―tips and tricks
on how to sell at a farmers market‖.
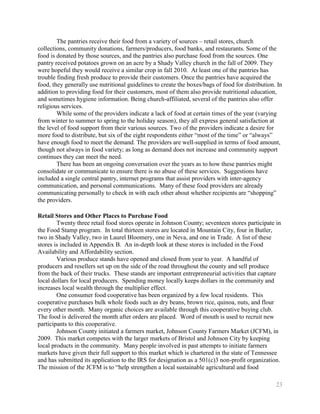
A week-long ―Camp Culinary‖ was hosted in July, 2010 by Mountain Citi Marketing.
Connections were made with Southeast Culinary Institute, which sent two professional chefs and
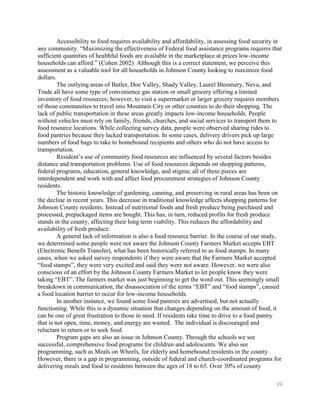
their assistants to teach various cooking techniques, knife skills and cutting styles, food
presentation, decorative food art, nutrition, kitchen safety, and sanitation. Some of the
assignments the students participated in were menu design, food graphics and in-depth
discussions regarding our health and the way we eat. Nelson Chapel Baptist Church provided
the use of their state of the art kitchen in their new Family Life Center.
26
http://www.johnsoncountyfarmersmarket.org/index.html
24](https://image.slidesharecdn.com/johnsoncountycommunityfoodfinal-121030103122-phpapp02/85/Community-Food-Security-in-Johnson-County-Tennessee-A-Local-Food-Strategy-31-320.jpg)
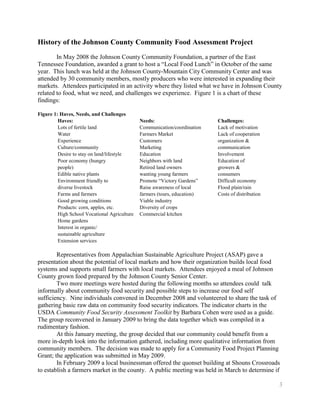
![Interviews with Key Stakeholders
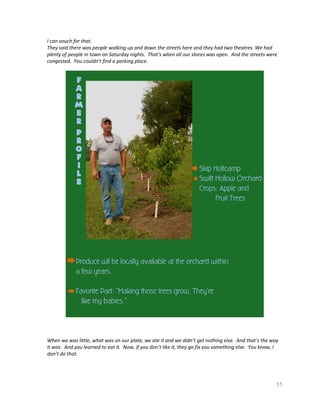
To evaluate community needs, nursing students from East Tennessee State University
conducted 16 interviews at the beginning of the Food Assessment and Planning Process. The
people interviewed were chosen based on their firsthand knowledge and experience with the
local Johnson County food system, and were identified by the Johnson County Food Security
Council. Farmers, government officials, community service personnel, and health educators
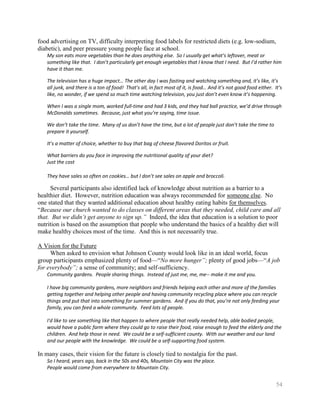
were interviewed.
The specific questions varied between the interviewers, the answers were grouped based
on theme. Except for the farmer interviews, which will be discussed later, the questions included
perceptions of food security in Johnson County, barriers to food security, specific assistance
programs available to residents, and recommendations to improve food security in the county.
The general perception of food security among the interviewees was that there are
individuals and families struggling to get enough to eat, though two government officials did
mention that it was probably negligence on the part of the parents if their children were hungry
because there is assistance for people who need it. All the other interviewees however, agreed
that there is a definite food security problem, and most mentioned that even if people do have
enough food to prevent hunger, food often is not healthy and nutritious.
According to every stakeholder, the largest barrier to food security is education.
Education was mentioned in several different contexts, ranging from basic gardening skills to
knowledge of how a local food economy operates. A lack of communication was cited by one of
the government officials, in the context of Johnson County being rural, making it difficult to
educate the people who live far from the county’s only incorporated town, Mountain City. This
lack of knowledge was echoed by several other interviewees, in terms of people being unaware
of assistance programs. The rural nature of the county also contributes to limited transportation,
as people may find it difficult to get to food pantries or WIC and food stamp registration
locations. Additionally, although Johnson County has recently implemented a farmers market,
residents travel to it, and not everyone has access to transportation. One interviewee mentioned
a new taxi service in Johnson County that may transport some people with fare.
Education was certainly the most cited barrier to food security, several other barriers
were mentioned. The educators in particular had a long list of barriers, but including problems
with receiving and using federal assistance, fast-paced lifestyles, cooking healthy food, lack of
transportation (both public and private), the relative affordability of unhealthy food, and lack of
fresh fruits and vegetables in the food distribution programs. The government officials and one
of the educators mentioned the poor economy as a contributor to food insecurity, as there are few
opportunities in the current job market. As one educator put it, ―[We’re] losing [our] youth
because there aren’t any jobs available.‖
A variety of food assistance programs were mentioned, but there was a lack of consistent
responses among the interviewees, indicating the aforementioned deficiency in communication
and need for education. The educators specifically talked about the Commodities program,
Summer Lunch Program, the Catholic Church distribution, the Food Lion bakery give away of
older baked goods to food assistance programs, and the School Lunch and Breakfast Programs.
The Senior Center employees mentioned the Commodities Program, the school and summer
programs, and added that there are seven food pantries, and the congregate and homebound
delivery meals their center provides. The government officials seemed unaware of many of the
programs, suggesting that food pantries would be helpful. Officials are aware of the Community
41](https://image.slidesharecdn.com/johnsoncountycommunityfoodfinal-121030103122-phpapp02/85/Community-Food-Security-in-Johnson-County-Tennessee-A-Local-Food-Strategy-48-320.jpg)
![And a lot of us just can’t hardly live. The income ain’t good.
I think a lot of people… I know me, I mean if you have that many girls. You feed your kids first and
whatever else is left, if that’s what you have, well you’re going to eat it.
When the kids are missing so much school, I say to them, “Did you have a great time on your days off?”
Sometimes kids would say to me, “I like to come to school because we get to eat here.” They didn’t have
enough to eat at home. It’s heartbreaking.
I know quite a few people that their medicine was so expensive that they didn’t get to buy no food that
month.
This problem is compounded by rising food prices.
Sometimes you got to go to three grocery stores just to get a little bag, because the prices of everything…
Well if everything is real high and they’re not having no sales, then your money’s not going to go that far.
So I mean a little tiny bag can cost you $30 and you ain’t got nothing.
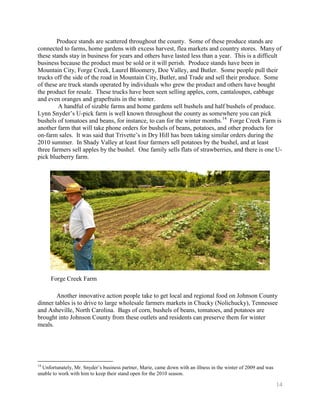
I was volunteering down there at [a local produce stand]. And they’re expensive, but we’re finding out
that it’s expensive everywhere. It’s just the cost of living is going up.
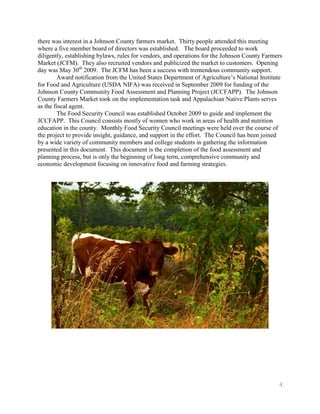
Johnson County families (in all income groups) are very resourceful, stretching their food
budgets and making food last longer. While shopping they: stock up at the beginning of the
month, buy generic items at the grocery store, sacrifice quality for lower price (particularly with
meat), select cheap food (e.g. spaghetti, rice, beans), and buy food on sale. At home they: make
sure that leftovers are not wasted, freeze items bought in bulk so that they do not spoil, add
garden vegetables to home cooked meals increasing the number of servings, eat seasonal
vegetables when they are plentiful, preserve food during the growing season, make soup or other
dishes that provide many servings, choose ingredients creatively to make the most out of what
they have, and prepare meals from scratch to save money on processed items (e.g. bread, potato
chips).
If I am getting toward the end of my food budget, then I go in my freezer and I see what I’ve stored in
there and make sure that I use it. So it doesn’t go to waste.
We kind of worry [about running out of food], but I try to keep everything stocked ahead. Where we
shop, we try to buy in bulk.
I take an inventory of what I have. And then I make up menus and then my grocery shopping will consist
of just making up for what we don’t have. You know, and that’s really helped, especially through this
winter.
Another thing that we do is we make sure that the leftovers get eaten.
I’ve had to eat spaghetti four times in a week; because that’s the cheapest thing that you can get. And
I’ve had beans and rice that many times too because beans and rice, you know, that’s the cheapest you
can do.
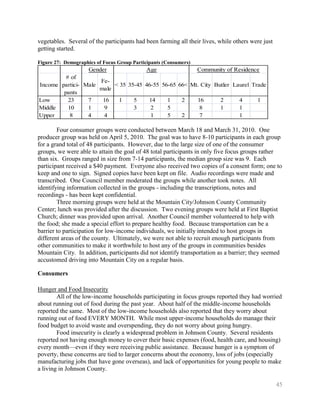
Food pantries and food stamps are very important to Johnson County households. All of the
low-income households represented at a focus group participate in some form of food assistance
program. Approximately 60% of the middle-income households reported the same. Most upper-
46](https://image.slidesharecdn.com/johnsoncountycommunityfoodfinal-121030103122-phpapp02/85/Community-Food-Security-in-Johnson-County-Tennessee-A-Local-Food-Strategy-53-320.jpg)
![income households have never participated in a food assistance program, but if they have, it was
a long time ago and/or for a limited period of time.
Several focus group participants mentioned that they simply would not have enough to eat
without these programs. Without assistance, they fear that they would starve to death. People
particularly rely on these programs during the winter (especially during the holidays) and at the
end of the month. Food stamps also help stretch the grocery budget because food purchased
using these benefits is not taxed.
Over there, they give pretty good food [at the Commodities distribution]. If it wouldn’t have been for
them one time, I wouldn’t have had nothing.
Yeah, we go to food pantries. Without [them] I wouldn’t have anything.
I wouldn’t either.
A lot of the churches, you can get at the church too.
Yeah, they give a lot of help.
Yeah, they help you out a lot.
How important are these food assistance programs to your household?
Very important.
Very important.
Yeah, very important, they’re very important.
Food stamps helps a lot. I mean they really do…I mean, if I didn’t have food stamps, I don’t know what I
would do. Because we would starve. Literally. We would.
The way the economy is now, you’ve got to get food stamps to even eat. I mean, by the time you pay
your bills, that’s just it.
People also rely on their friends, family, church, and neighbors for support. Focus group
participants in all income groups also report providing this type of support to others. They give
food away (especially from their gardens) and prepare meals together. For food insecure
households, this can mean sharing food that is needed to make it through the month. When
family comes over to eat (either because they’re visiting or because they don’t have any food
either) it makes it particularly difficult to make it to the end of the month.
I give a lot of deer away. I usually, if somebody wants me to kill them one, I will.
That’s what helps me a lot, is friend’s gardens.
Even when I didn’t have anything I was still helping somebody else.
I probably give 80% of my garden away, just to local people, you know.
Well our neighbor that lives next door to us, a lot of times we’ll cook and she’ll cook and we just, you
know, give her part of our food and she gives us something back. You know, just sharing. That way one
person doesn’t have to cook everything.
That’s how my neighbor is. He’ll help cook, or I’ll cook and we’ll invite him over one night or he’ll invite us
over when he does. My husband’s mom or one of them will invite us and that helps a lot too. I’ve found
this is a really well meaning society. People really do help each other, they care about each other.
Well last night my son ran out of food… so he asked me to fix him supper and I fixed him supper. My son
he gets food stamps and he has a job, but he don’t make much at his job. He only gets 2 something a
week and he has bills. Like myself, I got bills and sometimes I run out of food. Most time, I got food
47](https://image.slidesharecdn.com/johnsoncountycommunityfoodfinal-121030103122-phpapp02/85/Community-Food-Security-in-Johnson-County-Tennessee-A-Local-Food-Strategy-54-320.jpg)
![Sometimes we even get a case of water, sometimes they give us juices. I mean you know just different
stuff. Sometimes they give us bread. It's just depending on what they have. Big cans, sometimes you get
the gallon cans of stuff.
What is it about that particular place that makes it worthwhile to drive out of the county to go versus
the pantries that are here?
Well even if you have $10 for the gas to go over there, what they give you and stuff, you can't buy that
kind for that.
Plus it's a hot meal instead of a cold meal. That they provide for you.
Well a lot of them here, like you say, you can only go to them certain times, this is year round, every
Tuesday. They even have dentists over there that comes in and will help you if you participate in a
program.
So they'll give you about 3 times more than what the [local] pantries will.
Oh yes.
I mean it's not like bags, its boxes of stuff.
Honestly, a lot of us don't have a means of going. You know, whether we don't have a car or our family
can't help us because they are barely getting by. I mean there is drawbacks.
Focus group participants with experience in providing emergency food assistance were very
concerned that these programs are being abused—that recipients have other motivations besides
hunger for visiting the food pantries as often as they can. Recipients wasting the food that they
receive, feeding it to their pets, and/or trading it for drugs were the primary concerns cited. It
was also repeatedly stressed that, despite any abuse that might occur, it is important to continue
providing this assistance to make sure that the children of Johnson County are fed. While these
comments are most certainly rooted in personal experience, they also seem to draw on widely-
held stereotypes of welfare recipients as lazy, dishonest, and irresponsible.
I know there’s people that goes from here to Watauga County to the food bank. I know they do.
But if people don’t have a conscience, you can’t give them one.
But you know, that’s still fine, because if there’s children in the family. Even though you might have, even
if the father or the mother was on meth or whatever, you still got to feed that child.
We've got this one lady that handles it and she tries to watch because some people wants to come back
more often, you know every week or so if they can. So she kind of monitors that.
And they leave your church and then they come down here [to my church].
That goes back to they're selling their food stamps.
I've seen them come to our church and get their clothes and stuff and food and then you go up to Mike's
BBQ on Saturday and they're sitting there selling them.
So it's abused.
The food stamp program really needs to be readjusted. Because we've got a, up to 60% of the food
stamps in Johnson County are being sold to buy cigarettes, drugs and alcohol.
It's a real problem of the conscience. You know, you don't want anybody to go hungry when you have
more than you need. And it's available, but then you don't, also you don't want people abusing the
program.
Focus group participants with experience receiving emergency food assistance have a
slightly different perspective. They believe that most recipients are truly motivated by hunger
and that any abuse that does occur is an isolated incident rather than indicative of a widespread
trend.
49](https://image.slidesharecdn.com/johnsoncountycommunityfoodfinal-121030103122-phpapp02/85/Community-Food-Security-in-Johnson-County-Tennessee-A-Local-Food-Strategy-56-320.jpg)
![Do you think that some people abuse the food pantry programs or take food when they don't really
need it?
Yes, I've known a couple of people that just go to the food pantry just to get food for their dogs.
For real? Wow.
I mean I used to live with somebody that would go to the food pantry and we would be pretty much
hungry and they would feed it to their dogs to keep their dogs from starving. So I just started buying my
own food and, you know, going to the food pantry and putting it in my room and keeping it so that they
couldn't feed it to their dogs.
Is there a way to prevent people from doing that?
No, cause you can always say, oh I'm not doing that with it, unless you really have proof then
… [B]ecause most people that go to those food banks are really [hungry].
Surely it'd have to be just a few. Because when I go and I talk to people that are waiting and stuff, you
know I've never seen anybody that wasn't really, really there for the food.
I haven't either. I mean, but only a couple of people that I've talked to or know, that goes in there and
gets it, just, you know, for extra or, like I said, to feed their dogs or. And my granny, she does go, but she
also, what she does not eat of it she gives, she hands it down to other people in my family. That really
helps them, people that can't get out.
I think that it helps not just us but, our, just our family, our friends. Because the stuff that I won't eat or
my kids won't eat
I'll pass it on
When I have a lot of something, then I pass it on. So it's real handy here.
In addition, very little evidence emerged during the focus groups to suggest that Johnson
County families waste food. Participants in the lower income groups, in particular, seem to be
particularly offended by waste. Despite their concerns about the quality of the items available at
food pantries, they would rather see food of questionable quality be used than have it go to
waste.
That's like up here at Food Country they throw everything. There was a case of eggs, there would be like
maybe two or three cracked… they put the whole box in there.
They just throw it outside, take it out in the dumpster.
Why don't they give that to somebody? That makes me mad. Why don't they give that to somebody?
I know. Or at least sell them real cheap.
But there would be like maybe two eggs that was broken and instead of separating those and taking it
back and cleaning them off and getting them back up, and putting, selling them. They just threw the
whole box. I mean the whole box that they came in. They just threw them away!
That stuff should be donated to the pantries.
It is impossible to use the focus group data to specifically determine the manner and extent
to which food pantries (or other assistance programs) are being abused. More meaningfully,
however, the data does indicate a very basic lack of understanding among people of different
socioeconomic backgrounds. To move forward, it may be more important to bridge class divides
in Johnson County than it is to root out and rectify any abuse that may be occurring.
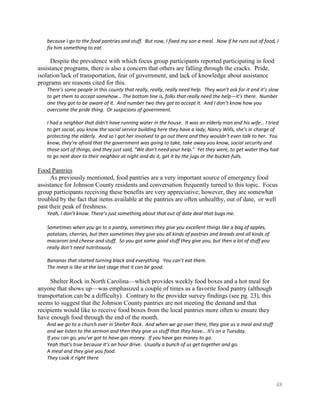
Shopping
Focus group participants identified the following retail establishments as places where they
shop for groceries: Save-A-Lot, Food Country, Food Lion, and Dollar General in Mountain
City; Save-A-Lot, Go Grocery Outlet, and Wal-Mart in Elizabethton; Wal-Mart in Bristol; Food
City in Damascus; and health food stores in Boone. Many also stated that they ―shop the sales‖
50](https://image.slidesharecdn.com/johnsoncountycommunityfoodfinal-121030103122-phpapp02/85/Community-Food-Security-in-Johnson-County-Tennessee-A-Local-Food-Strategy-57-320.jpg)
![I put out gardens a lot with my son, me and my mom, and we share with everybody in the community.
We used to bury our potatoes and cabbage and stuff, and dig a hole, and bury your stuff. Bury your food
- to store it. We used to call it… a dirt cellar.
Hunting, roadside stands, pick-your-own, farmers markets, gleaning, collecting wild edibles,
and ―dumpster diving‖ are additional sources of food that were mentioned. Deer, rabbit, snake,
frog legs, and squirrel were mentioned as wild game that is used for food.
I like deer meat anytime…I usually kill 12, 15 a year.
We killed a beef. We probably killed seven deer. We kill our own pork.
We eat a lot of deer meat, rabbit, squirrel, bear…My whole family hunts…my two boys, my dad.
A great deal of the stuff in my freezer is venison. And fish that I caught.
I always get mine at the produce stand where they sell produce by the side of the road. They have quite a
bit of stuff there.
When we first moved here he hit the dumpster in Elizabethton at night and you wouldn’t believe the stuff.
Focus group participants identified several reasons why they prefer these ―alternative‖
sources of food to the grocery store: it saves money, it tastes better, it is better quality, it is safer,
it is healthier, the source is perceived to be more trustworthy, it buffers against food insecurity,
and it builds and strengthens relationships in the community.
I never bought a tomato in a grocery store yet that was worth the energy it took to slice that thing.
[T]hey’re grown in Florida and other places and they’ve got to pick it when it’s green.
You make friends. You give it away and people become your friends. You invite them to your church and
they come to your church and then they meet other people and pretty soon it’s just a big old swap thing.
Our church likes to cook. We cook a whole lot at our church.
I try to grow it organically…Especially I worry about the stuff in the store that comes from out of the
country. And you worry about what standards they have. I know what I did with mine. I know what’s
been put on it and what hasn’t.
But you know if you grow your own you know you don’t have [dangerous bacteria] in it. You’re not going
to have something, if you’re going to eat it, that it’s going to kill you or hurt you. When you grow your
own, and canning food or fixing food at home, it brings your whole family together. If you’ve got a bigger
family that, everybody goes in on, depends on it, it just makes a better family atmosphere.
I would say the beef, they’re getting really bad because of all the shots they put into it. It’s getting worse.
It’s better to go to wild game because you know you ain’t going to get all that.
It’s also nice to have the fresh food. When you get it from the garden or farmers market its fresher and
you’re also supporting local business.
It saves you money where you can buy something else that you actually need.
So if you got a garden, then you know you’ve got some food, at least some vegetables or something in it.
And if you got hunting, you know you got a piece of meat.
52](https://image.slidesharecdn.com/johnsoncountycommunityfoodfinal-121030103122-phpapp02/85/Community-Food-Security-in-Johnson-County-Tennessee-A-Local-Food-Strategy-59-320.jpg)
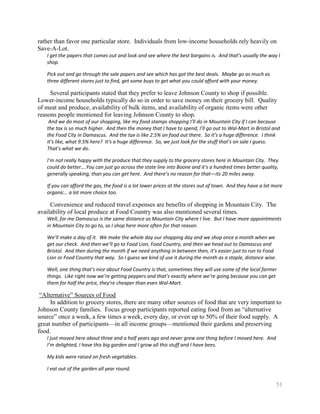
![Despite the benefits of ―alternative‖ sources, nearly all of the focus group participants get
most of their food from the grocery store. A lack of space and lack of skill/knowledge are the
main reasons why people do not garden. Focus group participants also mentioned physical
disability, not being able to afford supplies (plants, fertilizer, seeds, etc.), fear of failure, lack of
interest, lack of time, unwillingness to do the physical labor, and vandalism. Lack of
skill/knowledge, not being able to afford a license, and not liking the taste of wild game are
reasons why people choose not to hunt or fish. Reasons why people don’t rely more on fresh,
local or organic produce include: a lack of information about what is available and where to find
it, it is only available at certain times of the year, they cannot afford it, it is difficult to travel to
places where it is sold (especially if they have to go out of county), and not enough
fresh/local/organic items are available in the community.
I used to until I got my back injured so I can’t hunt no more. But they still let me fish.
I think a lot of people, they’ve got used to..[thinking] they can’t do it. If you knew somebody could step in
and help, they would have food too.
Most people don’t advertise. You’ve just got to see them. Or hope that you see them along the road or
somewhere like that when you’re out and about. Most people can’t afford gas to just be out and about
anymore. I think they should be able to advertise them, you know like in the newspaper or over the radio
or maybe put a bulletin up.
I don’t know if I would want a garden or not, it’s a lot of work.
There’s very few women that are educated on [hunting wild game]. And a lot of times we don’t have the
guns, we don’t have license to do these things.
And it costs money for the license and stuff.
Even when you fish it’s expensive. That license is expensive and then you don’t know whether you’re
going to catch anything or not.
[And] you don’t know if you can eat the fish you catch.
What are some of the barriers that exist to being able to buy more locally produced goods?
The price. I mean it’s cheaper at these other places.
I think that’s the big thing. Price.
I’ve always had a garden all my life. My problem right now is mostly the area to do it in.
No, I’ve wanted to grow a garden but I have never had a green thumb and I’ve never really known how to
do it…That’s something I’ve wanted to learn how to do, is garden, and to can. But I’m not sure how a
person learns that.
Mine is a time issue. I work two jobs, have a small child, and do lots of other stuff. And it’s just easier to
run in the grocery store and grab it and go. Instead of going, you know, to three different places.
When you get a little pack of cucumber seeds, you don’t get but just a little bit, they’re high.
Nutrition
Many focus group participants reported that they are not satisfied with the nutritional
quality of their diet. Lower income individuals were more likely to report this dissatisfaction.
The cost of more nutritious food, particularly fresh vegetables, was cited as the primary obstacle
to a healthier diet. The fact that convenience food is often unhealthy also makes it more difficult
to obtain a nutritious diet. Other factors include: lack of self-discipline, pervasiveness of junk
53](https://image.slidesharecdn.com/johnsoncountycommunityfoodfinal-121030103122-phpapp02/85/Community-Food-Security-in-Johnson-County-Tennessee-A-Local-Food-Strategy-60-320.jpg)
![It’s like the old fashioned way, years ago people took their wheat to the mill and got it ground, the corn
and everything.
In particular, they lament the loss of small farms and Johnson County’s agricultural heritage.
Used to you could buy milk off the farmers, but now they, you can’t hardly do that now… There ain’t
nobody selling it out to just the public.
We used to have a lot more produce in this county. A lot more little stands, from people’s private little
farms and stuff. A lot of the old timers have gone and we’ve lost a lot of that. This used to be a lot of
vegetables and everything here. It was the green bean capital you know.
There used to be a blueberry farm in Butler too. Just down almost into Butler, there used to be a couple
of strawberry farms here too, but there’s nobody around anymore. Nobody’s growing them anymore.
A couple of participants were not so optimistic about the future. It was suggested that
perhaps this is the future we have to look forward to if Johnson County residents do not step up
and work together to create a different future for their community.
I think that things going to look real scary. A lot of bad issues. People may not know how to take care of
their basic needs. And poverty. More sickness. Because they’re not getting the right nutrition…. And
government may not can step in and help. Without the farmers and with prices getting higher, if you
don’t have money you can’t afford to provide for your family. You won’t be able to live. [It looks like a
famine is coming.]
I don’t think the future is looking too good. In time it’s getting harder.
Maybe that’s more like how things will turn out if we don’t do anything to change it.
I think that’s the whole purpose of this meeting, isn’t it? Is to try to help change what you said.
Some things is going to have to be different.
Existing Assets
Focus group participants listed many assets that already exist in Johnson County that could
be used to build a more sustainable food system, improve the quality of life in the community,
and move towards the ideal world.
Churches
Food Pantries
o St. Anthony’s: provides food and Crossroads Medical Mission
o Hale’s Community Ministries
o First Baptist
o Presbyterian Church: 5 Cents a Meal program provides $25-50 vouchers that can
be used in the local grocery stores
o Community Church
o Shelter Rock (NC): provides hot meals and food boxes
Meals on Wheels
School lunch
Summer food service program
Backpack program: sending produce home with school kids
Neighborhood Service Center
Higher Ground: provides lunch for participants every day
56](https://image.slidesharecdn.com/johnsoncountycommunityfoodfinal-121030103122-phpapp02/85/Community-Food-Security-in-Johnson-County-Tennessee-A-Local-Food-Strategy-63-320.jpg)
![Commodities distribution at the National Guard Armory
Small farmers
o Snyder’s
o Shull’s Farm
o Billy Ward
Produce stands
o People that sell at Mike’s BBQ
o Lambert’s in Valley Forge
Place in North Carolina that sells fresh milk, butter
Local people that sell eggs
Places to get a deer processed: Kenny Cole’s, another place in Virginia
Good quality farm land: especially if farmers have extra space they would share with a
community garden
Gardening: especially if resources (seed, equipment) and knowledge are shared
Hunters
Greenhouses and aquaculture center at the high school
Farmers market
o Elizabethton
o Yadkinville
o Johnson County
Garden at community center
Duffies Amish store
Cheese factory in West Jefferson
Trade Mill
Local winery
The golf course
Well I think it sounds like the churches are really stepping up to the plate here. I am really impressed with
how many, I didn’t realize that that many churches had food pantries. And it seems like they are…
certainly they’re fulfilling a huge need.
I know with our grandkids, [the school system] sends back food home, is it once a month, or every Friday
or something. And a lot of times [their mother], you know, she’ll give it to me for over at my house
because they won’t eat at their house. But it’s good food, like cans of ravioli, juices, milk.
That’s something to go look at if you’ve never seen the aqua center [at the high school].
There’s a lot of good farmers not doing the work and a lot of good land that’s not being used.
We have a lot of talented people, it’s just they’re starting to get together in different ways… Trying to get,
promoting what we’re doing right here. There’s a lot of talented people.
And we’ve got so much information, I mean all these old people. I mean, we’ve got so many people in this
community from the mountains and they know so much about farming and canning and the way it used
to be.
57](https://image.slidesharecdn.com/johnsoncountycommunityfoodfinal-121030103122-phpapp02/85/Community-Food-Security-in-Johnson-County-Tennessee-A-Local-Food-Strategy-64-320.jpg)
![Community gardens, something that they're starting to do now. It gives apartment dwellers a place
where they can garden and it’s social for some people to get out and just see other people. It's a little bit
of exercise in the summer. I don't know if there'd be a need for that here in town.
I think it would be nice because a lot, I know some people that don't have an area to garden in. And they
used to call them victory gardens, when times were hard, when people got together and gardened and it
was… social.
If each one of us could find one person that needed help. You know and it could be helping them in the
garden, showing them how to do something, we can learn from each other.
This is what we teach in my church and I think that’s where it can start… Churches are an important part
of this and I think we can utilize that because… God wants us to use our bodies as a temple for Him first of
all, you know, is why we need to be healthy and I think that’s where it could start.
I used to buy fresh milk and eggs but now that lady is gone and I have a hard time.
That would be something I would love to do.
We need to show [young people] the values, you know, in life of what you have to do to survive.
Yeah, that's right.
As much as they're so much more ingenious than I am, they can think of so many more brilliant ways to
get things done than people like me that're set in our ways, just trying to survive. They have a lot better
ideas than my age people.
I think one thing I’d like to see too, you know, these children growing up, is put a garden in class for them
too. High schoolers have it and I think the children could benefit from it too.
A lot of people don’t know how to raise a garden, don’t know how to do that stuff. They just need to be
showed how to do it.
You don't have to grow food, you can grow flowers too in the garden. So people could sit around and
talk. One thing they have is people don't talk to each other anymore. They don't even know, lot of people
don't even know, can't name five people that live on their street. You know, it's like, they just don't know
who lives next door because we've all become protective. We're afraid of our neighbors.
Johnson County would need to be zoned. Nobody hit me. They'd have to have a farm area, industrial
parks, a residential area and a commercial area. Because now it's sort of mixed up and you could never
have a walk-around downtown community or something like that. Because you know, you'd be
someone's farm land or a used car lot or something like that. So if you zoned it all out, then you'd have
areas where things went. So, it sounds like I'm a communist or something but I'm not.
Other ideas that were mentioned less frequently:
Gleaning
Greenhouses (These would extend the growing season but it was acknowledged they
would be difficult to maintain)
A way to access surplus food and/or use food waste. (Immediate solutions are also
needed to address pressing hunger problems.)
Coupons to make it easier for poor people to buy food (e.g. expanded assistance
programs)
Soup kitchen
60](https://image.slidesharecdn.com/johnsoncountycommunityfoodfinal-121030103122-phpapp02/85/Community-Food-Security-in-Johnson-County-Tennessee-A-Local-Food-Strategy-67-320.jpg)
![Homeless shelter
Store with sliding scale prices for poor people
Summer feeding program expanded to adults
Bike trail
Zoning (to allow for farmland preservation and a more centralized, walkable community)
State-run public farm
Flea market
Wal-Mart
Advertising Johnson County as an agricultural area to draw tourism/development
Drive-thru deli that offers healthy options for eating on the go
Corporations that produce junk food should have to pay for health care
School programs with better quality food. Get kids used to eating vegetables and/or
make them do it.
Participants recognize that change is difficult and that, at times in the past when people
tried to start new things, they were not successful. But they also see cause for optimism.
Everyone can do a little something to contribute. Word of mouth is the best way to get the word
out and start organizing people.
[The County Commission]… just wanted everything to stay the way it was. They missed out on so many
good grants, the city could have got, or the county could have got, that they could’ve improved the
county so much.
Whatever they do, they just need to work together. And have an open mind.
How do people find out about these things?
Word of mouth. From one person to the other.
Yeah, this town, you just tell one person, everybody knows pretty much.
But it’s going to take an effort. Anything, ANYTHING like that will take an effort. It’s not the easy way.
I think there are people that are willing. I think there are quite a few people that are willing to if they
knew what was going.
But I think that some of those large, long-time landowners, I think that they’re just trying to keep
Mountain City... the way it was. But they’re making it hard… I kept hearing some of the local people that
they wouldn’t go to the farmers market. And I said why? And they just said, “Well we like it the old way.”
There’s some resistance.
I think we can teach by example. I mean, by being, that's really about all the little people can do, like you
said, complain about it, but being a living testimony, you know, hey, this is do-able, it is affordable, we
could do this.
We could volunteer our time too. Even if it’s just a couple hours one day a week. And be willing to teach
a, well, all I can do is cook, so a cooking class. Or gardening, people who understand gardening.
What about going to city council meetings? Is that a way that people can get things accomplished here?
No
I'd be terrified to go there. I mean you're very right. We need, we need to do it.
If there's a bunch of us get together and we just keep hounding them, they'd have to hear us.
61](https://image.slidesharecdn.com/johnsoncountycommunityfoodfinal-121030103122-phpapp02/85/Community-Food-Security-in-Johnson-County-Tennessee-A-Local-Food-Strategy-68-320.jpg)
![his payments that year if he doesn't have any income coming in. Say he had a crop failure, we're gonna
let him start with his payments next year, or something.
I had several students that graduated from college at Wilkes with a degree in horticulture and nowhere to
go… Their schooling didn’t benefit them. So that’s the thing, if they’re gonna get the schooling they need
to know that there’s gonna be a job or something, that the government’s gonna help them get started in
the business.
They would also like to have more hands-on assistance from the Johnson County Agricultural
Extension Service.
It used to be a really a good deal. But they've got those boys’ hands so tied now, they can no longer do
much for you. They used, if I had a problem with beans, I’d call up here, here'd come [an extension agent],
they'd go through that, pull that up, send it to the University of Tennessee, within twenty-four hours I’d
have all this data back, what the problem was. None of that is there now.
They can’t come out and help you anymore.
We’re talking about hands-on. No hands-on.
They have to sit there and try to tell you what your problems are.
Getting on the computer.
In seeming contradiction to their enthusiasm for assistance programs, they are very wary of
government and regulations.
I don’t apply for any grant or any loan through the federal government because they’ll tie you up, son.
The state of Tennessee will tie you up. They will mess with you, you get so sick of it you can’t stand it. I
have no use for the borrowing money. I mean, I do without a lot of things.
Well, going through the certified organic deal, now that is one nightmare. I did a little of that. Never
again am I fooling with that.
When you get involved too, you’ve got more paperwork than you do actual work. It ain’t worth it.
And the government walking in, when they want to, as they want to.
If you’ve got beef around here and you decided to sell it, you wouldn’t believe the red tape you’ve got to
go through. Just to sell a piece of meat around here.
Changes in Agriculture
When asked about their most pressing concern for the future of food and agriculture in
Johnson County, the producers emphasized loss of farmland and the difficulty small farmers
have in making a living farming.
Well, not just in Johnson County, in this nation, we're gonna have to quit turning Class A and B farmland
into parking lots, housing developments, and everything else. We're gonna run out of ground, and once
you destroy Class A land, you don't get it back.
You know why… your Class A land’s going for parking lots, housing developments?... They can’t make it,
they can’t farm. You don't sell farmland, where you sell housing developments, used to be farmland but
nobody can make any money farming.
That’s where a little bit of government regulation would come in handy…
Well, that’s what I’m saying. We're gonna have to regulate selling farmland. It'll come down to where
you can afford to buy farmland then, and farm it. But it's gonna have to be farmed. You can't continue to
sell this stuff, you know, out for housing developments.
I think that at some point the government’s gonna have to step in and start subsidizing smaller farms.
65](https://image.slidesharecdn.com/johnsoncountycommunityfoodfinal-121030103122-phpapp02/85/Community-Food-Security-in-Johnson-County-Tennessee-A-Local-Food-Strategy-72-320.jpg)

![go to school to have something to eat,‖ ―low income children not having enough food after
school and during the summer,‖ and, ―now that school will end, children will go hungry‖.
The third largest concern, with 20 responses, was the lack of home gardens and farms in
the county. People said there is ―not enough growed,‖ ―it bothers me that not as many people
grow gardens as use to,‖ ―more needs to be home-grown,‖ there are ―not enough gardens in the
county.‖ One respondent said, ―people should plant more gardens and have nutritional food,‖
which leads to one of the next largest concerns about food- nutrition and freshness of food.
Many people mentioned the lack of nutritional value in food people eat and the
importance of nutrition education. Some responses include: ―Most of the food available are
processed, non nutritional. We need affordable healthy food choices that will increase our well
being and lower our illness level,‖ ―nutrition misuse causing obesity and other health problems,‖
and, ―children doing without enough and the right kinds of nutrition.‖ One respondent said we
―need more teaching for children (about) healthy choices. Not everyone gets this opportunity
from parents.‖
Freshness of available foods in the county goes hand in hand with the sense that people
should grow more gardens. Fifteen of the respondents expressed concern about the freshness of
food available in the county. There were concerns about the lack of jobs, local food, organic
food, and knowledge about the undesirable health impacts of eating fast and junk foods. A few
people were concerned about the success of the farmers market, that people are able and know
how to preserve food, the impacts of meth, too many fast food restaurants, and not enough
produce stands.
Overall, the price of food and people not having enough to eat are the main concerns for
Johnson County residents. The third largest concern, the lack of gardens, could be the answer to
the first two concerns. If people were able to grow gardens, the food would be both affordable
and available. These gardens could also generate income for people and educate them about
nutrition.
Question twenty five asked, ―Do you have any other comments? Any ideas about
helping relieve hunger while also providing connections between locally produced food and local
consumers.‖ Because complex, open-ended questions tend to have lower response rates, it is not
surprising that only 131 people answered this question. Twenty-eight of these answers said
growing gardens could relieve hunger, making it the most common response. Community and
home gardens were the most prevalent types of gardens mentioned. School gardens were also
mentioned a few times. Four of the twenty eight stated that it would be beneficial to have
community kitchens connected to these gardens. There were three other respondents that
mentioned kitchens, two of which referenced soup kitchens specifically and the third referred to
canning kitchens like there ―used to be.‖ In total there were seven responses that remarked on
having a kitchen for community purposes. Three respondents thought it would be helpful to
provide resources for gardening such as ―offer[ing] seeds or plants to food stamp or needy
families so they can grow their own‖ and providing ―free mulch, compost, etc. to help some of us
build up our clay/forest soil.‖ One respondent said they thought a community farm ―would
provide jobs, local produce, and if it was government assisted the prices could be lower.‖ The
price of food was a comment for eight of the respondents. Seven others noted the need for jobs
in Johnson County.
Seventeen respondents noted education as a key to relieving hunger making education
the second highest response to the question on how to relieve hunger. Nine of these seventeen
76](https://image.slidesharecdn.com/johnsoncountycommunityfoodfinal-121030103122-phpapp02/85/Community-Food-Security-in-Johnson-County-Tennessee-A-Local-Food-Strategy-83-320.jpg)

![Appendix D: Focus Group Questions Outline
Questions for Consumer Focus Groups
Opening Question
Tell us who you are, where you live, and your favorite food
Shopping Patterns
Where do you do most of your shopping?
Besides the grocery store, where else do you get food?
How important are these ―alternative‖ sources of food in your regular food supply?
Do you rely on them more at specific times of the month or at certain times of the year?
Are there any benefits to relying on these ―alternative‖ sources instead of the grocery store?
Are there any reasons why you don’t utilize ―alternative‖ sources of food?
Household Food Security
How many people would say that they either ran out or worried about running out of food during
the past year?
How many people would say that they either run out or worry about running out of food every
month?
What are some of the things that you might do to make your food or food money last longer?
How many people have ever participated in any kind of food assistance program (food stamps,
food pantry, etc)?
Think about the food assistance programs you participate in. How important are these programs
to your household?
You also may have a less formal support system, that is, friends and family who will lend you
money, give you food, cook for you, or let you buy on credit.
Can you describe some of these networks?
Do you ever provide this type of support for family members or friends?
What would you say is most important in helping you cope with times when food or food
concerns are a major problem?
Community Food Security
Now we’re going to switch gears a little bit. We’ve been talking about household food use. And
now we’re going to talk about how food and agriculture impact the entire community.
[Explain food system diagram]
What assets does Johnson County already have that could be used to increase its food security?
What are your biggest concerns about food and agriculture in Johnson County?
[hand out paper and pens] Close your eyes. Imagine you are transported in a time machine 20
years into the future and Johnson County is in an ideal world. Imagine what kind of community
you would want for your grandchildren. What role do food and agriculture play in this ideal
world?
Spend a few minutes quietly thinking and writing about your ideal world.
What kinds of food are people eating?
Where does this food come from?
Where and when do they eat?
89](https://image.slidesharecdn.com/johnsoncountycommunityfoodfinal-121030103122-phpapp02/85/Community-Food-Security-in-Johnson-County-Tennessee-A-Local-Food-Strategy-96-320.jpg)
![How does it impact people’s health?
How does agriculture impact the economy? How does it impact the environment?
What is it like in your ideal world?
What do you think the community—local elected officials, businesses, and local residents
working together and building on the assets we’ve already discussed-- could do to help create
this ideal world?
What do you think is the most important thing the community could do to help create this ideal
world?
Are you willing to get involved in this effort? What could you do to help?
Ending Questions
The purpose of this group today was to get information on the amounts and types of food you are
using in your household and to gather your ideas for the future of food and agriculture in
Johnson County. Have we missed anything?
Questions for Producers Focus Group
Opening Question
Tell us who you are, where you live, and what you like most about being involved in local food
production.
Running Your Business
What are some of the places you sell your products?
Why do these places work the best for you?
Are there other places you would like to sell your products?
What are the barriers that prevent you from expanding to these other outlets?
What food processing resources would you like to see in the community?
How has food production in Johnson County changed in the recent past?
Would you view programs to promote home gardening and community gardens as competing
with your business?
Community Involvement
Do you think it’s important for most of the food consumed in Johnson County to have been
produced and/or processed within the County?
Why or why not?
Do you think most Johnson County residents feel the same way [support the local food system]?
Do they frequently patronize local food producers or markets?
Do you think Johnson County residents have adequate information on what local food
producers and markets are available?
What types of resources or programs would help expand food-related entrepreneurship in
Johnson County?
What other types of community support are needed?
90](https://image.slidesharecdn.com/johnsoncountycommunityfoodfinal-121030103122-phpapp02/85/Community-Food-Security-in-Johnson-County-Tennessee-A-Local-Food-Strategy-97-320.jpg)