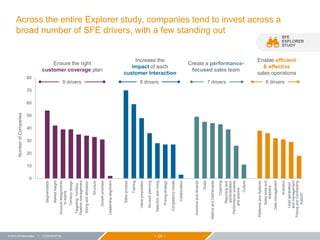
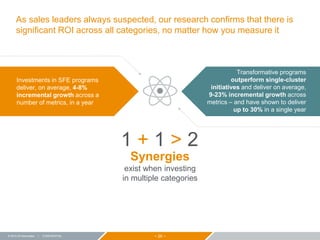
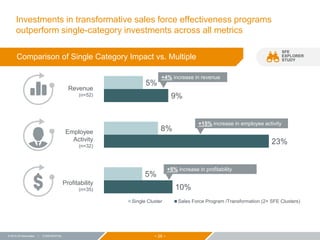
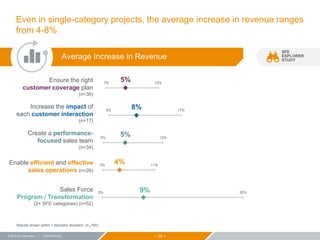
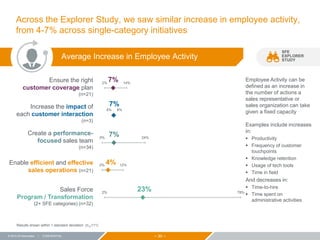
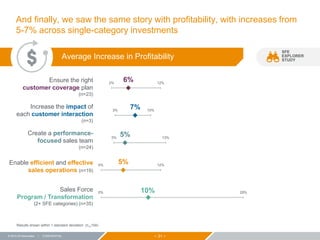
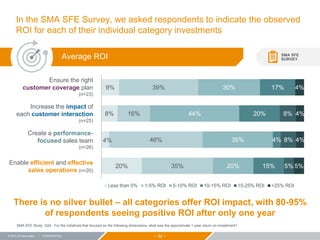
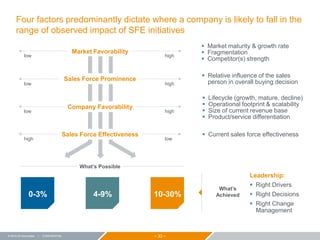
The document summarizes a webcast presented by ZS Associates on their Explorer Study regarding the impact of sales force effectiveness initiatives. It discusses the methodology of the study, which included data from over 80 sources. A key finding is that broad SFE programs can deliver 9-23% incremental growth in revenue-related metrics in one year, while single initiatives typically result in 4-8% growth. Implementing initiatives successfully requires focusing on the right customer coverage, sales interactions, sales team performance, and sales operations.


![− 18 −© 2015 ZS Associates | CONFIDENTIAL
3%
2%
5%
0%
1%
5%
Under-Achieved Objectives (1-3)
Achieved Objectives (4)
Exceeded Objectives (5-7)
Historical SFE Spend (Delta vs. Average) Future SFE Investment (Delta vs. Average)
Over 90% of SMA respondents considered SFE an important priority in
the future, and on average all respondents will continue to increase their
spend regardless of past objective achievement
Average SFE budget allocation by achievement of profit objectives
Q6. Which choice best describes your organization’s achievement of profit objectives over the past 24 months?
Q15. Over the past 2 years, what proportion of your organization’s budget was allocated towards initiatives designed to support or improve the effectiveness of the sales force?
Q26. Over the next 2 years, what proportion of [Q2 response]’s budget do you expect will be allocated towards initiatives dedicated to improving the effectiveness of the sales force?
Companies who have exceeded their profit objectives
will continue to invest in SFE
SMA SFE
SURVEY
Even those who have under-
achieved in the past, plan to
increase their investment
by an average of ~3%
Companies that exceed
their sales objectives tend
to invest 2-5% higher](https://image.slidesharecdn.com/ed571d9f-b0c9-4f29-813e-57fa9fc7ebdd-150618125800-lva1-app6891/85/SMA_Webinar_June10_2015_SFEImpact-18-320.jpg)
![− 20 −© 2015 ZS Associates | CONFIDENTIAL
SMA SFE
SURVEY
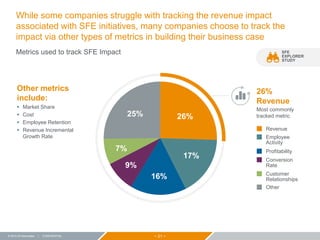
In spite of the priority and high cost of investing in SFE initiatives, many
struggle to find and measure quantified reference points before and
after investment
Q22. What best describes the overall impact (absolute change) you observed/expect to observe in each metric one year following the rollout of your SFE improvements related to [cluster]?
Q24.For the initiatives that focused on the following dimensions, what was the approximate 1-year return on investment?
Q25. Overall, how confident are you in the accuracy of the outcomes you just reported?
Q27. Over the next 2 years, how important do you expect sales force effectiveness to be for your organization?
1 in 4
SMA survey participants
did not have a measurement
plan or metrics to track their
SFE initiatives
>50% of survey respondents
don’t or can’t calculate ROI
Over half of survey
respondents reported
little (if any) confidence in
their measurement abilities
Where resources and infrastructure limit measurement, robust benchmarks
often provide the guidance senior executives search for](https://image.slidesharecdn.com/ed571d9f-b0c9-4f29-813e-57fa9fc7ebdd-150618125800-lva1-app6891/85/SMA_Webinar_June10_2015_SFEImpact-20-320.jpg)