Water / Wastewater - groundwater levels, dry land salinity and drought in Ade...
2014_WQR
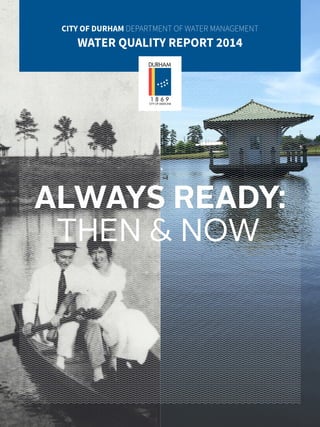
1. ALWAYS READY:
THEN & NOW
CITY OF DURHAM DEPARTMENT OF WATER MANAGEMENT
WATER QUALITY REPORT 2014
2. Inside This Report
▶ Durham Water: Sources and Treatment p. 4
▶ Water Quality Summary p. 6
▶ Major Milestones in the History of Durham’s Water p. 8
▶ Water System Improvement Projects p. 9
▶ Source Water Assessment Program Results p. 10
▶ Water Conservation and Efficiency p. 11
Cover: Reservoir at Williams Water Treatment Plant.
Williams, the first city-owned treatment plant, was
completed in 1917. Inset photo: Beatrice and Graham
Maynard boat on Durham Reservoir (1916). Credit: North
Carolina Collection, Durham County Library. Ezra King.
On this page: Plans to use Teer Quarry, pictured, for
offline water storage are in the design phase. Water
stored in the quarry will add about 5.2 million gallons a
day (MGD) to Durham’s current 37 MGD water supply.
3. Questions?
Questions regarding the information in this report should be directed to Water Management staff at the Brown Water
Treatment Plant, 919-560-4362. For information on water conservation or to arrange a tour of facilities, call 919-560-4381.
Call 919-560-4411 for all billing questions. For information about City operations and services, contact Durham One Call
at 919-560-1200.
WELCOME
Since 1915, the City of Durham has been committed to
making sure that your drinking water is always ready
for you.
We are proud to provide our customers with a reliable supply of clean, safe
drinking water. As part of our commitment to this service, we are pleased to
present you with this year’s Annual Drinking Water Quality Report. This report
is a summary of the health of Durham’s drinking water for all of 2014. In it,
you will find information about what is in your water and the steps we take to
send clean drinking water to your tap every day.
The theme of this year’s report is “Always Ready: Then and Now.” Step back in
time with us to see how far our city’s water infrastructure has come and what
the next steps are in our journey to improve the water treatment process and
protect our water resources. We know that informed customers are our best
allies, and we thank you for taking time to read this important information.
For more information, you can visit www.DurhamSavesWater.org, or follow us
at www.facebook.comDurhamSavesWater or www.twitter.com/DurhamWater.
Water Management staff are always happy to host plant tours for residents
of all ages. Staff members are also available for presentations to civic and
school groups. We welcome your feedback and look forward to continuing
our service to you.
Best regards,
Don Greeley
Director, Department of Water Management
Did you know you can fill approximately
1,500 glasses of water for the cost of
one bottle of water? In addition to
being less expensive per gallon than
bottled water, your award-winning
tap water here in Durham is closely
monitored to make sure it is clean
and healthy for you to drink!
Photo: Durham City Water Works
Hillandale Plant, 1926.
Credit: North Carolina Collection,
Durham County Library
2014CITYOFDURHAMWATERQUALITYREPORT
3
4. Lake Michie, completed in 1926, was the
City’s main drinking water source until the
construction of the Little River Reservoir
in 1988.
Credit: North Carolina Collection, Durham County Library.
DURHAM WATER
SOURCES TREATMENT
Tap Water Compliance
History
We are once again happy to report that
the City of Durham’s tap water had zero
violations of any water quality standards
during 2014. The substances that were
detected were all below the levels allowed
by the Environmental Protection Agency
(EPA). The City is required to test for more
than 150 different compounds in the
drinking water. Those listed in the tables
in this report represent a snapshot of the
overall health of your water.
Sources of Drinking Water
The sources of drinking water both tap
and bottled include rivers, lakes, streams,
ponds, reservoirs, springs and wells. As
water travels over land or through the
ground, minerals and other materials
dissolve naturally into it. As it moves
through our environment, water can also
pick up substances that are the result of
animal or human activity. Source water may
contain the following:
▶ Microbial contaminants, such as viruses
and bacteria;
▶ Inorganic contaminants, such as salts
and metals;
▶ Pesticides and herbicides from
agriculture or urban run-off;
▶ Organic chemicals from industrial
processes or run-off; and
▶ Radioactive contaminants that can be
naturally occurring.
The EPA regulates the amount of certain
substances in your tap water. This is to
ensure that tap water is safe to drink. The
Food and Drug Administration establishes
limits for contaminants in bottled water to
protect public health.
Durham’s Drinking Water
Sources
Durham is fortunate to have two high
quality surface water sources. Lake Michie
was built in 1926 and was the City’s main
water source until the Little River Reservoir
was built in 1988. Using recent models of
the reservoirs, the City has adjusted the
safe amount of water that can be taken out
of the two lakes. These models take into
account the extreme drought conditions of
2007-08. With a 20 percent safety factor, the
safe yield being used for future planning
purposes is 27.9 million gallons of water per
day (MGD).
In 2002, the City of Durham gained an
allocation of approximately 10 MGD from
Jordan Lake, another local high quality
5. water source. Currently, Durham accesses
this water on an as-needed basis via the
Town of Cary’s water system. With regional
partners, Durham is exploring opportunities
to build an additional intake at Jordan Lake.
The City also obtained the Teer Quarry for
use as off-line water storage. Water stored
in the quarry was accessed for emergency
purposes during the drought of 2007-08.
Permanent facilities to allow for filling the
quarry from a number of sources during
normal conditions are currently in the
design phase.
Water may be transferred from the two
supply lakes to the City’s two treatment
plants by gravity flow, hydropower or
electric power. Terminal reservoirs at each
water treatment plant hold about a two- to
three-day supply of water.
How is Durham’s water
treated?
In 2014, Durham’s two drinking water
facilities provided 26.96 MGD of water to
approximately 265,472 people in Durham
City and County. The oldest treatment
facility still in use is the Williams Water
Treatment Plant on Hillandale Road. It was
built in 1917 and has been expanded and
upgraded a number of times to its current
capacity of 22 MGD. The Brown Water
Treatment Plant on Infinity Road was built
in 1977 and has a current capacity of 30
MGD.
Both plants operate using conventional
water treatment processes. The initial
treatment step is coagulation, which
involves the rapid mixing of caustic and
ferric sulfate into the raw (untreated
source) water. Next, the water flows into
chambers where gentle mixing allows dirt
and other impurities to stick together or
flocculate. The heavy floc particles that
have formed then settle and are removed
in sedimentation basins. Chlorine is added
to the settled water as a disinfectant.
The water then flows through sand and
anthracite filters to remove any remaining
particles. Phosphate (which keeps pipes
from corroding) and fluoride (for dental
health) are then added. In the final step,
chlorine and ammonia are combined to
form chloramines, a chemical that stays
in the water to maintain disinfection until
it gets to your tap. The City of Durham
has added fluoride to its drinking water
since 1957 to promote dental health. Until
recently, state regulations required a
target concentration of 1.0 mg/l for
fluoride. However in 2011, the EPA — along
with the U.S. Department of Health and
Human Services — determined that dental
health could still be maintained with
lower levels of fluoride. Based on this, N.C.
regulators have allowed water systems
to decrease their fluoride target levels to
0.7 mg/l. The City changed dosage levels
for fluoride immediately upon receiving
approval. Testimony from public health
experts supports the continued addition
of fluoride to drinking water as an ongoing
safeguard for dental health.
The sedimentation basin at the Brown Water Treatment Plant. Particles of dirt and other
impurities are removed from the water in this step of the treatment process.
2014CITYOFDURHAMWATERQUALITYREPORT
5
6. MAX. LEVEL DETECTED
RANGE
MAX. LEVEL
ALLOWED
(MCL)
IDEAL GOAL
(MCLG)
POTENTIAL SOURCE(S) OF
SUBSTANCE
The City of Durham (PWSID # 03-32-010) routinely monitors for over 150 contaminants in your drinking water according to Federal and State
laws. The table below lists all the drinking water contaminants that were detected during testing conducted from January 1 through
December 31, 2014. The EPA or the State requires water providers to monitor for certain contaminants less than once per year because the
concentrations of these contaminants are not expected to vary significantly from year to year. Some of the data, while representative of water
quality, is more than one year old.
WATER QUALITY SUMMARY
0.05
(90th percentile)
0.73
(0.70 - 0.75)
0.23
( 0.10 – 0.40)
0.07
(0.06 - 0.09)
100%
Average Removal 69%
Source
7.09 (5.46 –8.77)
Treated
2.21 (1.66 – 2.54)
None detected
no range
None detected
no range
0.003
(90th percentile)
2.0 RAA
Running Annual
Average
2.0
0.2%
positive
AL = 1.3
4.0
10.0
TT
95%
NR
15
50
AL = 0.015
MRDL
4.0
MRDL
4.0
5% of monthly
samples are
positive
4.0
10.0
N/A
N/A
TT 50%
removal
0
0
1.3
0
MRDLG
4.0
MRDLG
4.0
0%
positive
Naturally occurring mineral; added
to promote dental health
Runoff from fertilizer use; leaching
from septic tanks, sewage; erosion of
natural deposits
Soil runoff
Soil runoff
Naturally present in the
environment
Erosion of natural deposits
Decay of natural and man-
made deposits
Corrosion of household
plumbing systems
Corrosion of household
plumbing systems
Desinfectant to control
microbes
Disinfectant to control
microbes.
Naturally present in the
environment
No
No
No
No
No
No
No
No
No
No
No
No
Fluoride mg/L
Nitrate mg/L (as Nitrogen)
Turbidity NTU
Turbidity, % of monthly samples ≤ 0.3 NTU
Total Organic Carbon, mg/l (TOC) Results show
the range of TOC in both source and treated water.
Durham’s processes remove more than the required 50%.
Alpha emitters, pCi/L (Samples collected
analyzed February 2008)
Beta/photon emitters, pCi/L (Samples
collected analyzed February 2008)
Copper, mg/L (EPA required triennial sampling
conducted in July thru Sept, 2013)
Lead, mg/L (EPA required triennial sampling
conducted in July thru Sept, 2013)
Chloramines
mg/L (as Cl2
)
Chlorine
mg/l
Total Coliform Bacteria
(as a percent)
REGULATED AT THE CUSTOMER’S TAP
REGULATED IN THE DISTRIBUTION SYSTEM
SUBSTANCE AND UNIT OF MEASUREMENT
VIOLATION
YES/NO
REGULATED AT THE TREATMENT PLANTS
33.6
(24.2 – 42.1)
57
(48 – 69)
NR
NR
20 DWEL
250
Naturally occurring element in
soil and water
Naturally occurring mineral
in soil
No
No
Sodium mg/L
Sulfate mg/L
UNREGULATED SUBSTANCES
* Table continued on page 8
7. 2014CITYOFDURHAMWATERQUALITYREPORT
KEY TO ABBREVIATIONS IN TABLE
mg/L milligrams per liter, or parts per million
MCL Maximum Contaminant Level; the highest
level of a contaminant that is allowed in drinking
water
MCLG Maximum Contaminant Level Goal; the level
of a contaminant in drinking water below which
there is no known or expected risk to health
MRDL Maximum Residual Disinfectant Level; the
highest level of a disinfectant allowed in drinking
water
MRDLG Maximum Residual Disinfectant Level
Goal; the level of a drinking water disinfectant
below which there is no known or expected risk
to health
AL Action Level; the concentration of a
contaminant, which if exceeded, triggers
treatment or other requirements that a water
system must follow. Action Levels are reported at
the 90th percentile for homes at greatest risk
TT Treatment Technique; a required process
intended to reduce the level of a contaminant in
drinking water
µg/L micrograms per liter, or parts per billion
pCi/L Picocuries per liter; a measure of the
radioactivity in water
NTU Nephelometric Turbidity Units; measures
the clarity or cloudiness in water
N/A Not Applicable
ND Not Detected
NR Not Regulated
Less Than
DWEL North Carolina guidance Drinking Water
Equivalent Level
Locational Running Average (LRAA) The
average of sample analytical results for samples
taken at a particular monitoring location during
the previous four calendar quarters under the
Stage 2 Disinfection Byproducts Rule.
Special Note: MCLs are set at very stringent
levels. To understand the possible health effects
described for many regulated constituents, a
person would have to drink 2 liters of water
every day at the MCL level for a lifetime to
have a one-in-a-million chance of having the
described health effect.
Special Interest Information
Drinking water, including bottled water, may reasonably be
expected to contain at least small amounts of some contaminants.
The presence of contaminants does not necessarily indicate that
water poses a health risk. More information about contaminants
and potential health effects can be obtained by calling the
Environmental Protection Agency’s Safe Drinking Water Hotline
(800-426-4791).
Some people may be more vulnerable to contaminants in drinking
water than the general population. Immuno-compromised persons
such as persons with cancer undergoing chemotherapy, persons
who have undergone organ transplants, people with HIV/AIDS or
other immune system disorders, some elderly, and infants can be
particularly at risk from infections. These people should seek advice
about drinking water from their health care providers. EPA/CDC
guidelines on appropriate means to lessen the risk of infection by
Cryptosporidium and other microbial contaminants are available
from the Safe Drinking Water Hotline (800-426-4791).
What is Cryptosporidium?
Cryptosporidium (Crypto) is a microbial parasite that comes from
animal wastes. It occurs naturally in rivers and lakes throughout
the United States. Crypto can cause fever, diarrhea, and other
gastrointestinal symptoms when swallowed. Controlling and
minimizing development and animal activities in our watershed
reduces the occurrence of Crypto in source water. This microscopic
organism can typically be removed by the water treatment process
combination of filtration, sedimentation and disinfection. Durham
monitored source water for Crypto as a part of the Information
Collection Rule in the late 1990s. The City began monthly testing
in fall 2006 as a part of the Long Term Two Enhanced Surface
Water Treatment Rule (LT2SWTR). Crypto has never been found in
any monitoring events. The long term results of monitoring will
determine whether or not extra treatment will be needed.
Lead and Drinking Water
If present, elevated levels of lead can cause serious health
problems, especially for pregnant women and young children.
Lead in drinking water is primarily from materials and components
associated with service lines and home plumbing. The Department
of Water Management is responsible for providing high quality
drinking water, but cannot control the variety of materials used in
private plumbing components. When your water has been sitting
for several hours, you can minimize the potential for lead exposure
by flushing your tap for 30 seconds to 2 minutes before using water
for drinking or cooking. If you are concerned about lead in your
water, you may wish to have your water tested. Information on
lead in drinking water, testing methods, and steps you can take to
minimize exposure is available from the Safe Drinking Water Hotline
or at www.epa.gov/safewater/lead, or the City’s website at www.
durhamnc.gov/departments/wm/lead.cfm. The City is required to
test for lead and copper every three years. This testing was most
recently conducted in the summer of 2013. Results of this sampling
are included in this year’s annual water quality report.
Substance,
unit of measurement
pH, standard units (range)
Alkalinity, mg/L
Calcium, mg/L
Chloride, mg/L
Conductivity, micromhos/cm
Hardness – Calculated, mg/L
Hardness – EDTA , mg/L
Orthophosphate, mg/L (as PO4)
Potassium, mg/L
Total Solids, mg/L
Zinc, mg/L
Annual
Average
7.5 – 7.6
24
4.9
9.7
227
21
23
1.68
2.2
138
0.59
ELEMENTS OF INTEREST
7
8. MAX. LEVEL
DETECTED RANGE
MAX. LEVEL
DETECTED RANGE
TOTAL TRIHALOMETHANES (BY-PRODUCT OF
DRINKING WATER DISINFECTION)
MCL – 80 µG/L MCLG - 0 µG/L
37.0 - avg
(33 – 42)
28.0 - avg
(21 – 36)
32.5 - avg
(27 – 38)
32.2 - avg
(23 – 39)
29.8 - avg
(24 – 34)
34.0- avg
(32 – 36)
31.0 - avg
(28 – 33)
26.0 - avg
(20 – 30)
30.0 - avg
(23 – 38)
35.0 - avg
(26 – 41)
32.5 - avg
(29 – 36)
B02
B08
B03
B09
B04
B10
B05
B11
B06
B12
B07
NO VIOLATIONS THIS PERIOD.
FIVE HALOACETIC ACIDS (BY-PRODUCT OF
DRINKING WATER DISINFECTION)
MCL – 60 µG/L MCLG – 0 µG/L
32.5 - avg
(29 – 37)
27.0 - avg
(15 – 34)
31.2 - avg
(23 – 40)
B01
EP1
EP2
STAGE 2 DISINFECTION BYPRODUCT COMPLIANCE — BASED ON LOCATIONAL RUNNING ANNUAL AVERAGE (LRAA)
46.2 - avg
(30 – 62)
46.8 - avg
(33 – 62)
38.5 - avg
(28 – 50)
46.8 - avg
(33 – 60)
45.8 - avg
(32 – 62)
43.0 - avg
(29 – 56)
46.5 - avg
(30 – 61)
46.0 - avg
(32 – 62)
34.5 - avg
(23 – 43)
44.2 - avg
(20.0 – 42.0)
45.0 - avg
(31 – 60)
45.0 - avg
(29 – 58)
44.2 - avg
(29 – 60)
35.5 - avg
(27 – 44)
B01
B02
B08
B03
B09
B04
B10
B05
B11
B06
B12
B07
EP1
EP2
1885 — Durham Town Council passes a motion to
issue $50,000 in bonds to establish a water system.
After a review of finances, the town decided it was
too poor to issue bonds and therefore privately
financed the water system.
1886 —Thirty-year franchise contract signed with
A.H. Howland of Boston for the construction and
operation of a system to “abundantly supply said
City and its inhabitants with pure and wholesome
water fit for all domestic purposes.” The treatment
facility was built on the banks of the Eno River.
1887 — Huckleberry Hill storage reservoir
constructed to hold 3.5 MGD of raw water from the
Eno River.
Late 1887 —The Durham Water Company begins
operations.
1906 — Durham water received a rating of “Good
Water” from the State Laboratory of Hygiene.
1914 — Fire destroys 20 buildings in the downtown
area on the north side of Main Street. Weak water
pressure and high winds helped the fire spread
quickly. This prompted the City to buy out the
private company and build a new treatment plant
to address reliability.
1915 — City begins construction of its own water
treatment plant on Hillandale Road. The facility
was later named the Williams Water Treatment
Plant.
1924 — Construction begins on Lake Michie Dam.
This helps to create a reliable water supply from
the Flat River. This new source also addressed
concerns of pollution in the Eno River.
1926 — Construction is completed on the Lake
Michie Dam, providing a 19 MGD supply of water.
The facility also generated electric power.
1933-1934 — Durham experiences drought of
record for the 1900s.
1939 — East Durham elevated tank put into service
(1.5 MGD storage).
1943 — Durham provides raw water to Camp
Butner treatment plant.
1950 — Durham experiences severe drought.
1953 — Williams WTP expanded to 16 MGD.
1954 — Huckleberry reservoir converted to finished
water storage.
1959 — Eighteen-inch water line constructed to
provide drinking water to Research Triangle Park.
1961 — Upgrades at Williams WTP increase
capacity to 22 MGD (current rated capacity).
1977 — Brown Water Treatment Plant is
constructed to provide additional 12 MGD capacity
for the City.
1986 — Ellis Road elevated tank placed in service
(2.0 MGD storage).
1988 — Little River Reservoir is constructed to meet
the growing water supply demand for the City (18
MGD).
1991 — Brown WTP expanded to current capacity
of 30 MGD.
1995 — New pressure zone and elevated tank
constructed (Russell Road).
2001 - 2002 — Durham experiences severe drought.
2002 — Durham receives allocation of 10 percent
of the water supply storage pool of Jordan Lake
(equals approximately 10 MGD).
2007-2008 — Durham experiences historic drought
of record.
2014 — Downtown Loop Water Main Replacement
and Water Meter Upgrades Project begins. This
project is replacing the existing 1930s era water
mains in the Downtown Loop area to improve
water service delivery.
MAJOR MILESTONES IN THE HISTORY OF DURHAM’S WATER
9. WATER SYSTEM
IMPROVEMENT PROJECTS
Each year the Department of Water Management invests millions
of dollars in the City’s infrastructure as a part of the annual
Capital Improvement Program (CIP). Water system and facility
rehabilitation and upgrades make up between 40 and 50 percent
of the department’s overall funding requests. CIP and operational
costs are supported by water and sewer rates. Projects of this size
and scope generally take several years to complete as they move
from design through permitting and construction to completion.
Durham Downtown Loop Waterline
Replacement
The Durham Downtown Loop Waterline Replacement project will
replace more than 12,000 linear feet of deteriorating 1930s era
water mains in Durham’s downtown loop area to improve service
delivery. Also, 25 water meter boxes will be upgraded. The project
is estimated to cost between $6 million and $8 million and will be
paid for by capital improvement program (CIP) funds. Construction
began September 2014 and is scheduled for completion in spring
2016. The entire width of Morgan and Great Jones streets will be
resurfaced once the waterlines have been installed. During this
same timeframe, NCDOT plans to resurface Ramseur Street.
Durham Central Park Waterline
Replacement
The waterlines in Central Park were installed in the 1930s. Eighty-
five years later, they have reached the end of their useable life. The
waterlines will be replaced in order to continue to provide residents
and businesses consistent access to water in the Central Park area.
The project’s study/design phase will be completed in 2016, with
the construction phase starting late 2016. Construction is expected
to last approximately 18 months. The project area does not include
areas that were previously rehabilitated or replaced.
Dam Emergency Action Plans
In order to ensure protection of downstream property owners
as well as the City’s water supply, safety inspections must be
completed on the dams annually. Emergency Action Plans
(EAP) must also be updated annually. The Federal Emergency
Management Agency requires the action plans for preparedness in
the event of “an impending or actual sudden uncontrolled release
or excessive controlled release of water from an impounding
structure.” In 2014, the Water Management Department contracted
with Schnabel Engineering South, P.C. to provide these safety
inspections and EAP updates for 2015-2019.
Schnabel Engineering, in partnership with consulting firm Brown
and Caldwell, will also be conducting a condition assessment on
all structural, mechanical, and electrical parts of the dams and raw
water pumping stations at Lake Michie and Little River. They will
use this information to develop long-term plans for rehabilitation
and maintenance of these structures. This will ensure that these
facilities can continue to provide a reliable source of raw water
for the next 50 years. The 50-year plans will also allow Water
Management to prioritize rehabilitation projects at these facilities
to ensure the best use of available funds into the future. This plan is
expected to be complete by the end of 2015.
Southeast Pressure Zone Project
The Southeast Pressure Zone project is another long-term
improvement to the City’s water infrastructure. This involves
installing three new water pipelines and a 1.5 million gallon
elevated storage tank. This will improve system pressure and fire
protection in parts of the city along Page Road, north of U.S. 70 near
Page Road, and in the Imperial Center area. The 1.5 million gallon
water tank is the most cost effective and efficient way to manage
the need for elevated water storage.
Construction of the tank began September 2014 and is scheduled to
end in November 2015. Pipeline construction began in late 2014 and
is scheduled to end in fall 2015.A construction worker installs an insertion valve on an existing
waterline as part of the Downtown Loop project. Insertion valves
allow new valves to be installed without disrupting water service.
9
2014CITYOFDURHAMWATERQUALITYREPORT
10. SWAP Results Summary for Durham
Report updated July 23, 2014
For the full report, visit www.ncwater.org/pws/swap. To obtain a printed copy of the SWAP report, please mail a written request to: Source Water
Assessment Program – Report Request, 1634 Mail Service Center, Raleigh NC 27699-1634, or emailing a request to swap@ncdenr.gov. Please
indicate the system name (City of Durham), PWSID (03-32-010), and provide your name, mailing address and phone number. If you have any
questions about the SWAP report, please contact DENR’s Source Water Assessment staff by phone at 919-707-9098.
INHERENT VULNERABILITY
RATING
Lower ModerateHigherLake Michie
SOURCE NAME CONTAMINANT RATING
Lower ModerateHigherLittle River Reservoir
Watershed Protection Activities
Protecting our drinking water supplies is everyone’s
responsibility. The City and County developed comprehensive
watershed protection ordinances in the mid-1980s that have
helped to maintain the high quality of both Lake Michie and Little
River. These plans provide buffers around the lakes and limit the
density of development in the area. Additionally, the recreation
programs at the lakes are designed to ensure that providing
clean, safe drinking water is the primary use for the lakes. The
City also implemented a policy in 2010 to dedicate a penny per
tier (in the water rates) for watershed protection. These funds are
used to purchase land around the lakes – when parcels become
available – to extend the buffers. All of these activities help to
protect our most precious natural resource.
SOURCE WATER ASSESSMENT
PROGRAM (SWAP) RESULTS
The NC Department of Environment and Natural Resources
(DENR), Public Water Supply Section (PWSS) administers the
State’s Source Water Assessment Program (SWAP). They conduct
periodic assessments of all drinking water sources across North
Carolina. The purpose of the assessments is to determine the
susceptibility of each drinking water source (well or surface water
intake) to potential contaminant sources (PCS). PCSs include
activities such as animal operations, septage disposal sites, old
landfill sites and underground storage tanks that are located in
Durham, Person and Orange counties — the watersheds of Lake
Michie and Little River.
The final susceptibility rating for Durham’s water sources was
determined by combining the contaminant rating and the
inherent vulnerability rating. The Contaminant Rating is based
on the number and locations of PCSs within the testing area.
Inherent Vulnerability rating is based on the geologic features
or existing conditions of the surface water sources. It is also
based on other features of the watershed such as watershed
classification and development activities. A susceptibility
rating of “higher” does not mean that the water quality is poor.
It only rates the systems’ potential to become contaminated
by identified PCSs in the tested area. The test findings are
summarized in the table below.
SUSCEPTIBILITY RATING
11. WATER CONSERVATION
AND EFFICIENCY
Lessons from past droughts and plans for Durham’s future growth
drive our conservation and education programs. Our emphasis on
using water wisely is paying off. Durham’s residential water use is
consistently below the national average. This is due to customer
awareness, use of water efficient devices/fixtures in new
construction and incentives such as the toilet rebate program.
Toilet Rebate Program
Toilets are the main water users in the home. Standard toilets
use at least 1.6 gallons of water with each flush. You can receive a
$100 rebate by replacing a water-wasting toilet with a WaterSense
labeled High Efficiency Toilet. High efficiency toilets use an
average of 1.28 gallons per flush. The average family can save
almost 13,000 gallons of water every year by replacing toilets.
Save Water Kits
Replacing your toilets isn’t the only way to reap water-saving
benefits. For $3, you can pick up one of the City’s Save Water Kits,
available at Cashiering in City Hall. The kits contain a water-
efficient shower head, aerators for your kitchen and bathroom
sinks, and other goodies. Visit www.durhamsaveswater.org for
more information.
Educational Resources
The department has an ongoing public education and outreach
program that covers a wide variety of topics, including
conservation and water efficiency, water quality and careers in
the field. The program provides the community with important
and timely tips and information about drinking water. It also
reminds customers that water is a vital and valuable resource.
Our outreach/education staff shared the message of using water
wisely with approximately 3,255 children and adults in Durham
during 2014 through:
▶ Participating in activities and events at 20 different Durham area
schools and universities;
▶ Exhibiting at community events such as Durham’s Earth Day Festival,
CenterFest, School Science Days, Creek Week events and the Eco Fair;
▶ Sponsoring an annual water conservation themed poster contest;
▶ Conducting workshops during National Fix a Leak Week and water taste
test during National Drinking Water Week; and
▶ Scheduling tours of water treatment facilities.
Wayne Drop began an adventure through Durham in 2014. In the monthly
“Where’s Wayne Drop” feature, Water Management’s mascot highlights
the city’s interesting spots while serving as a big blue reminder to use
water wisely. Check out “Where’s Wayne Drop” at www.facebook.com/
DurhamSavesWater or www.twitter.com/DurhamWater.
11
2014CITYOFDURHAMWATERQUALITYREPORT
12. Do you have an interest in how decisions about Durham’s water
system or other City issues are made? The public is welcome to
attend regularly scheduled meetings of Durham’s City Council. Council
meetings are held the first and third Monday of each month at 7 p.m.
at City Hall in the Council Chambers on the first floor. City Council
members also have regular work sessions to prepare for Council
meetings. These sessions occur on Thursdays — two weeks prior to
each regular Council meeting. Work sessions are held at 1 p.m. in the
Council’s Committee Room on the second floor of City Hall. Check the
City’s Web site, www.durhamnc.gov, to confirm meetings. City Hall is
located in downtown Durham at 101 City Hall Plaza.
Notice Under the Americans with Disabilities Act
Persons who require assistance should call 919-560-4197, TTY
919-560-1200, or email ADA@DurhamNC.gov no later than 48 hours
before the event.
COMMUNITY
PARTICIPATION
Photo: Pictured is the main pump room of the Williams Water
Treatment Plant. The pumps shown here send drinking water
out into the City’s water distribution system. The youngest of
these pumps was installed in the 1960s.