Ueda2015 tupelo.nurses role in dm prevention dr.martyn molnar
NESS Poster final
1. Developed by Associates in Process Improvement
Using Quality Improvement (QI) Methods and Peer Learning to
Improve Viral Load Suppression among HIV-Infected Patients in
New York State
1 New York State Department of Health AIDS Institute, New York, NY
Viral load suppression (VLS) among HIV-infected
patients is critical to patient outcomes and is
fundamental to preventing the transmission of HIV.
Clinics face challenges helping patient achieve VLS
and can utilize QI to systematically provide better
support to patients.
Background
Hypothesis
The New York State Department of Health AIDS
Institute, through facilitation of peer learning, coaching
and technical assistance, can assist HIV care providers
at community health centers to build skills for analysis
of performance data to identify the root causes of VLS
interruptions, and to apply QI methods to improve VLS.
Research Design / Methods
Multidisciplinary care teams in the Community Health
Center Quality Learning Network (CHCQLN)
collaborated to improve VLS. Participants at each site
analyzed the characteristics of
all unsuppressed patients and
engaged in PDSA cycles to
test process changes tailored
to identified subgroups of
unsuppressed patients.
QI Interventions
Peer Learning
Data / Observations
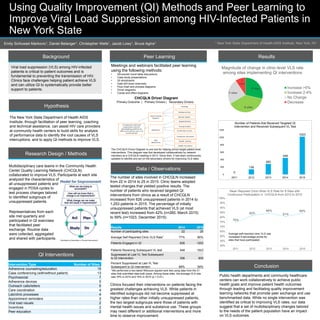
The number of sites involved in CHCQLN increased
from 22 in 2014 to 25 in 2015. Clinic teams adopted
tested changes that yielded positive results. The
number of patients who received targeted QI
interventions from clinics as a result of CHCQLN
increased from 626 unsuppressed patients in 2014 to
1,253 patients in 2015. The percentage of initially
unsuppressed patients that achieved VLS (at most
recent test) increased from 42% (n=260, March 2015)
to 59% (n=1023, December 2015).
Clinics focused their interventions on patients facing the
greatest challenges achieving VLS. While patients in
identified subgroups did not become suppressed at
higher rates than other initially unsuppressed patients,
the two largest subgroups were those of patients with
mental health issues and substance use. These groups
may need different or additional interventions and more
time to observe improvement.
Results
Conclusion
Public health departments and community healthcare
centers can work collaboratively to achieve public
health goals and improve patient health outcomes
through leading and facilitating quality improvement
learning networks that promote peer exchange and use
benchmarked data. While no single intervention was
identified as critical to improving VLS rates, our data
suggest that a set of multidisciplinary changes tailored
to the needs of the patient population have an impact
on VLS outcomes.
Emily Schlussel Markovic1, Daniel Belanger1, Christopher Wells1, Jacob Lowy1, Bruce Agins1
Meetings and webinars facilitated peer learning
using the following methods:
• Structured round table discussions
• Case study presentations
• QI storyboards
• Data drill down exercises
• Flow chart and process diagrams
• Driver diagrams
• Cause and effect diagrams
0
139
283
448
1023
0
200
400
600
800
1000
1200
2011 2012 2013 2014 2015
Number of Patients that Received Targeted QI
Intervention and Received Subsequent VL Test
75%
82%
84%
81%
84%
50%
55%
60%
65%
70%
75%
80%
85%
90%
95%
100%
2011 2012 2013 2014 2015
Mean Reported Clinic-Wide VLS Rate for 8 Sites with
Continuous Participation in CHCQLN from 2012 to 2015
Average self-reported clinic VLS rate
increased 9 percentage points for
sites that have participated
Intervention Type Number of Sites
Adherence counseling/education 15
Case conferencing (with/without patient) 13
Psychosocial 7
Adherence devices 5
Outreach calls/letters 5
Care coordination 4
Lab/clinic processes 4
Appointment reminders 3
Viral load visuals 2
Incentives 2
Peer education 2
*We performed a two-tailed Wilcoxon signed-rank test using data from the 21
sites that submitted data both years. Among these sites, the average VLS rate
was 76% in 2014 and 79% in 2015 (p < 0.01).
Results 2014 2015
Number of participating sites 22 25
Average Self Reported Clinic VLS Rate* 77% 80%
Patients Engaged in QI 626 1253
Patients Receiving Subsequent VL test 448 1023
Suppressed at Last VL Test Subsequent
to QI intervention 306 605
Percent Suppressed at Last VL Test
Subsequent to QI intervention 68% 59%
Representatives from each
site met quarterly and
participated in QI exercises
that facilitated peer
exchange. Routine data
were collected, aggregated
and shared with participants.
CHCQLN Driver Diagram
Primary Outcome | Primary Drivers | Secondary Drivers
The CHCQLN Driver Diagram is one tool for helping clinics target patient level
interventions. This diagram was first developed collaboratively by network
members at a CHCQLN meeting in 2013. Since then, it has been continuously
updated to identify and act on the secondary drivers for improving VLS rates.