Safety on Indian Roads a Big Challenge.ppt

In today's world road and transport has become an integral part of every human being. Every body is a road user in one shape or the other. The present transport system has minimized the distances but it has on the other hand increased the life risk. Every year road crashes result in loss of lakhs of lives and serious injuries to crores of people. In India itself about eighty thousand people are killed in road crashes every year which is 13% of the total fatality all over the world. In most of the cases crashes occurs either due to carelessness or due to lack of road safety awareness of the road user. Hence, road safety education is as essential as any other basic skills of survival. Roads are an important mode of transport in India. India has a network of over 6,215,797 kms of roads as of 1 December 2021, the 2nd largest road network in the world, after the US. But Driving on Indian roads is like walking on a tight rope. You've got to be really careful with the wheels because of pathetic road conditions that could test the patience of even the most seasoned drivers. Slide 4 - It comes right after the rainy season when the roads are filled with a unique death trap called potholes. They come in all sizes and forms, from really small ones to ones that can pose a challenge to coal mines when it comes to depth. An interesting fact about potholes is that they’re like icebergs. You only see the surface, it’s almost impossible to gauge their depth until it’s too late. Before you know it, the car is overturned and you’re severely injured or even crushed to death. One of the reasons for the formation of potholes is continuous, never-ending use of the road by heavy vehicles and lack of maintenance. Slide 8 - Zoji La Pass - a major link between Ladakh and Kashmir The blink of an eye could land a vehicle straight down from an altitude of 3,538 meters from the country’s most dreaded roads as it is frightfully narrow and covered in snow sludge round the season. For instance, there are light, medium and high traffic roads, based on the volume of traffic a road receives. Similarly, you have pedestrian paths, cycle tracks, and motor vehicle roads, classifying roads in terms of the type of traffic a road receives. In 2018, The national highways comprised 1.94% of the total road network in India. Various state highways constituted 2.97% of the total length of roads. But 30.2 % of total road accidents and 35.7% of all deaths happened in our national highways. State highways were not exactly lagging behind with 25.2% and 26.8% of total accidents and deaths respectively. According to experts, the main causes of road accidents in India are rapid urbanization, poor safety, lack of enforcement, distracted drivers, influence of drugs or alcohol, speeding and a failure to wear seat-belts or helmets. Overspeeding is the reason for the highest percentage of deaths relating to road accidents. Yet, nobody cares driving a fast car or a bike at fatal speeds.

Recommended
More Related Content
What's hot
What's hot (20)
Similar to Safety on Indian Roads a Big Challenge.ppt
Similar to Safety on Indian Roads a Big Challenge.ppt (20)
More from Emaan Sharma
More from Emaan Sharma (13)
Recently uploaded
Recently uploaded (20)
Safety on Indian Roads a Big Challenge.ppt
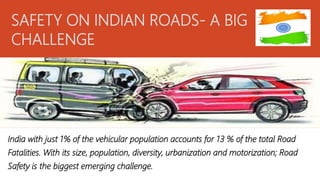
- 1. SAFETY ON INDIAN ROADS- A BIG CHALLENGE India with just 1% of the vehicular population accounts for 13 % of the total Road Fatalities. With its size, population, diversity, urbanization and motorization; Road Safety is the biggest emerging challenge.
- 3. ROAD CONDITIONS OF INDIA OVERVIEW
- 4. IMPROPER MAINTENANCE – POTHOLES ON ROADS
- 5. IMPROPER MAINTENANCE – POTHOLES ON ROADS
- 7. ONGOING ROADSIDE CONSTRUCTION & LOSS OF DRAINAGE FACILITIES
- 8. PRESENCE OF NON-MOTORISED TRANSPORT
- 9. IMPROPER DRAINAGE FACILITIES POTHOLES, CRACKING AND OTHER ROAD DEFECTS
- 10. UNDERCONSTRUCTED CITY ROAD & BAD WEATHER CONDITIONS
- 11. IMPROPER REPAIR/ UNDERCONSTRUCTED ROAD
- 12. ROAD DEFECTS
- 13. WEARING OF TOP SURFACE OF ROAD
- 14. LACK OF PROPER DRAINAGE SYSTEMS
- 15. IRREGULAR PLANNING AND IMPROPER DRAINAGE FACILITIES
- 16. PRESENCE OF NON-MOTORISED TRANSPORT
- 17. IRREGULAR DRIVING LACK OF ATTENTION
- 18. Traffic in India In Indian road- traffic the problems, like congestion, unpredictable travel-time delays and road-accidents, are taking a serious shape.
- 20. Road Blockages
- 22. A mixture of – Wrong Parking on roadsides leads to traffic congestion & Irregular traffic flow & Presence of non-motorised traffic
- 23. A typical example of poor driver characteristics
- 24. BOTTLENECKS
- 25. OVER LOADING
- 28. RISKING LIVES BY OVERLOADING
- 29. KEY CAUSE OF ACCIDENT - DRIVER & OVER LOADING
- 30. A typical example of “Hum Sath Sath hain”
- 32. ACCIDENTS
- 46. Number of vehicles, population and road traffic fatalities in India Year Vehicles per million Population Fatalities per million population 1971 1,865 548,159,652 27.36 1975 2,472 625,246,123 27.03 1981 5,391 683,329,097 41.56 1985 9,170 772,196,737 50.76 1991 21,374 843,930,861 67.07 1992 23,507 861,693,859 69.28 1993 25,505 879,279,448 68.92 1994 27,660 897,223,927 71.33 1995 30,295 915,534,620 77.22 1996 33,558 934,219,000 76.96 1997 37,231 949,200,000 79.01 1998 N.A 965,600,000 82.85
- 47. ACCIDENTS CLASSIFIED ACCORDING TO PRIMARY CAUSES OF ACCIDENTS IN INDIA PRIMARY CAUSE OF ACCIDENTS NUMBER OF ACCIEDNTS PERCENTAGE Fault of driver of motor vehicle 46,951 48.5 Fault of driver of a vehicle other than a motor vehicle 4,478 4.6 Fault of pedestrians 8,877 9.1 Fault of cyclists 3,504 3.6 Fault of passengers 1,381 1.4 Defect in mechanical condition of motor vehicle 3,267 3.4 Defect road surface 1,153 1.2 Bad weather conditions 1,108 1.1 Other causes 22,574 23.2 Causes not known 3,819 3.9 Total 97,112 100.0
- 48. CAUSES OF ACCIDENTS ATTRIBUTED TO FAULT OF BUS DRIVER CAUSE NO . OF ACCIDENTS PERCENTAGE FATAL INJURY NON-INJURY TOTAL Improper/rash driving 34 56 53 143 40.6 Wrong overtaking 5 23 20 48 13.6 Lack of attention 11 26 25 62 17.6 To close following 0 8 29 37 10.5 Improper turning 2 7 5 14 4.0 Disregarded pedestrian 1 3 0 4 1.1 Did not give a right-of-way to 1 3 3 7 2.0 Incoming vehicle others 4 19 14 37 10.6 Total 58 145 149 352 100.0
- 49. PROPORTION OF VEHICLES INVOLVED IN FATAL CRASHES LOCATION VEHICLE INVOLVED , PER CENT TRUCK BUS CAR MUMBAI 52 16 24 DELHI 40 33 16 HIGHWAYS 65 16 15
- 50. PERCENTAGE SHARE OF FATALITIES ON DIFFERENT CATEGRIES OF ROADS ROAD TYPE FATALITIES (%) NATIONAL HIGHWAYS 25.3 STATE HIGHWAYS 22.2 LOWER CATOGARIES ROADS 52.5
- 51. CASES OF ACCIDENT SEVERITY
- 52. INTERNATIONAL COMPARISON OF ACCIDENT RATES S.NO. NAME OF COUNTRY FATALITIES PER THOUSAND ACCIDENTS 1 JAPAN 18.00 2 U.S.A. 25.00 3 U.K. 24.00 4 AUSTRALIA 125.52 5 FRANCE 50.00 6 INDIA 163.00 7 BRAZIL 229.51 SOURCE : Accident Prevention and Trauma Care Management, NATPAC, Trivandrum, May, 1987
- 53. MAIN CAUSES OF ACCIDENTS 1) MAGNITUDE OF VEHICLE POPULATION 2) POOR CONDITIONS OF ROADS/ ROAD DEFECTS 3) POOR GEOMETRICS 4) OVERLOADING 5) VEHICULAR DEFICIENCY 6) RIBBON DEVELOPMENT/ ROADSIDE ENCROACHMENTS 7) ROADSIDE CONSTRUCTION
- 54. MAIN CAUSES OF ACCIDENTS 8) BAD WEATHER CONDITIONS 9) POOR DRAINAGE SYSTEMS 10) PRESENCE OF NON-MOTORISED TRANSPORT i.e. CYCLES, RICKSHAW, HAND CARTS, ANIMAL DRAWN CARTS AND TONGA’S 11) IMPROPER PARKING ON ROAD SIDES 12) MISSING BARRICADES ON DANGEROUS LOCATIONS 13) IMPROPER MAINTENANCE • DIRTY SIGN BOARDS WHICH ARE NOT MAINTENED, THUS NOT READABLE • CULVERTS NOT COVERED ON CITY ROADS • IMPROPER LIGHTING FACILITY ON HIGHWAYS AND EXPRESSWAYS
- 55. MAIN CAUSES OF ACCIDENTS 14) UNPREDICTABLE HUMAN BEHAVIOUR • DRUNKEN DRIVING • OVER SPEEDING/ RASH DRIVING • VIOLATION OF TRAFFIC RULES • JUMPING OF TRAFFIC SIGNALS • DRIVER – KEY PERSON FOR ACCIDENTS • LACK OF ATTENTION • TEXTING AND DRIVING • IGNORING SAFETY – NOT WEARING HELMETS, SAFETY BELTS • OVERSIZED VEHICLES – DRIVING BIG TRUCKS CALLED TROLLAS IN PUNJAB • DRIVING ON WRONG SIDE
- 56. Total figures
- 57. Summary of accidents & deaths on National Highways
- 58. Summary of accidents & deaths on State Highways
- 59. Accidents and Deaths figures - Analysis by type of Collision
- 60. Total Accidental & death toll figures related to road features
- 61. Total Accidental & death toll figures related to Potholes
- 62. Total figures of accidents & deaths based on vehicle type
- 63. Figures for persons killed in Bus accidents
- 64. Figures for persons killed in accidents from 2 wheelers
- 65. Figures for persons killed in accidents from 3 wheelers
- 66. Figures for persons killed in accidents from 4 wheelers
- 67. Figures for persons killed in accidents from other vehicles
- 68. Figures for persons killed in accidents from truck/ lorry/ tractor
- 69. Total figures for accidents and deaths based on Driver Characteristics
- 70. Accidents and deaths due to Drunken Driving
- 71. Accidents and death figures based on jumping Red lights
- 72. Accidents and deaths due to wrong side driving
- 73. Accidents and deaths due to Over Speeding of vehicle
- 74. Punjab - Accidents & persons killed due to Drunken Driving
- 75. Punjab - Accidents & persons killed due to Red Light Jumping
- 76. Punjab - Accidents & persons killed due to Driving on wrong side of the road
- 77. Punjab - Accidents & persons killed due to Over speeding
- 78. Conclusion: In today's world road and transport has become an integral partof every human being. Every body is a road user in one shape or the other. The present transport system has minimized the distances but it has on the other hand increased the life risk. Every year road crashes result in loss of lakhs of lives and serious injuries to crores of people. In India itself about eighty thousand people are killed in road crashes every year which is thirteen percent of the total fatality all over the world. Man behind the wheel plays an important role in most of the crashes. In most of the cases crashes occurs either due to carelessness or due to lack of road safety awareness of the road user. Hence, road safety education is as essential as any other basic skills of survival.
- 79. Where is the Problem? Whether the standards themselves are adequate to take care of safety ? Or Whether the Standards need to be improved ?
- 80. How can the problem be solved? 1) Comprehensive review of the design standards 2) Incorporating new/improved standards
- 81. Road map for solving the problems Capacity building in areas such as – • Safety Audit (Training and accreditation of auditors) • Design and Operation (Training of Engineers and Police) • Creating Centres of Excellence and training Interdisciplinary coordination and data sharing among Road/ Transport Authorities, Police, Trauma care Centres • Accident data and analysis for improving design • Traffic Management/ Incident management for safe operation Ownership of road Safety • Creating National Road Safety and Traffic Management board
- 82. Action Plan • Replace worn out/ missing road signs and markings for the entire network (even before safety audit) • Conduct Safety Audit of entire network • Implement Safety Auditor’s recommendations • Concurrently, request IRC to review all standards with safety focus and bring out changes or new standards • Create Centres of Excellence • Create National Road Safety and Traffic Management Board with jurisdiction over all agencies responsible for safety.
- 83. A Presentation by Emaan Sharma