2. 2 Eisenbruch et al.
(Roney & Simmons, 2013). Therefore, reasoning that red
clothing may reflect enhanced mating motivation, we
predicted that the odds of wearing red would be posi-
tively associated with within-subjects shifts in estradiol
and negatively associated with within-subjects shifts in
progesterone. Although our a priori hypotheses per-
tained to the individual hormones on the basis of previ-
ous findings for libido, we also tested the effects of the
estradiol-to-progesterone ratio, given our interest in
cycle-phase shifts, because this ratio better predicts fer-
tile-window timing (i.e., cycle days when conception is
possible) than does either hormone in isolation (Baird,
Weinberg, Wilcox, McConnaughey, & Musey, 1991).
Method
Participants and procedure
We took photos of a sample of naturally cycling women
who participated in a broader study on the relationship
between ovarian hormones and mating behavior (see
Grillot, Simmons, Lukaszewski, & Roney, 2014; Roney &
Simmons, 2013). A total of 52 women participated in the
overall study, but only data from 46 women who con-
sented to use of their photos were analyzed here (mean
age = 18.80 years, SD = 1.22). Twenty-five of these
women identified themselves as White, 10 as Asian, 7 as
Hispanic, and 4 as “other.” Further details regarding this
sample can be found in Roney and Simmons (2013).
Participants provided written informed consent for their
participation, and all procedures were approved by the
institutional review board at the University of California,
Santa Barbara.
Participants attended four afternoon laboratory ses-
sions during either one or two menstrual cycles. The ses-
sions were spaced approximately 1 week apart, so each
woman participated in either four or eight laboratory ses-
sions. During each session, women provided saliva sam-
ples via passive drool and were photographed under
standard lighting conditions in the clothing that they had
worn to the lab. Thirty-six women provided photos
across two menstrual cycles (separated by 1–2 months)
and 10 women provided photos in one cycle.
As part of the broader study, the participants also col-
lected daily saliva samples each morning. Hormones were
assayed from a subset of these to estimate day of ovula-
tion for the fertile-window analyses (see Estimation of
Fertile-Window Timing). Only samples collected from the
afternoon laboratory sessions were used to test hormonal
predictors of red-clothing choices because hormones
were assayed from every laboratory-session saliva sample
but from only a subset of the daily morning samples.
All data and stimuli from the participants were col-
lected years before the authors considered examining
red-clothing choices. Therefore, sample size was deter-
mined by the original data collection. The original study
was designed to examine hormonal predictors of wom-
en’s sexual psychology and behavior, as well as their
physical attractiveness. Sample size was determined as
the largest number of participants for whom available
funding would allow daily hormone assays across two
menstrual cycles.
Measures
Hormone measures. Saliva samples were shipped to
the Endocrine Core Laboratory of the California Regional
Primate Research Center (Davis, CA), where they were
assayed for concentrations of estradiol, testosterone, and
progesterone. Samples were centrifuged at 3,000 rpm for
20 min to separate the aqueous component from other
particles. Estradiol concentrations were estimated in
duplicate using the high-sensitivity salivary 17β-estradiol
enzyme immunoassay kit (Salimetrics LLC, State College,
PA). The estradiol assay has a least detectable dose of 0.1
pg/ml; intra-assay and interassay coefficients of variation
(CVs) were 4.52% and 8.15%, respectively. Concentra-
tions of progesterone were estimated in duplicate using
commercial radioimmunoassay kits (Siemens Health
Diagnostics, Inc., Los Angeles, CA). The procedures were
modified as follows to accommodate overall lower levels
of progesterone in human saliva relative to plasma: (a)
Standards were diluted to concentrations ranging from
0.05 to 4.0 ng/ml, and (b) sample volume was increased
to 200 µl. The progesterone assay has a least detectable
dose of 0.00914 ng/ml; intra-assay and interassay CVs
were 4.57% and 7.36%, respectively. Concentrations of
testosterone were estimated in duplicate using commer-
cial double-antibody radioimmunoassay kits (Beckman
Coulter Inc., Webster, TX). The testosterone assay has a
least detectable dose of 1.3697 pg/ml; intra-assay and
interassay CVs were 5.20% and 9.83%, respectively.
All saliva samples from the laboratory sessions were
assayed. Mean concentrations were 2.96 pg/ml (SD =
1.23) for estradiol, 0.05 ng/ml (SD = 0.04) for progester-
one, and 26.15 pg/ml (SD = 14.98) for testosterone. For
the daily samples, all samples in a 9-day window sur-
rounding the initial estimated day of ovulation (com-
puted as 15 days before the end of each cycle) were sent
for assay, as were samples from alternating days outside
of this window. The estradiol-to-progesterone ratio was
computed by first converting the unit of measure for each
hormone to picomoles per liter and then dividing the
value for estradiol by the value for progesterone.
Red-clothing measures. Photos from the participants’
lab sessions were coded independently by two female
research assistants who were blind to the participants’
at UNIVERSIDAD DEL DESARROLLO on July 15, 2015pss.sagepub.comDownloaded from
3. Hormonal Predictors of Clothing Choices 3
hormonal status, using criteria from Beall and Tracy
(2013). Research assistants were instructed to code the
color (black, blue, gray, green, pink, red, white, yellow, or
other) of each visible item in seven categories of clothing
(dress, shirt/blouse, jacket or sweatshirt, pants, shorts,
skirt, and accessories). If an item was multicolored, they
were instructed to pick the color that was most prevalent.
Because the lower body was not fully visible in all photo-
graphs, and because past research on red clothing has
focused on the color of shirts (Beall & Tracy, 2013), the
dependent variable for our data analyses was whether the
subject was coded as wearing a top garment (i.e., shirt,
sweatshirt, dress, or jacket) that was red or pink (hereafter
referred to as red). Coders discussed each case in which
they disagreed on the presence of a red top (n = 2) and
then reached a joint decision regarding the final coding.
Data analysis
Estimation of fertile-window timing. To classify
individual photo sessions as being inside or outside of
the fertile window, we used the daily hormone values to
estimate the day of ovulation in each cycle. We first
judged whether cycles were ovulatory by following the
procedures in Ellison, Lager, and Calfee (1987), in which
cycles that did not achieve a maximum progesterone
value of at least 300 pmol/L were judged anovulatory; 53
of 82 total cycles were judged ovulatory. (Note that in the
previous articles in which cycle-phase effects on red-
clothing choices were assessed, ovulatory status was not
confirmed, which was an additional source of error.)
Next, for each cycle identified as ovulatory, we deter-
mined the day of peak estradiol. Following the method
of Lipson and Ellison (1996), we then found the two con-
secutive days (including or after the estradiol peak)
between which there was the greatest decrease in estra-
diol. The second of those two days was considered the
day of ovulation (for further details, see Grillot et al.,
2014). The fertile window was then defined as the day of
ovulation and the 5 days preceding it (see Wilcox, Wein-
berg, & Baird, 1995).
To compare findings across different methods of esti-
mating ovulatory timing, we also computed high-fertility
days using the method of Beall and Tracy (2013). They
specified Days 6 to 14 after the start of menses as high-
fertility days and Days 0 to 5 and 15 to 28 after menses
onset as low-fertility days. We counted forward from the
participants’ self-reported last onset of menses to com-
pute these two time windows.
Statistical models. We constructed binary mixed logis-
tic regression models in IBM SPSS Statistics (Version 22)
to model the probability of wearing a red top as a dichot-
omous outcome. Although our data were technically on
three levels (laboratory sessions nested within cycles
nested within women), we took the advice of statistical
consultants and constructed two-level models (sessions
nested within women), given the known convergence
problems in logistic mixed regression models with few
higher level units (in this case, two cycles). The two-level
structure meant that the probability of wearing red was
modeled across four to eight sessions within each woman,
depending on whether she contributed one or two cycles
of data. All models included a random subject-level inter-
cept and used robust estimation of standard errors.
To place all variables on the same metric, we first stan-
dardized values for hormone predictor variables relative
to their respective grand means, but we then group-mean
centered the standardized values within cycles. Thus, for
women with two cycles of data, each hormone value was
centered relative to the mean of the cycle from which it
was drawn rather than relative to the woman’s overall
mean. This centering decision means that regression mod-
els assessed the effects of within-cycle shifts in hormones.
Centered hormone values that were more than 3 standard
deviations higher or lower than their respective means
were excluded to avoid undue influence of outliers (there
was one such outlier each for testosterone, progesterone,
and the estradiol-to-progesterone ratio), though results
were very similar when outliers were included. Fertile-
window timing was entered as a dummy variable. Models
including the fertile-window variable were computed
only for ovulatory cycles, whereas models containing
only hormonal predictors were estimated for all cycles.
Tests for mediation of fertile-window effects by hormonal
predictors were conducted using the Monte Carlo method
for assessing mediation as described in Selig and Preacher
(2008), with adjustment of coefficients to account for the
dichotomous outcome variable (see Herr, 2014).
Results
Fertile-window timing
Across all ovulatory cycles, the participants wore red 17%
(8 of 48 days) of the time during the fertile window but
only 8% (13 of 160 days) of the time on other cycle days.
A mixed regression model confirmed that, within subjects,
the odds of wearing red were higher during the estimated
fertile window than on other cycle days, b = 0.93, p = .040,
odds ratio (OR) = 2.53, 95% confidence interval (CI) =
[1.04, 6.14]. The 2.53 odds ratio indicates that the odds of
wearing a red top were about 2.5 times higher inside the
fertile window, but there was a wide confidence interval.
Using Beall and Tracy’s (2013) counting method of
estimating high fertility (see Method), we found that red
was worn on 11% (8 of 76) of high-fertility days and on
a virtually identical 10% (13 of 129) of low-fertility days.
at UNIVERSIDAD DEL DESARROLLO on July 15, 2015pss.sagepub.comDownloaded from
4. 4 Eisenbruch et al.
A mixed regression model confirmed the absence of a
within-subjects fertility effect when using this method,
b = 0.09, p > .250, OR = 1.09, 95% CI = [0.47, 2.55]. These
results pertain only to ovulatory cycles, but application of
this method to all sessions still produced a null result
(i.e., a 10% rate of wearing red on both high- and low-
fertility days).
Hormonal predictors
Table 1 presents results of separate mixed logistic regres-
sion models to test the zero-order effects of each mea-
sured hormone and the estradiol-to-progesterone ratio
on the odds of wearing red (we had no predictions for
testosterone, but we included it given the common
belief that testosterone affects women’s libido; however,
see Roney & Simmons, 2013). Only the estradiol-to-
progesterone ratio had a confidence interval for the odds
ratio that excluded 1. For each 1-SD increase in the estra-
diol-to-progesterone ratio above a cycle mean, the odds
of wearing red nearly doubled. Null results for the three
individual hormones persisted when all were entered
simultaneously into the same regression model (without
the estradiol-to-progesterone ratio), whereas the effect
size for the estradiol-to-progesterone ratio was even
larger when added to a model that included the three
individual hormones, b = 0.84, p = .009, OR = 2.33, 95%
CI = [1.24, 4.36].
Next, for the subset of ovulatory cycles, we simultane-
ously entered fertile-window timing and the estradiol-to-
progesterone ratio into a logistic mixed regression model.
In this model, the confidence interval for the odds ratio
associated with fertile window timing no longer excluded
1, b = 0.47, p > .250, OR = 1.60, 95% CI = [0.63, 4.03],
whereas the interval for the estradiol-to-progesterone
ratio did exclude 1, b = 0.65, p = .041, OR = 1.92, 95%
CI = [1.03, 3.58]. In a Monte Carlo simulation with 20,000
random draws, the estradiol-to-progesterone ratio did in
fact mediate the effect of fertile-window timing on the
probability of wearing red, indirect effect = 0.042, 95%
CI = [0.002, 0.09].
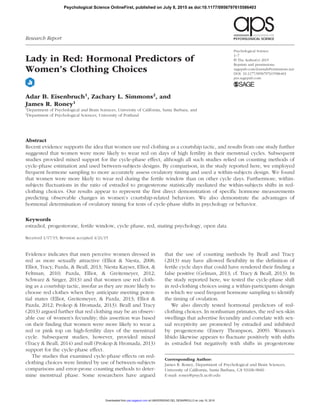
Figure 1 presents the mean estradiol-to-progesterone
ratio and mean probability of wearing red aggregated
across all ovulatory cycles and plotted against cycle days.
The fertile-window effect is visible as the increased prob-
ability of red-clothing choices in the late follicular phase
relative to most other regions of the cycle. The corre-
spondence between the estradiol-to-progesterone ratio
and frequency of red clothing is also clearly visible; both
variables show sharp declines from their follicular-phase
peaks after the onset of the nonfecund luteal phase.
Discussion
The present findings support the idea that women more
frequently choose to wear red clothing during the fertile
window than on other days of their menstrual cycles.
Previous studies had provided mixed evidence for this
effect (Beall & Tracy, 2013; Prokop & Hromada, 2013;
Tracy & Beall, 2014) but were limited by between-subject
analyses, error-prone methods of estimating ovulatory
timing, and an inability to exclude anovulatory cycles.
Here, we used hormonal confirmation of ovulatory tim-
ing to demonstrate this effect within subjects. These
results suggest that women are more likely to exploit
men’s preference for women wearing red (see the intro-
duction) on days when conception is possible than on
other days in the cycle. This complements other findings
of women’s increased motivation to enhance their attrac-
tiveness during the fertile window (e.g., Durante, Li, &
Haselton, 2008).
It is not entirely clear why red in particular is used to
enhance attractiveness. Women’s facial redness is posi-
tively related to shifts in estradiol (Jones et al., 2015), and
red flushing has been associated with sexual arousal
(Katchadourian, 1984). Men may therefore prefer red as a
marker of hormone production or sexual interest, which
women may exploit when their sexual motivation is
higher. Further research on ultimate causes is necessary.
Our results highlight limitations of counting methods
of cycle-phase estimation (see Gildersleeve, Haselton, &
Fales, 2014). Our classification of fertile-window timing
via frequent hormone sampling (see Baird et al., 1991;
Lipson & Ellison, 1996) agreed with the counting method
used by Beall and Tracy (2013) in only 64% of total cases,
and 46% of hormone-identified high-fertility days were
classified as low fertility by the counting method. Beall
and Tracy’s classification of Days 6 to 14 as high-fertility
days may be especially problematic given evidence that
later days are often fertile (Wilcox, Dunson, Weinberg,
Trussell, & Baird, 2001). However, other counting meth-
ods could be more accurate. Our data nonetheless dem-
onstrate errors associated with common counting
methods and thus lead us to recommend hormonal con-
firmation of ovulatory timing.
Table 1. Zero-Order Effects of the Hormone Variables on the
Odds of Wearing Red
Hormone variable b p Odds ratio
Estradiol −0.03 > .250 0.97 [0.59, 1.60]
Progesterone −0.27 > .250 0.76 [0.36, 1.63]
Testosterone −0.24 > .250 0.79 [0.31, 1.98]
E:P ratio 0.63 .010 1.88 [1.17, 3.03]
Note: The values in square brackets are 95% confidence intervals.
Each row represents a separate binary mixed logistic regression
model predicting red clothing as a dichotomous outcome. E:P ratio =
estradiol-to-progesterone ratio.
at UNIVERSIDAD DEL DESARROLLO on July 15, 2015pss.sagepub.comDownloaded from
5. Hormonal Predictors of Clothing Choices 5
We also found that the estradiol-to-progesterone ratio
positively predicted the odds of wearing red clothing, and
that this ratio mediated the fertile-window effect. This is
the first direct demonstration of statistical mediation of a
fertile-window effect by hormone variables, but it should
be interpreted with some caution. Contrary to our hypoth-
eses, we did not observe main effects of estradiol and
progesterone but rather a nonadditive effect produced by
their ratio. Previous work examining daily fluctuations in
women’s libido demonstrated only additive effects of
these hormones (Roney & Simmons, 2013), whereas stud-
ies on the motivational salience of sexually dimorphic
faces also found effects of the estradiol-to-progesterone
ratio (Wang, Hahn, Fisher, DeBruine, & Jones, 2014).
Variables that are tightly coupled to the fertile window
may be especially sensitive to this ratio, given how closely
it tracks fluctuations in fecundity (Baird et al., 1991), but
future research will be necessary to test this possibility
and to systematically map the additive and nonadditive
psychological effects of ovarian hormones.
In conclusion, we found positive effects of the fertile
window and the estradiol-to-progesterone ratio on wom-
en’s odds of wearing red. The finding of a fertile-window
effect replicates a contested effect (Beall & Tracy, 2013;
Gelman, 2013) and complements other studies in sug-
gesting that the motivational salience of mate attraction
increases on fecund cycle days (e.g., Durante et al., 2008).
The findings regarding hormones complement recent
studies that have provided evidence for hormonal predic-
tors of cycle-phase shifts in mate preferences (e.g.,
Pisanski et al., 2014; Roney & Simmons, 2008; Roney,
Simmons, & Gray, 2011) and extends this literature to
include hormonal prediction of women’s observable
courtship behaviors.
Author Contributions
A. B. Eisenbruch and J. R. Roney designed the study. Z. L.
Simmons and J. R. Roney collected the original data set. A. B.
Eisenbruch and J. R. Roney conducted the data analysis and
drafted the manuscript, and Z. L. Simmons provided critical
revisions. All authors approved the final version of the manu-
script for submission.
Acknowledgments
We thank Shelly Gable for statistical advice, Ellise Fallon and
Samantha Wilcoxon for data assistance, and Rachel Grillot for
comments on the manuscript. Other analyses from this data set
have been published in Roney and Simmons (2013) and Grillot,
Simmons, Lukaszewski, and Roney (2014).
Declaration of Conflicting Interests
The authors declared that they had no conflicts of interest with
respect to their authorship or the publication of this article.
.00
.05
.10
.15
.20
.25
–1.50
–1.00
–0.50
0.00
0.50
1.00
< −11 −11 to −9 −8 to −6 −5 to −3 −2 to 0 1 to 3 4 to 6 7 to 9 10 to 13
MeanProbabilityofWearingRed
Cycle Days Relative to Ovulation
Estradiol-to-Progesterone Ratio
Mean Probability of Wearing Red
Estradiol-to-ProgesteroneRatio(Meanz-Score)
Fig. 1. Estradiol-to-progesterone ratio (left y-axis) and probability of wearing red (right y-axis) plotted against cycle day
relative to ovulation. Day 0 is the estimated day of ovulation. Days in the follicular phase (i.e., days before ovulation) are
numbered negatively, and days in the luteal phase (i.e., days after ovulation) are numbered positively. Error bars represent
95% confidence intervals.
at UNIVERSIDAD DEL DESARROLLO on July 15, 2015pss.sagepub.comDownloaded from
6. 6 Eisenbruch et al.
Funding
This research was funded by a Hellman Family Faculty
Fellowship; by a University of California, Santa Barbara (UCSB),
Academic Senate grant (both to J. R. Roney); and by a grant
from the Global Centers of Excellence Program of Hokkaido
University to the Center for Evolutionary Psychology at UCSB.
Open Practices
All data have been made publicly available via Merritt and can
be accessed at http://n2t.net/ark:/13030/m5bc629d. The com-
plete Open Practices Disclosure for this article can be found
at http://pss.sagepub.com/content/by/supplemental-data. This
article has received the badge for Open Data. More informa-
tion about the Open Practices badges can be found at https://
osf.io/tvyxz/wiki/1.%20View%20the%20Badges/ and http://
pss.sagepub.com/content/25/1/3.full.
References
Baird, D. D., Weinberg, C. R., Wilcox, A. J., McConnaughey,
D. R., & Musey, P. I. (1991). Using the ratio of urinary
oestrogen and progesterone metabolites to estimate day of
ovulation. Statistics in Medicine, 10, 255–266.
Beall, A. T., & Tracy, J. L. (2013). Women are more likely to
wear red or pink at peak fertility. Psychological Science,
24, 1837–1841.
Durante, K. M., Li, N. P., & Haselton, M. G. (2008). Changes
in women’s choice of dress across the ovulatory cycle:
Naturalistic and laboratory task-based evidence. Personality
and Social Psychology Bulletin, 34, 1451–1460.
Elliot, A. J., Greitemeyer, T., & Pazda, A. D. (2013). Women’s use
of red clothing as a sexual signal in intersexual interaction.
Journal of Experimental Social Psychology, 49, 599–602.
Elliot, A. J., & Niesta, D. (2008). Romantic red: Red enhances
men’s attraction to women. Journal of Personality and
Social Psychology, 95, 1150–1164.
Elliot, A. J., & Pazda, A. D. (2012). Dressed for sex: Red as a
female sexual signal in humans. PLoS ONE, 7(4), Article
e34607. Retrieved from http://journals.plos.org/plosone/
article?id=10.1371/journal.pone.0034607
Elliot, A. J., Tracy, J. L., Pazda, A. D., & Beall, A. T. (2013). Red
enhances women’s attractiveness to men: First evidence
suggesting universality. Journal of Experimental Social
Psychology, 49, 165–168.
Ellison, P. T., Lager, C., & Calfee, J. (1987). Low profiles of sali-
vary progesterone among college undergraduate women.
Journal of Adolescent Health Care, 8, 204–207.
Emery Thompson, M. (2009). The endocrinology of intersex-
ual relationships in the apes. In P. T. Ellison & P. B. Gray
(Eds.), Endocrinology of social relationships (pp. 196–222).
Cambridge, MA: Harvard University Press.
Gelman, A. (2013, July 24). Too good to be true. Slate. Retrieved
from http://www.slate.com
Gildersleeve, K., Haselton, M. G., & Fales, M. R. (2014). Do
women’s mate preferences change across the ovulatory
cycle? A meta-analytic review. Psychological Bulletin, 140,
1205–1259.
Grillot, R. L., Simmons, Z. L., Lukaszewski, A. W., & Roney, J. R.
(2014). Hormonal and morphological predictors of wom-
en’s body attractiveness. Evolution & Human Behavior, 35,
176–183.
Herr, N. (2014). Mediation with dichotomous outcomes
[Computer software]. Retrieved from http://www.nrhpsych
.com/mediation/logmed.html
Jones, B. C., Hahn, A. C., Fisher, C. I., Wincenciak, J.,
Kandrik, M., Roberts, S. C., . . . DeBruine, L. M. (2015).
Facial coloration tracks changes in women’s estradiol.
Psychoneuroendocrinology, 56, 29–34.
Katchadourian, H. A. (1984). Fundamentals of human sexuality
(4th ed.). New York, NY: Holt, Rinehart & Winston.
Lipson, S. F., & Ellison, P. T. (1996). Comparison of salivary
steroid profiles in naturally occurring conception and non-
conception cycles. Human Reproduction, 11, 2090–2096.
Niesta Kayser, D., Elliot, A. J., & Feltman, R. (2010). Red and
romantic behavior in men viewing women. European
Journal of Social Psychology, 40, 901–908.
Pazda, A. D., Elliot, A. J., & Greitemeyer, T. (2012). Sexy red:
Perceived sexual receptivity mediates the red-attraction
relation in men viewing woman. Journal of Experimental
Social Psychology, 48, 787–790.
Pisanski, K., Hahn, A. C., Fisher, C. I., DeBruine, L. M., Feinberg,
D. R., & Jones, B. C. (2014). Changes in salivary estradiol
predict changes in women’s preferences for vocal mascu-
linity. Hormones and Behavior, 66, 493–497.
Prokop, P., & Hromada, M. (2013). Women use red in order to
attract mates. Ethology, 119, 605–613.
Roney, J. R., & Simmons, Z. L. (2008). Women’s estradiol
predicts preference for facial cues of men’s testosterone.
Hormones and Behavior, 53, 14–19.
Roney, J. R., & Simmons, Z. L. (2013). Hormonal predictors of
sexual motivation in natural menstrual cycles. Hormones
and Behavior, 63, 636–645.
Roney, J. R., Simmons, Z. L., & Gray, P. B. (2011). Changes in
estradiol predict within-women shifts in attraction to facial
cues of men’s testosterone. Psychoneuroendocrinology, 36,
742–749.
Schwarz, S., & Singer, M. (2013). Romantic red revisited: Red
enhances men’s attraction to young, but not menopausal
women. Journal of Experimental Social Psychology, 49,
161–164.
Selig, J. P., & Preacher, K. J. (2008). Monte Carlo method for assess-
ing mediation: An interactive tool for creating confidence
intervals for indirect effects [Computer software]. Available
from http://www.quantpsy.org/medmc/medmc.htm
Tracy, J. L., & Beall, A. T. (2013, July 30). Too good does not
always mean not true [Web log post]. Retrieved from http://
ubc-emotionlab.ca/2013/07/too-good-does-not-always-
mean-not-true/
Tracy, J. L., & Beall, A. T. (2014). The impact of weather on
women’s tendency to wear red or pink when at high risk
for conception. PLoS ONE, 9(2), Article e88852. Retrieved
from http://journals.plos.org/plosone/article?id=10.1371/
journal.pone.0088852
at UNIVERSIDAD DEL DESARROLLO on July 15, 2015pss.sagepub.comDownloaded from
7. Hormonal Predictors of Clothing Choices 7
Wang, H., Hahn, A. C., Fisher, C. I., DeBruine, L. M., & Jones,
B. C. (2014). Women’s hormone levels modulate the moti-
vational salience of facial attractiveness and sexual dimor-
phism. Psychoneuroendocrinology, 50, 246–251.
Wilcox, A. J., Dunson, D. B., Weinberg, C. R., Trussell, J.,
& Baird, D. D. (2001). Likelihood of conception with a
single act of intercourse: Providing benchmark rates for
assessment of post-coital contraceptives. Contraception,
63, 211–215.
Wilcox, A. J., Weinberg, C. R., & Baird, D. D. (1995). Timing of
sexual intercourse in relation to ovulation: Effects on the
probability of conception, survival of the pregnancy, and
sex of the baby. New England Journal of Medicine, 333,
1517–1521.
at UNIVERSIDAD DEL DESARROLLO on July 15, 2015pss.sagepub.comDownloaded from