
Recommended
Recommended
More Related Content
What's hot
What's hot (17)
Similar to Image registration using weighted region graphs
Similar to Image registration using weighted region graphs (20)
Image registration using weighted region graphs
- 1. Image registration using a weighted region adjacency graph. Muhannad Al-Hasan and Mark Fisher School of Computing Sciences, University of East Anglia, Norwich, UK. ABSTRACT Image registration is an important problem for image processing and computer vision with many proposed applications in medical image analysis.1, 2 Image registration techniques attempt to map corresponding features between two images. The problem is particularly difficult as anatomy is subject to elastic deformations. This paper considers this problem in the context of graph matching. Firstly, weighted Region Adjacency Graphs (RAGs) are constructed from each image using an approach based on watershed saliency.3 The vertices of the RAG represent salient regions in the image and the (weighted) edges represent the relationship (bonding) between each region. Correspondences between images are then determined using a weighted graph matching method. Graph matching is considered to be one of the most complex problems in computer vision, due to its combinatorial nature. Our approach uses a multi-spectral technique to graph matching first proposed by Umeyama4 to find an approximate solution to the weighted graph matching problem (WGMP) based on the singular value decomposition of the adjacency matrix. Results show the technique is successful in co-registering 2-D MRI images and the method could be useful in co-registering 3-D volumetric data (e.g. CT, MRI, SPECT, PET etc.). Keywords: Medical Image Registration, Multi-spectral Graph Matching, Region Adjacency Graph, Watershed segmen- tation 1. INTRODUCTION Image registration is an important problem in medical imaging with widespread applications in oncology, cardiac studies, trauma, inflammatory diseases and different neurological disorders including cancer, Alzheimer’s disease and schizophre- nia. Co-registration is becoming increasingly important for the fusion of multi-modal volumetric data. For example, future radiotherapy treatment planning may use both functional and diagnostic imaging modalities to achieve higher accuracy and surgical simulation will enable surgeons to plan and simulate complex surgical procedures. For 2-d data, image reg- istration can be defined as the fusion of two or more images of the same scene taken under different conditions (times, viewpoints, and/or with different sensors). During the last decade, the development of new medical image acquisition devices together with an increase in computing resources has driven research in medical image registration. A compre- hensive survey of image registration methods was published in 1992 by Brown,5 in 1998 by Maintz and M. A. Viergever2 and in 2003 by Zitov´a and Flusser.6 These describe developments of registration techniques and their application in many scientific subject areas such as medical images; computer vision, remote sensing and molecular biology. Surveying the literature, it is very difficult or even impossible to find one registration method applicable to all registration tasks but it is possible to identify a framework that underpins the task. Most registration methods consist of the following four steps: feature detection, feature matching, transform model estimation and image re-sampling and transformation. Each step is subject to its own particular problems. The detection method should have good localisation accuracy and should not be sensitive to the assumed image degradation. The feature matching step must consider the physical correspondence of features and be robust against dissimilarities due to different imaging conditions and/or the different spectral sensitivities of the sensors. The mapping functions should be chosen based on parameters computed by means of the established feature correspondence. Moreover, the accuracy of the feature detection method, the reliability of feature correspondence estimation, and the acceptable errors need to be considered to decide which differences between images have to be removed by the co-registration process and which do not. Finally, the choice of the re-sampling technique is dependent on the accuracy of the interpolation and the computational complexity. The various criteria of registration methods can be categorised by the application area, dimensionality of data, type and complexity, computational cost and registration algorithm. Graph theoretic approaches offer an intuitively attractive con- ceptual framework for the image registration problem, however, the graph matching is well known as n-p complete and thus it appears at first sight to be computationally infeasible. Email: m.al-hasan@uea.ac.uk, mhf@cmp.uea.ac.uk; Telephone: +44 (0) 1603 592671
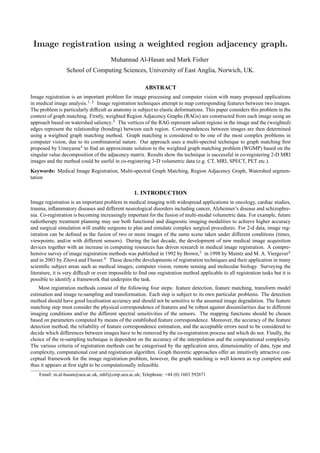
- 2. Graph matching7, 8 has been a topic of central importance in pattern perception and artificial intelligence since Barrow and Popplestone9 first demonstrated technique with respect to representing and recognising pictorial information. In this context an image can be represented by an attributed graph G = (V, E), where V = {Vi : i = 1, . . . , n} is the set of vertices or nodes that represent region properties (features) of the image and E = {Eij : i = 1, . . . , n; j = 1, . . . , n} is the set of edges between the features that represent the relations between regions along the edge. For example, early attempts in artificial intelligence used a graph to represent a ‘man’ as a graph with vertices and edges representing the properties (shape, colour, etc.) of the main physical parts (head, body, arms, etc.) and their relations (head is above the body, etc.) respectively. The problems in matching such structural descriptions are well documented,10, 11 however the work Umeyama4 and Scott et al.12 demonstrates that singular value decomposition (SVD) may be useful in giving approximate solutions to such problems. Such approaches are collectively known a ‘graph spectral methods’. This paper applies the SVD approach to obtain an approximate match between weighted graphs derived from MRI image slices based on the approach published by Umeyama.4 The approach is used to match weighted region adjacency graphs (RAG’s) created from a ‘mosaic’ image by a watershed segmentation.13 The mosaic image is a greyscale image f derived from an original morphological gradient image g(f) as follows. Let W(g) be the watershed transformation of f. Each catchment basin produced by the transform is associated with a minimum mi of the gradient g(f). A new function f , the mosaic image of f are defined by colouring each catchment basin with its minimum pixel value. A region adjacency graph (RAG) is then derived from the mosaic image. The Region Adjacency Graph is a graph which is constituted by a set of vertices or nodes representing regions of the space and a set of edges connecting two spatially neighbouring nodes. The usual way to picture a graph is by drawing a dot for each vertex and connecting these dots by a line if the corresponding two vertices from an edge as shown in Figures 1 & 3. The vertices of the directed graph correspond to the catchment basins and the adges represent the saliency of watershed lines between each adjacent region (the thickness of the edge is proportional to the saliency value). Further details of this method, and the post-processing necessary to reduce over-segmentation are published elsewhere.14 Figure 1. Example Region Adjacency Graph (RAG) derived from the mosaic image 2. FORMING GRAPHS Image segmentation is a key problem in image processing and is particularly important when medical imaging is used for pre-operative treatment planning. Segmentation is the process of spatially partitioning the pixels, so that each tile repre- sents an object of the image. A good segmentation may be recognised from the characteristics of its output components: each component should be spatially cohesive as well as spatially accurate while different components should be dissimi- lar.15 There are many segmentation techniques. The classical tool provided by mathematical morphology for segmenting images is the watershed transformation.16 In order to understand the watershed, it is necessary to consider the image as a surface, where high pixel values correspond to peaks and low pixel values correspond to valleys. Figure 2 represents such a surface topography. Just as with actual watersheds, if a drop of water were to fall on any point of the contour it would find its way to lower ground until it reaches a local minimum. These local minima are referred to as catchment basins,
- 3. Figure 2. Catchment basins and watersheds in topographic relief and all points that drain into the same catchment basin are referred to as members of the same watershed.17 The water- shed transformation can be used to define a hierarchy among the catchment basins. Starting from the initial watershed transformation of the gradient image, a mosaic image can be defined, and then it’s associated gradient; each watershed line between two adjacent catchment basins is weighted by the altitude of its lowest pixel, which is a ‘pass’ point between them. By removing all watershed lines below some threshold T a hierarchy of catchment basins can be formed. Let us now mathematically define what we mean by a hierarchy. Consider Phi to be a sequence of partitions of the plane. The family (Phi) is called a hierarchy if hi ≥ hj implies Phi ⊇ Phj , i.e. any region of partition Phi is a disjoint union of regions of partition Phj.3 By using the concept of watershed saliency we can suppress the watersheds arising from insignificant (shallow) catchment basins and build a weighted region adjacency graph corresponding to the important image regions (Figure 3). (a) (b) (c) Figure 3. (a) Original mosaic image, (b) Region Adjacency Graph (RAG), and (c) Weighted RAG 3. MATCHING GRAPHS In early 1970’s some of pioneering work on graph matching was undertaking by Barrow and Popplestone9 and by Fischer and Enschlager.18 Graph matching first focused on finding an exact match (graph isomorphism) an then on approximate inexact graph matching (graph homomorphism) solutions. Our approach is based on a graph multi-spectral approach pioneered by Umeyama4 recently extended by Luo and Hancock19 and Robles-Kelly and E. R. Hancock.20 Based on
- 4. this work, our aim is to evaluate the technique using weighted RAGs derived from an MRI data set using a morphological segmentation tool. We commence by developing a tutorial solution of WGMP using simple synthetic images and then extend the technique to larger real data sets representing MRI brain slices. Our overall goal is to develop a framework for evaluating structural correspondences between the images using inexact graph matching. 4. RESULTS One of the goals in this paper is to show how the two graphs derived from real data can be matched using weighted adjacency graph matrices. Let G = (V1, w1) and H = (V2, w2) be weighted undirected graphs and AG and AH be their adjacency matrices, respectively. By way of a tutorial example we use the weighted undirected graph matching algorithm as presented in4 to match the two synthesised RAGs shown in Figure 4. In this case Figure 4. Undirected weighted RAGs with four vertices AG = 0 11 3 2 11 0 5 8 3 5 0 2 2 8 2 0 AH = 0 4 2 2 4 0 8 2 2 8 0 5 2 2 5 0 The eigen decomposition of AG and AH are: Ug = 0.556 −0.561 −0.296 −0.537 −0.742 −0.146 −0.065 −0.651 0.103 0.734 −0.580 −0.340 0.360 0.355 0.756 −0.415 Uh = 0.196 0.535 −0.740 −0.358 −0.639 −0.454 −0.216 −0.583 0.687 −0.307 0.253 −0.608 −0.285 0.643 0.585 −0.404 Thus, we have A = ¯Uh ¯Ug T = 0.820 0.504 0.963 0.969 0.987 0.934 0.721 0.796 0.956 0.967 0.650 0.800 0.910 0.606 0.977 0.941 The permutation matrix P found using the Hungarian method is P = 0 0 0 1 1 0 0 0 0 1 0 0 0 0 1 1 When dealing with more realistic examples using RAGs from real medical images the number of nodes in AG and AH will differ in size, reflecting different numbers of regions in each image. Before the matching the graphs the less important
- 5. vertices of either AH or AG need to be deleted, such that both graphs have the same number of vertices. In this paper we use a heuristic φ to rank the importance of RAG nodes based on the attribute α at each vertex (depth of catchment basin) and the sum weights of the edges β linking adjacent regions (dynamic of catchment basin) i.e. β = n (w1, w2, . . . , wn) (1) and for each vertex φ = α β (2) Figure 5 shows RAGs G and H derived from two MRI brain slices matched using this technique. G and H have 37 and 29 vertices respectively. The nodes of G are ranked using Equation 2 and the least important eight are deleted so we end Figure 5. Two MRI brain slices and their corresponding weighted RAGs. up with two graphs having the same number of nodes. Figure 6 shows the result of applying Umeyama’s technique for graph matching as a binary {0 1} permutation matrix, and also as a trace between matching vertices. 5. PERFORMANCE EVALUATION In this section, we provide some evaluation of the graph matching technique. Firstly, we can see that a simple case for two identical RAGs yields the expected diagonal permutation matrix (Figure 7). Secondly, we compute the percentage error between the centroids of corresponding regions in each slice These results are summarised in Table 1. Finally, Table 2 shows that the results are comparable with those of others. 6. CONCLUSIONS & FUTURE WORK This paper investigated a multi-spectral graph matching approach to the image registration problem. We used the watershed transformation to generate a mosaic of MRI brain images and from this we derived weighted RAGs. We then used Umeyama’s method to match the RAG’s. The method requires that the size of each RAG is the same, so we pruned the larger RAG using a simple heuristic to rank the importance of each vertex. The results show the method to be successful and the results comparable with those published by others. Further work will focus on a more rigorous evaluation of the technique and investigate other strategies to deal with cases for which ’no correspondence’ can be found.
- 6. Figure 6. Matching the two RAGs of Figure 5 using Umeyama’s method Figure 7. Matching the identical RAGs using Umeyama’s method
- 7. Corresponding nodes Error Graph G Graph H Node (1) Node (14) 4.2% Node (2) Node (12) 5.3% Node (3) Node (18) 3.5% Node (4) Node (6) 3.6% Node (5) Node (10) 6.2% Node (6) Node (21) 7.4% Node (7) Node (19) 4.5% Node (8) Node (2) 5.3% Node (9) Node (8) 3.4% Node (10) Node (15) 4.5% Node (11) Node (11) 2.3% Node (12) Node (4) 6.5% Node (13) Node (9) 5.5% Node (14) Node (5) 7.5% Node (15) Node (26) 6.5% Node (16) Node (23) 7.5% Node (17) Node (7) 6.5% Node (18) Node (13) 3.5% Node (19) Node (16) 2.4% Node (20) Node (1) 8.2% Node (21) Node (29) 4.7% Node (22) Node (17) 3.5% Node (23) Node (3) 7.2% Node (24) Node (25) 2.4% Node (25) Node (20) 3.3% Node (26) Node (28) 3.2% Node (27) Node (27) 2.1% Node (28) Node (22) 4.5% Node (29) Node (24) 2.2% Table 1. Summary of node correspondences and associated positional error. Correspondence Method % Correct % False % None Al-Hasan 72.4 27.6 0 Luo 71 19.3 9.7 Shapiro 19.4 35.5 45.1 Table 2. Comparison with other published work
- 8. REFERENCES 1. J. S. Dunchan and N. Ayache, “Medical image analysis: Progress over two decades and challanges ahead,” IEEE Transactions on Pattern Analysis and Machine Intelligence 22, pp. 85–106, 2000. 2. J. Maintz and M. Viergever, “A survey of medical image registration,” Medical Image Analysis 2, pp. 1–37, 1998. 3. L. Najman and M. Schmitt, “Geodesic saliency of watershed contours and hierarchical segmentation,” in IEEE Trans. on Pattern Recognition and Machine Intelligence, 18:12, pp. 1163–1173, December 1996. 4. S. Umeyama, “An eigendecomposition approach to weighted graph matching problems,” in IEEE Transactions on Pattern Analysis and Machine Intelligence, 10:5, pp. 695–703, 1988. 5. L. G. Brown, “A survey of medical image registration techniques,” ACM Computing Surveys 24, pp. 326–376, 1992. 6. B. Zitov´a and J. Flusser, “Image registration methods: a survey,” Image and Vision Computing 21, pp. 977–1000, 2003. 7. A. Sanfeliu and K. S. Fu, “A distance measure between attributed relational graphs for pattern recognition,” IEEE Transactions on Systems Man and Cybernetics 13, pp. 353–362, 1983. 8. M. A. Eshera and K. S. Fu, “An image understanding system using attributed symbolic representation and inexact graph matching,” IEEE Transactions on Pattern Analysis and Machine Intelligence 8, pp. 604–618, 1986. 9. H. Barrow and R. Popplestone, “Relational descriptions in picture processing,” in Machine Intelligence, 6, pp. 377– 396, 1971. 10. W. H. Tsai and K. S. Fu, “Error correcting isomorphisms of attributed relational graphs for pattern analysis,” IEEE Transactions on Systems, Man and Cybernetics 9, pp. 757–768, 1979. 11. L. Shapiro and R. M. Haralick, “A metric for comparing relational descriptions,” in IEEE Trans. on Pattern Recog- nition and Machine Intelligence, 7:1, pp. 90–94, 1985. 12. G. L. Scott and H. C. Longuet-Higgins, “An algorithm for associating the features of two images,” in Proc. R. Soc. Lond. B, 244, pp. 21–26, 1991. 13. S. Beucher, “Segmentation tools in mathematical morphology,” in SPIE Vol. 1350: Image Algebra and Morphologi- cal Image Processing, pp. 70–84, 1990. 14. M. Al-Hasan, M. Fisher∗ , and M. Razaz, “New applications of watershed saliency technique to solve over- segmentation problems in medical imaging,” in Proc. Sixteenth International Conference on Systems Engineering, (Coventry University, Coventry, UK), Sept. 9–11 2003. 15. R. Haralick and L. Shapiro, “Survey: Image segmentation techniques,” in Computer Vision, Graphics and Image Processing, 29, pp. 100–132, 1985. 16. S. Beucher, “Watershed, hierarchical segmentation and waterfall algorithm,” in Mathematical Morphology and Its Applications to Image Processing, J. Serra and P. Soille, eds., pp. 69–76, Kluwer Academic, 1994. 17. L. Vincent and P. Soille, “Watersheds in digtal spaces: An efficient algorithm based on immersion simulations,” IEEE Transactions on Pattern Analysis and Machine Intelligence 13(6), pp. 583–598, 1991. 18. M. Fischler and R. Elschlager, “The representation and matching of pictorial structures,” IEEE Transactions on Computers 22, pp. 67–92, 1973. 19. B. Lou and E. R. Hancock, “Structural graph matching using the EM algorithm and singular value decomposition,” IEEE Transactions on Pattern Analysis and Machine Intelligence 23, pp. 1120–1136, 2001. 20. A. Robles-Kelly and E. R. Hancock, “A probabilistic spectral framework for grouping and segmentation,” Pattern Recognition 37, pp. 1387–1405, 2004.