Fracking by the numbers key impact of dirty drilling at the state and national level
•
0 likes•232 views


Recommended
Recommended
More Related Content
What's hot
What's hot (18)
Viewers also liked
Viewers also liked (20)
Similar to Fracking by the numbers key impact of dirty drilling at the state and national level
Similar to Fracking by the numbers key impact of dirty drilling at the state and national level (20)
Fracking by the numbers key impact of dirty drilling at the state and national level
- 1. Fracking by the Numbers Key Impacts of Dirty Drilling at the State and National Level
- 2. Fracking by the Numbers Key Impacts of Dirty Drilling at the State and National Level Written by: Elizabeth Ridlington Frontier Group John Rumpler Environment America Research & Policy Center October 2013
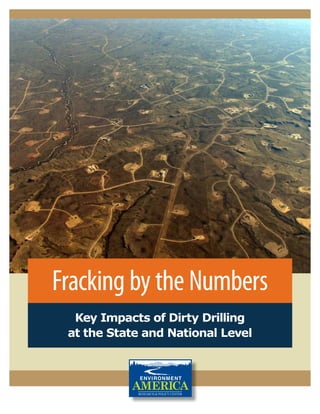
- 3. Acknowledgments Environment America Research & Policy Center sincerely thanks John Amos of SkyTruth, Anthony Ingraffea, Ph.D., P.E., and Kari Matsko, Director of People’s Oil & Gas Collaborative-Ohio for their review of drafts of this document, as well as their insights and suggestions. Tareq Alani, Spencer Alt, Elise Sullivan and Anna Vanderspek provided valuable research assistance. Thanks also to Travis Madsen of Frontier Group for technical assistance, and Tony Dutzik and Benjamin Davis of Frontier Group for editorial help. We also are grateful to the many state agency staff who answered our numerous questions and requests for data. Many of them are listed by name in the methodology. Environment America Research & Policy Center thanks the V. Kann Rasmussen Foundation and the Park Foundation for making this report possible. The authors bear responsibility for any factual errors. The recommendations are those of Environment America Research & Policy Center. The views expressed in this report are those of the authors and do not necessarily reflect the views of our funders or those who provided review. © 2013 Environment America Research & Policy Center Environment America Research & Policy Center is a 501(c)(3) organization. We are dedicated to protecting our air, water and open spaces. We investigate problems, craft solutions, educate the public and decision-makers, and help the public make their voices heard in local, state and national debates over the quality of our environment and our lives. For more information about Environment America Research & Policy Center or for additional copies of this report, please visit www.environmentamericacenter.org. Frontier Group conducts independent research and policy analysis to support a cleaner, healthier and more democratic society. Our mission is to inject accurate information and compelling ideas into public policy debates at the local, state and federal levels. For more information about Frontier Group, please visit www.frontiergroup.org. Layout: To the Point Publications, www.tothepointpublications.com Cover photo: Peter Aengst via SkyTruth/EcoFlight
- 4. Table of Contents Executive Summary . . . . . . . . . . . . . . . . . . . . . . . . . . . . . . . . . . . . . . . . . . . . . 4 Introduction . .7 Fracking Poses Grave Threats to the Environment and Public Health 8 Contaminating Drinking Water . 9 Consuming Scarce Water Resources . 11 Endangering Public Health with Air Pollution . 12 Exacerbating Global Warming . 14 Damaging America’s Natural Heritage . 14 Imposing Costs on Communities . 16 Quantifying the State and National Impacts of Fracking . .19 Wells Fracked by State . 20 Wastewater Produced . 20 Chemicals Used . . . . . . . . . . . . . . . . . . . . . . . . . . . . . . . . . . . . . . . . . . . . . . . . . . . . . . . . . . . . . . . . . . . . . . . .22 Water Used . . . . . . . . . . . . . . . . . . . . . . . . . . . . . . . . . . . . . . . . . . . . . . . . . . . . . . . . . . . . . . . . . . . . . . . . . . . .22 Air Pollution Created . . . . . . . . . . . . . . . . . . . . . . . . . . . . . . . . . . . . . . . . . . . . . . . . . . . . . . . . . . . . . . . . . . .23 Global Warming Pollution Released . 24 Acres of Land Damaged . . . . . . . . . . . . . . . . . . . . . . . . . . . . . . . . . . . . . . . . . . . . . . . . . . . . . . . . . . . . . . . .25 Policy Recommendations . .27 Methodology . .29 Notes . .41
- 5. Executive Summary Over the past decade, the oil and gas indus-try has fused two technologies—hydrau-lic fracturing and horizontal drilling—in a highly polluting effort to unlock oil and gas in underground rock formations across the United States. As fracking expands rapidly across the country, there are a growing number of documented cases of drinking water contamination and illness among nearby residents. Yet it has often been difficult for the public to grasp the scale and scope of these and other fracking threats. Fracking is already underway in 17 states, with more than 80,000 wells drilled or permitted since 2005. Moreover, the oil and gas industry is aggressively seeking to expand fracking to new states—from New York to Califor-nia to North Carolina—and to areas that provide drinking water to millions of Americans. This report seeks to quantify some of the key impacts of fracking to date—including the produc-tion of toxic wastewater, water use, chemicals use, air pollution, land damage and global warming emissions. To protect our states and our children, states should halt fracking. Toxic wastewater: Fracking produces enormous volumes of toxic wastewater—often containing cancer-causing Table ES-1. National Environmental and Public Health Impacts of Fracking 4 Fracking by the Numbers: Key Impacts of Dirty Drilling at the State and National Level and even radioactive material. Once brought to the surface, this toxic waste poses hazards for drinking water, air quality and public safety: • Fracking wells nationwide produced an estimated 280 billion gallons of wastewater in 2012. • This toxic wastewater often contains cancer-causing and even radioactive materials, and has contaminated drinking water sources from Pennsylvania to New Mexico. • Scientists have linked underground injection of wastewater to earthquakes. • In New Mexico alone, waste pits from all oil and gas drilling have contaminated groundwater on more than 400 occasions. Fracking Wells since 2005 82,000 Toxic Wastewater Produced in 2012 (billion gallons) 280 Water Used since 2005 (billion gallons) 250 Chemicals Used since 2005 (billion gallons) 2 Air Pollution in One Year (tons) 450,000 Global Warming Pollution since 2005 (million metric tons CO2-equivalent) 100 Land Directly Damaged since 2005 (acres) 360,000
- 6. Executive Summary 5 Water use: Fracking requires huge volumes of water for each well. • Fracking operations have used at least 250 billion gallons of water since 2005. (See Table ES-2.) • While most industrial uses of water return it to the water cycle for further use, fracking converts clean water into toxic wastewater, much of which must then be permanently disposed of, taking billions of gallons out of the water supply annually. • Farmers are particularly impacted by fracking water use as they compete with the deep-pocketed oil and gas industry for water, especially in drought-stricken regions of the country. Chemical use: Fracking uses a wide range of chemicals, many of them toxic. • Operators have hauled more than 2 billion gallons of chemicals to thousands of fracking sites around the country. • In addition to other health threats, many of these chemicals have the potential to cause cancer. • These toxics can enter drinking water supplies from leaks and spills, through well blowouts, and through the failure of disposal wells receiving fracking wastewater. Air pollution: Fracking-related activities release thousands of tons of health-threatening air pollution. • Nationally, fracking released 450,000 tons of pollutants into the air that can have immediate health impacts. • Air pollution from fracking contributes to the formation of ozone “smog,” which reduces lung function among healthy people, triggers asthma attacks, and has been linked to increases in school absences, hospital visits and premature death. Other air pollutants from fracking and the fossil-fuel-fired machinery used in fracking have been linked to cancer and other serious health effects. Global warming pollution: Fracking produces significant volumes of global warming pollution. • Methane, which is a global warming pollutant 25 times more powerful than carbon dioxide, is released at multiple steps during fracking, including during hydraulic fracturing and well completion, and in the processing and transport of gas to end users. • Global warming emissions from completion of fracking wells since 2005 total an estimated 100 million metric tons of carbon dioxide equivalent. Damage to our natural heritage: Well pads, new access roads, pipelines and other infrastructure turn forests and rural landscapes into industrial zones. • Infrastructure to support fracking has damaged 360,000 acres of land for drilling sites, roads and pipelines since 2005. • Forests and farmland have been replaced by well pads, roads, pipelines and other gas infrastruc-ture, resulting in the loss of wildlife habitat and fragmentation of remaining wild areas. Table ES-2. Water Used for Fracking, Selected States State Total Water Used since 2005 (billion gallons) Arkansas 26 Colorado 26 New Mexico 1.3 North Dakota 12 Ohio 1.4 Pennsylvania 30 Texas 110 West Virginia 17
- 7. • In Colorado, fracking has already damaged 57,000 acres of land, equal to one-third of the acreage in the state’s park system. • The oil and gas industry is seeking to bring fracking into our national forests, around sever-al of our national parks, and in watersheds that supply drinking water to millions of Americans. Fracking has additional impacts not quantified here—including contamination of residential water wells by fracking fluids and methane leaks; vehicle and workplace accidents, earthquakes and other public safety risks; and economic and social damage including ruined roads and damage to nearby farms. To address the environmental and public health threats from fracking across the nation: • States should prohibit fracking. Given the scale and severity of fracking’s myriad impacts, constructing a regulatory regime sufficient to protect the environment and public health from dirty drilling—much less enforcing such safeguards at more than 80,000 wells, plus processing and waste disposal sites across the country—seems implausible. In states where fracking is already underway, an immediate moratorium is in order. In all other states, banning fracking is the prudent and necessary course to protect the environment and public health. • Given the drilling damage that state officials have allowed fracking to incur thus far, at a minimum, federal policymakers must step in and close the loopholes exempting fracking from key provisions of our nation’s environmental laws. • Federal officials should also protect America’s natural heritage by keeping fracking away from our national parks, national forests, and sources of drinking water for millions of Americans. • To ensure that the oil and gas industry—rather than taxpayers, communities or families—pays the costs of fracking damage, policymakers should require robust financial assurance from fracking operators at every well site. • More complete data on fracking should be collect-ed 6 Fracking by the Numbers: Key Impacts of Dirty Drilling at the State and National Level and made available to the public, enabling us to understand the full extent of the harm that fracking causes to our environment and health. Defining “Fracking” In this report, when we refer to the impacts of “fracking,” we include impacts resulting from all of the activities needed to bring a shale gas or oil well into production using high-volume hydraulic fracturing (fracturing operations that use at least 100,000 gallons of water), to operate that well, and to deliver the gas or oil produced from that well to market. The oil and gas industry often uses a more restrictive definition of “fracking” that includes only the actual moment in the extraction process when rock is fractured—a definition that obscures the broad changes to environmental, health and community conditions that result from the use of fracking in oil and gas extraction.
- 8. Introduction 7 Introduction Many Americans have an image of the damage caused by fracking. Documen-taries and YouTube videos have shown us tap water catching on fire and families experienc-ing headaches, dizziness, nausea and other illnesses while living near fracking operations. Plane trips over Texas or Colorado reveal the grids of wells across the landscape. These snapshots illustrate the damage that frack-ing does to the environment and our health. But, until now, it has been difficult to comprehend the cumulative extent of that damage. Individual frack-ing wells, we know, can pollute the air and water of a neighborhood or town. But what does it mean now that the nation has not dozens or hundreds but tens of thousands of fracking wells in at least 17 states? What, for example, is the magnitude of the risk those wells present to drinking water? How many iconic landscapes are being damaged? In this report, we have quantified several of the key impacts of fracking on water, air and land, at the state and national level, using the best available sources of information on the extent of fracking and the impacts of fracking on our environment and health. Our analysis shows that damage from fracking is widespread and occurs on a scale unimagined just a few years ago. Moreover, three factors suggest that the total damage from fracking is far worse than we have tabulated here. Severe limitations in available data constrain our ability to see the full extent of the damage. Second, there are broad categories of fracking damage—such as the number of water wells contaminated—that would be difficult to ascertain under any circumstances. Finally, there remain major gaps in the scientific community’s un-derstanding of issues such as the long-term conse-quences of pumping toxic fluids into the ground. Even the limited data that are currently available, however, paint an increasingly clear picture of the damage that fracking has done to our environment and health. It will take decisive action to protect the American people and our environment from the damage caused by dirty drilling. Our analysis shows that damage from fracking is widespread and occurs on a scale unimagined just a few years ago.
- 9. Fracking Poses Grave Threats to the Environment and Public Health Over the past decade, the oil and gas indus-try has used hydraulic fracturing to extract oil and gas from previously inaccessible rock formations deep underground. The use of high-volume hydraulic fracturing—colloquially known as “fracking”—has expanded dramatically from its origins in the Barnett Shale region of Texas a decade ago to tens of thousands of wells nationwide today. Roughly half of U.S. states, stretching from New York to California, sit atop shale or other rock formations with the potential to produce oil or gas using frack-ing. Powder River Mowry Mancos Lewis Forest City Basin 8 Fracking by the Numbers: Key Impacts of Dirty Drilling at the State and National Level (See Figure 1.) Fracking has unleashed a frenzy of oil and gas drilling in several of these shale formations—posing severe threats to the environment and public health. Figure 1. Shale Gas and Oil Plays1 Chattanooga Eagle Ford Western Gulf TX-LA-MS Salt Basin Uinta Basin Devonian (Ohio) Marcellus Utica Bakken*** Avalon- Bone Spring San Joaquin Basin Monterey Santa Maria, Ventura, Los Angeles Basins Monterey- Temblor Pearsall Tuscaloosa Big Horn Basin Denver Basin Basin Park Basin Niobrara* Niobrara* Heath** Manning Canyon Appalachian Basin Antrim Barnett Bend New Albany Woodford Barnett- Woodford Hilliard- Baxter- Mancos Excello- Mulky Fayetteville Floyd- Neal Gammon Cody Haynesville- Bossier Hermosa Pierre Conasauga Michigan Basin Ft. Worth Basin Palo Duro Basin Permian Basin Illinois Basin Anadarko Basin Greater Green River Basin Cherokee Platform San Juan Basin Williston Basin Black Warrior Basin Ardmore Basin Paradox Basin Raton Basin Montana Thrust Belt Marfa Basin Valley & Ridge Province Arkoma Basin Piceance Basin Lower 48 states shale plays Miles ± 0 100 200 300 400 Source: Energy Information Administration based on data from various published studies. Updated: May 9, 2011 Shale plays Basins Stacked plays Basins Current plays Prospective plays * Mixed shale & chalk play ** Mixed shale & limestone play ***Mixed shale & tight dolostone-siltstone- sandstone Shallowest/ youngest Deepest/ oldest Intermediate depth/ age
- 10. Fracking Poses Grave Threats to the Environment and Public Health 9 Contaminating Drinking Water Fracking has polluted both groundwater and surface waterways such as rivers, lakes and streams. Fracking pollution can enter our waters at several points in the process—including leaks and spills of fracking fluid, well blowouts, the escape of methane and other contaminants from the well bore into groundwater, and the long-term migration of contaminants under-ground. Handling of toxic fracking waste that returns to the surface once a well has been fracked presents more opportunities for contamination of drinking water. State data confirm more than 1,000 cases of water contaminated by dirty drilling operations. For example: • In Colorado, approximately 340 of the leaks or spills reported by drilling operators engaged in all types of oil and gas drilling over a five-year period polluted groundwater;2 • In Pennsylvania, state regulators identified 161 instances in which drinking water wells were impacted by drilling operations between 2008 and the fall of 2012;3 and • In New Mexico, state records show 743 instances of all types of oil and gas operations polluting groundwater—the source of drinking water for 90 percent of the state’s residents.4 Spills and Leaks of Fracking Fluids Toxic substances in fracking chemicals and wastewa-ter have been linked to a variety of negative health effects on humans and fish. Chemical components of fracking fluids, for example, have been linked to cancer, endocrine disruption and neurological and immune system problems.5 Wastewater brought to the surface by drilling can contain substances such as volatile organic compounds with potential impacts on human health.6 There are many pathways by which fracking fluids can contaminate drinking water supplies. Spills from trucks, leaks from other surface equipment, and well blowouts can release polluted water to groundwater and surface water. For example, in September 2009 Cabot Oil and Gas caused three spills in Dimock Township, Pennsylvania, in less than a week, dump-ing 8,000 gallons of fracturing fluid components into Stevens Creek and a nearby wetland.7 Leaks of Methane and Other Contaminants from the Well Bore A study by researchers at Duke University found that the proximity of drinking water wells to frack-ing wells increases the risk of contamination of residential wells with methane in Pennsylvania. The researchers pointed to faulty well casing as a likely source.8 Data from fracking wells in Pennsylvania from 2010 to 2012 show a 6 to 7 percent well failure rate due to compromised structural integrity.9 Migration of Contaminants A recent study of contamination in drinking water wells in the Barnett Shale area of North Texas found arsenic, selenium and strontium at elevated levels in drinking water wells close to fracking sites.10 The researchers surmise that fracking has increased pol-lution in drinking water supplies by freeing naturally available chemicals to move into groundwater at higher concentrations or through leaks from faulty well construction. Toxic Fracking Waste The wastewater produced from fracking wells contains pollutants both from fracking fluids and from natural sources underground. It returns to the surface in huge volumes—both as “flowback” im-mediately after fracking and “produced water” over a longer period while a well is producing oil or gas. Yet fracking operators have no safe, sustainable way of dealing with this toxic waste. The approaches that drilling companies have devised for dealing with wastewater can pollute waterways through several avenues.
- 11. • Waste pits can fail. In New Mexico, substances from oil and gas pits have contaminated ground-water at least 421 times.11 Moreover, waste pits also present hazards for nearby wildlife and livestock. For example, in May 2010, when a Pennsylvania fracturing wastewater pit owned by East Resources leaked into a farm field, the state Department of Agriculture was forced to quaran-tine 28 cattle exposed to the fluid to prevent any contaminated meat from reaching the market.12 • Discharge of fracking wastewater into rivers can pollute drinking water supplies. For example, after water treatment plants discharged fracking waste-water into the Monongahela River, local authori-ties issued a drinking water advisory to 350,000 people in the area.13 In addition, fracking waste-water discharged at treatment plants can cause a different problem for drinking water: when bromide in the wastewater mixes with chlorine (often used at drinking water treatment plants), it produces trihalomethanes, chemicals that cause cancer and increase the risk of reproductive or developmental health problems.14 • Drilling companies deliberately spread wastewa-ter 10 Fracking by the Numbers: Key Impacts of Dirty Drilling at the State and National Level on roads and fields. Pollutants from the water can then contaminate local waterways. Drilling operators sometimes spray wastewater on dirt and gravel roads to control dust, or on paved roads to melt ice. In some Western states, frack-ing waste is spread on farmland or used to water cattle.15 • Deep disposal wells are a common destination for fracking waste, but these wells can fail over time, allowing the wastewater and its pollutants to mix with groundwater or surface water.16 For example, Photo: The Downstream Project via SkyTruth/LightHawk. Fracking wastewater is often stored in open waste pits such as these, near Summit, Pennsylvania. Leaks from pits can contaminate drinking water supplies.
- 12. Fracking Poses Grave Threats to the Environment and Public Health 11 wastewater injected into a disposal well contami-nated the Cenozoic Pecos Alluvium Aquifer with 6.2 billion gallons of water near Midland, Texas.17 In Pennsylvania, a disposal well in Bell Township, Clearfield County, lost mechanical integrity in April 2011, but the operator, EXCO Resources, contin-ued to inject fracking wastewater into the well for another five months.18 The U.S. Environmental Protection Agency (EPA) fined the company nearly $160,000 for failing to protect drinking water supplies. Nationally, routine testing of injection wells in 2010 revealed that 2,300 failed to meet mechanical integrity requirements established by the EPA.19 • Pressure from injection wells may cause under-ground rock layers to crack, accelerating the migration of wastewater into drinking water aquifers. For example, at two injection wells in Ohio, toxic chemicals pumped underground in the 1980s, supposedly secure for at least 10,000 years, migrated into a well within 80 feet of the surface over the course of two decades.20 Investi-gators believe that excessive pressure within the injection well caused the rock to fracture, allowing chemicals to escape. Despite the risk presented to drinking water supplies by fracking, the oil and gas industry is seeking to drill near sources of drinking water for millions of people, including George Washington National Forest in Vir-ginia, White River National Forest in Colorado, Otero Mesa in New Mexico, Wayne National Forest in Ohio, and the Delaware River Basin. Consuming Scarce Water Resources Each well that is fracked requires hundreds of thou-sands of gallons of water depending on the shale formation and the depth and length of the horizontal portion of the well. Unlike most industrial uses of wa-ter which return water to the water cycle for further use, fracking converts clean water into toxic waste-water, much of which must then be permanently disposed of, taking billions of gallons out of the water supply annually. Moreover, farmers are particu-larly impacted by fracking water use, as they must now compete with the deep-pocketed oil and gas industry for water, especially in the drought-stricken regions of the country. In some areas, fracking makes up a significant share of overall water demand. In 2010, for example, frack-ing in the Barnett Shale region of Texas consumed an amount of water equivalent to 9 percent of the city of Dallas’ annual water use.21 An official at the Texas Water Development Board estimated that one county in the Eagle Ford Shale region will see the share of water consumption devoted to fracking and similar activities increase from zero a few years ago to 40 percent by 2020.22 Unlike other uses, water used in fracking is permanently lost to the water cycle, as it either remains in the well, is “recycled” (used in the fracking of new wells), or is disposed of in deep injection wells, where it is unavailable to recharge aquifers. Already, demand for water by oil and gas companies has harmed farmers and local communities: • In Texas, water withdrawals by drilling compa-nies caused drinking water wells in the town of Barnhart to dry up. Companies drilling in the Permian Basin have drilled wells and purchased well water drawn from the Edwards-Trinity-Plateau Aquifer, drying up water supplies for residential and agricultural use.23 • Wells that provided water to farms near Carlsbad, New Mexico, have gone dry due to demand for water for drilling and years of low rainfall.24 Competition for limited water resources from frack-ing can increase water prices for farmers and com-munities— especially in arid western states. A 2012 auction of unallocated water conducted by the
- 13. Northern Water Conservation District in Colorado saw gas industry firms submit high bids, with the average price of water sold in the auction increas-ing from $22 per acre-foot in 2010 to $28 per acre-foot in the first part of 2012.25 For the 25,000 acre-feet of water auctioned, this would amount to an added cost of $700,000. Moreover, water pumped from rivers for fracking reduces the quality of the water remaining in the river because pollution becomes more concen-trated. A 2011 U.S. Army Corps of Engineers study of the Monongahela River basin of Pennsylvania and West Virginia, where oil and gas companies withdraw water from the river for fracking, con-cluded that, “The quantity of water withdrawn from streams is largely unregulated and is beginning to show negative consequences.”26 The Corps report noted that water is increasingly being diverted from the relatively clean streams that flow into Corps-maintained reservoirs, limiting the ability of the Corps to release clean water to help dilute pol-lution during low-flow periods.27 It described the water supply in the Monongahela basin as “fully tapped.”28 Excessive water withdrawals undermine the ability of rivers and streams to support wildlife. In Penn-sylvania, water has been illegally withdrawn for fracking numerous times, to the extent of streams being sucked dry. Two streams in southwestern Pennsylvania—Sugarcamp Run and Cross Creek— were reportedly drained for water withdrawals for fracking, triggering fish kills.29 Nationally, nearly half of all fracking wells are lo-cated in regions with very limited water supplies. A study by Ceres, a coalition of business and envi-ronmental interests, found that nearly 47 percent of wells fracked from January 2011 through Sep-tember 2012 were located in areas with “high or extremely high water stress.”30 Endangering Public Health with Air Pollution Air pollution from fracking threatens the health of people living and working close to the wellhead, as well as those far away. Children, the elderly and those with respiratory diseases are especially at risk. Fracking produces air pollution from the well bore as the well is drilled and gas is vented or flared. Emis-sions 12 Fracking by the Numbers: Key Impacts of Dirty Drilling at the State and National Level from trucks carrying water and materials to well sites, as well as from compressor stations and other fossil fuel-fired machinery, also contribute to air pol-lution. Well operations, storage of gas liquids, and other activities related to fracking add to the pollu-tion toll. Making Local Residents Sick People who live close to fracking sites are exposed to a variety of air pollutants including volatile organic compounds (VOCs) such as benzene, xylene and toluene. These chemicals can cause a wide range of health problems—from eye irritation and headaches to asthma and cancer.31 Existing data demonstrate that fracking operations are releasing these pollutants into the air at levels that threaten our health. In Texas, monitoring by the Texas Department of Environmental Quality de-tected levels of benzene—a known cancer-causing chemical—in the air that were high enough to cause immediate human health concern at two sites in the Barnett Shale region, and at levels that pose long-term health concern at an additional 19 sites. Several chemicals were also found at levels that can cause foul odors.32 Air monitoring in Arkansas has also found elevated levels of volatile organic compounds (VOCs)—some of which are also hazardous air pollut-ants— at the perimeter of hydraulic fracturing sites.33 Local air pollution problems have also cropped up in Pennsylvania. Testing conducted by the Pennsylvania Department of Environmental Protection detected components of gas in the air near Marcellus Shale drilling operations.34
- 14. Fracking Poses Grave Threats to the Environment and Public Health 13 Residents living near fracking sites have long suffered from a range of acute and chronic health problems, including headaches, eye irritation, respiratory problems and nausea.35 An investigation by the journalism website ProPublica uncovered numerous reports of illness in western states from air pollution from fracking.36 In Pennsylvania, a homeowner in the town of Carmichaels described how she and her children began to suffer from a variety of symptoms after a compressor station was built 780 feet from her house.37 Pam Judy explained to the nearby Mur-rysville Council that “Shortly after operations began, we started to experience extreme headaches, runny noses, sore/scratchy throats, muscle aches and a con-stant feeling of fatigue. Both of our children are expe-riencing nose bleeds and I’ve had dizziness, vomiting and vertigo to the point that I couldn’t stand and was taken to an emergency room.” Eventually, she con-vinced state officials to test air quality near her home. That testing revealed benzene, styrene, toluene, xylene, hexane, heptane, acetone, acrolein, carbon tetrachloride and chloromethane in the air.38 All indications are that these known stories just scratch the surface of health damage from fracking. In cases where families made sick from fracking have sought to hold drilling companies accountable in court, the companies have regularly insisted on gag orders as conditions of legal settlements—in a recent case even the children were barred from talking about fracking, for life.39 Workers at drilling sites also suffer from health im-pacts. A recent investigation by the National Institute for Occupational Safety and Health (NIOSH) found that workers at some fracking sites may be at risk of lung disease as a result of inhaling silica dust from sand injected into wells. The NIOSH investigation re-viewed 116 air samples at 11 fracking sites in Arkan-sas, Colorado, North Dakota, Pennsylvania and Texas. Nearly half (47 percent) of the samples had levels of silica that exceeded the Occupational Safety and Health Administration’s (OSHA) legal limit for work-place exposure, while 78 percent exceeded OSHA’s recommended limits. Nearly one out of 10 (9%) of the samples exceeded the legal limit for silica by a fac-tor of 10, exceeding the threshold at which half-face respirators can effectively protect workers.40 Over the past few years, health clinics in fracking areas of Pennsylvania have reported seeing a number of patients experiencing illnesses associated with exposure to toxic substances from fracking, all of whom have used false names and paid in cash. David Brown, a toxicologist with the Southwest Pennsylva-nia Environmental Health Project believes that these are mostly fracking workers, who are afraid that any record of their work making them sick will cost them their jobs.41 Regional Air Pollution Threats Fracking also produces a variety of pollutants that contribute to regional air pollution problems. VOCs and nitrogen oxides (NOx) in gas formations contrib-ute to the formation of ozone “smog,” which reduces lung function among healthy people, triggers asthma attacks, and has been linked to increases in school absences, hospital visits and premature death.42 Fracking is a significant source of air pollution in areas experiencing large amounts of drilling. A 2009 study in five Dallas-Fort Worth-area counties experiencing heavy Barnett Shale drilling activity found that oil and gas production was a larger source of smog-forming emissions than cars and trucks.43 In Arkansas, gas pro-duction in the Fayetteville Shale region was estimated to be responsible for 5,000 tons of NOx.44 In Wyoming, pollution from fracking contributed to such poor air quality that, for the first time, the state failed to meet federal air quality standards.45 An analysis conducted for New York State’s revised draft environmental impact statement on Marcellus Shale drilling posited that, in a worst case scenario of widespread drilling and lax emission controls, shale gas production could add 3.7 percent to state NOx emissions and 1.3 per-cent to statewide VOC emissions compared with 2002 emissions levels.46
- 15. Exacerbating Global Warming Global warming is a profound threat to virtually every aspect of nature and human civilization—dis-rupting the functioning of ecosystems, increasing the frequency and violence of extreme weather, and ultimately jeopardizing health, food production, and water resources for Americans and people across the planet. Gas extraction produces enormous volumes of global warming pollution. Fracking’s primary impact on the climate is through the release of methane, which is a far more potent contributor to global warming than carbon dioxide. Over a 100-year timeframe, a pound of methane has 25 times the heat-trapping effect of a pound of car-bon dioxide.47 Methane is even more potent relative to carbon dioxide at shorter timescales, at least 72 times more over a 20-year period. Intentional venting and leaks during the extraction, transmission and distribution of gas release substan-tial amounts of methane to the atmosphere. The U.S. Environmental Protection Agency revised downward its estimate of fugitive methane emissions from fracking in April 2013, citing improved practices by the industry.48 A study conducted with industry cooperation and released in September 2013 found very low fugitive emissions of methane at the wells included in the study, though the findings may not be representative of standard industry practice.49 However, recent air monitoring by researchers at the National Oceanic and Atmospheric Administration and the University of Colorado, Boulder, near a gas and oil field in Colorado revealed fugitive methane emissions equal to 2.3 to 7.7 percent of the gas ex-tracted in the basin, not counting the further losses that occur in transportation.50 Recent aerial sam-pling of emissions over an oil and gas field in Uintah County, Utah, revealed methane emissions equal to 6.2 to 11.7 percent of gas production.51 The global warming impact of fracked natural gas is so great that electricity produced from natural gas may have a greater global warming impact than electricity from coal, especially when evaluated on a short timeline. An analysis by Professor Robert How-arth 14 Fracking by the Numbers: Key Impacts of Dirty Drilling at the State and National Level at Cornell and others found that, on a 20-year timescale, electricity from natural gas is more pollut-ing than electricity from coal.52 Regardless of the fugitive emissions level from fracked gas, increased production of and reliance on gas is not a sound approach to reducing our global warming emissions. Investments in gas production and distribution infrastructure divert financing and efforts away from truly clean energy sources such as energy efficiency and wind and solar power. Gas is not a “bridge fuel” that prepares us for a clean energy future; rather, increasing our use of gas shifts our reli-ance from one polluting fuel to another. Additionally, to the extent that fracking produces oil instead of gas, fracking does nothing to reduce global warming pollution: in fact, refining oil into useable products like gasoline and diesel, and then burning those products, is a huge source of global warming pollution. Damaging America’s Natural Heritage Fracking transforms rural and natural areas into in-dustrial zones. This development threatens national parks and national forests, damages the integrity of landscapes and habitats, and contributes to water pollution problems that threaten aquatic ecosys-tems. Before drilling can begin, land must be cleared of vegetation and leveled to accommodate drilling equipment, gas collection and processing equip-ment, and vehicles. Additional land must be cleared for roads to the well site, as well as for any pipelines and compressor stations needed to deliver gas to market. A study by the Nature Conservancy of frack-ing infrastructure in Pennsylvania found that well pads average 3.1 acres and related infrastructure
- 16. Fracking Poses Grave Threats to the Environment and Public Health 15 damages an additional 5.7 acres.53 Often, this de-velopment occurs on remote and previously undis-turbed wild lands. As oil and gas companies expand fracking activities, national parks, national forests and other iconic land-scapes are increasingly at risk. Places the industry is seeking to open for fracking include: • White River National Forest – Located in Colora-do, this forest draws 9.2 million visitors per year for hiking, camping and other recreation, making it the most visited national forest in the country.54 The forest also hosts 4,000 miles of streams that provide water to several local communities and feed into the Colorado River. • Delaware River Basin – This basin, which spans New Jersey, New York, Pennsylvania and Delaware, is home to three national parks and provides drinking water to 15 million people.55 • Wayne National Forest – Part of Ohio’s beauti-ful Hocking Hills region, most of the acres in the forest are to be leased for drilling near the sole drinking water source for 70,000 people.56 Photo: Peter Aengst via SkyTruth/EcoFlight. Wells and roads built to support fracking in Wyoming’s Jonah gas field have caused extensive habitat fragmentation.
- 17. • George Washington National Forest – This area hosts streams in Virginia and West Virginia that feed the James and Potomac Rivers, which provide the drinking water for millions of people in the Washington, D.C., metro area. • Otero Mesa – A vital part of New Mexico’s natural heritage, Otero Mesa is home to pronghorn antelope and a freshwater aquifer that could be a major source of drinking water in this parched southwestern state.57 The disruption and fragmentation of natural habitat can put wildlife at risk. In Wyoming, for example, extensive gas development in the Pinedale Mesa region has coincided with a significant reduction in the region’s population of mule deer. A 2006 study found that the construction of well pads drove away female mule deer.58 The mule deer population in the area dropped by 50 percent between 2001 and 2011, as fracking in the area continued and accelerated.59 Concerns have also been raised about the impact of gas development on pronghorn antelope. A study by the Wildlife Conservation Society documented an 82 percent reduction in high-quality pronghorn habitat in Wyoming’s gas fields, which have historically been key wintering grounds.60 Birds may also be vulnerable, especially those that depend on grassland habitat. Species such as the northern harrier, short-eared owl, bobolink, upland sandpiper, loggerhead shrike, snowy owl, rough-legged hawk and American kestrel rely on grassland habitat for breeding or wintering habitat.61 These birds typically require 30 to 100 acres of undisturbed grassland for habitat.62 Roads, pipelines and well pads for fracking may fragment grassland into seg-ments too small to provide adequate habitat. The clearing of land for well pads, roads and pipe-lines may threaten aquatic ecosystems by increasing sedimentation of nearby waterways and decreasing shade. A study by the Academy of Natural Sciences of Drexel University found an association between in-creased 16 Fracking by the Numbers: Key Impacts of Dirty Drilling at the State and National Level density of gas drilling activity and degradation of ecologically important headwater streams.63 Water contamination related to fracking has caused several fish kills in Pennsylvania. In 2009, a pipe con-taining freshwater and flowback water ruptured in Washington County, Pennsylvania, triggering a fish kill in a tributary of Brush Run, which is part of a high-quality watershed.64 That same year, in the same county, another pipe ruptured at a well drilled in a public park, killing fish and other aquatic life along a three-quarter-mile length of a local stream.65 Imposing Costs on Communities As with prior extractive booms, the fracking oil and gas rush disrupts local communities and imposes a wide range of immediate and long term costs on them. Ruining Roads, Straining Services As a result of its heavy use of publicly available infra-structure and services, fracking imposes both immedi-ate and long-term costs on taxpayers. The trucks required to deliver water to a single frack-ing well cause as much damage to roads as 3.5 million car journeys, putting massive stress on roadways and bridges not constructed to handle such volumes of heavy traffic. Pennsylvania estimates that repairing roads affected by Marcellus Shale drilling would cost $265 million.66 Fracking also strains public services. Increased heavy vehicle traffic has contributed to an increase in traf-fic accidents in drilling regions. At the same time, the influx of temporary workers that typically accompanies fracking puts pressure on housing supplies, thereby causing social dislocation. Governments respond by increasing their spending on social services and subsi-dized housing, squeezing tax-funded budgets. Governments may even be forced to spend tax money to clean up orphaned wells—wells that were never
- 18. Fracking Poses Grave Threats to the Environment and Public Health 17 properly closed and whose owners, in many cases, no longer exist as functioning business entities. Though oil and gas companies face a legal responsibility to plug wells and reclaim drilling sites, they have a track record of leaving the public holding the bag.67 Risks to Local Businesses, Homeowners and Taxpayers Fracking imposes damage on the environment, pub-lic health and public infrastructure, with significant economic costs, especially in the long run after the initial rush of drilling activity has ended. A 2008 study by the firm Headwaters Economics found that West-ern counties that have relied on fossil-fuel extraction for growth are doing worse economically than their peers, with less-diversified economies, a less-educat-ed workforce, and greater disparities in income.68 Other negative impacts on local economies include downward pressure on home values and harm to farms. Pollution, stigma and uncertainty about the future implications of fracking can depress the prices of nearby properties. One Texas study found that homes valued at more than $250,000 and located within 1,000 feet of a well site lost 3 to 14 percent of their value.69 Fracking also has the potential to affect agriculture, both directly through damage to live-stock from exposure to fracking fluids, and indirectly through economic changes that undermine local agricultural economies. Fracking can increase the need for public invest-ment in infrastructure and environmental cleanup. Fracking-related water demand may also lead to calls for increased public spending on water infrastruc-ture. Texas, for example, adopted a State Water Plan in 2012 that calls for $53 billion in investments in the state water system, including $400 million to address unmet needs in the mining sector (which includes hydraulic fracturing) by 2060.70 Fracking is projected to account for 42 percent of water use in the Texas mining sector by 2020.71 The cost of cleaning up environmental damage from the current oil and gas boom may fall to taxpayers, as has happened with past booms. For example, as of 2006, more than 59,000 orphan oil and gas wells were on state waiting lists for plugging and remedia-tion across the United States, with at least an ad-ditional 90,000 wells whose status was unknown or undocumented.72 Texas alone has more than 7,800 orphaned oil and gas wells.73 These wells pose a con-tinual threat of groundwater pollution and have cost the state of Texas more than $247 million to plug.74 The current fracking boom ultimately may add to this catalog of orphaned wells. Threatening Public Safety Fracking harms public safety by increasing traffic in rural areas where roads are not designed for such high volumes, by creating an explosion risk from methane, and by increasing earthquake activity. Increasing traffic—especially heavy truck traffic—has contributed to an increase in traffic accidents and fa-talities in some areas in which fracking has unleashed a drilling boom, as well as an increase in demands for emergency response. In the Bakken Shale oil region of North Dakota for example, the number of high-way crashes increased by 68 percent between 2006 and 2010, with the share of crashes involving heavy trucks also increasing over that period.75 A 2011 survey by StateImpact Pennsylvania in eight counties found that 911 calls had increased in seven of them, with the number of calls increasing in one county by 49 percent over three years, largely due to an in-crease in incidents involving heavy trucks.76 Methane contamination of well water poses a risk of explosion if the gas builds up inside homes. In both Ohio and Pennsylvania, homes have exploded after high concentrations of methane inside the buildings were ignited by a spark.77
- 19. Another public safety hazard stems from earth-quakes triggered by injection wells. For example, on New Year’s Eve in 2011—shortly after Ohio began accepting increasing amounts of wastewater from Pennsylvania—a 4.0 earthquake shook Youngstown, Ohio. Seismic experts at Columbia University de-termined that pumping fracking wastewater into a nearby injection well caused the earthquake.78 Earthquakes triggered by injection well wastewater disposal have happened in Oklahoma, Arkansas, Texas, Ohio and Colorado. The largest quake—a mag-nitude 5.7 temblor in Oklahoma that happened in 2011—injured two people, destroyed 14 homes and buckled highways. People felt the quake as far as 800 miles away.79 As fracking wastewater volumes have increased dramatically since 2007, the number of earthquakes in the central United States, where injection well dis-posal is common, has increased by more than 1,100 percent compared to earlier decades.80 Scientists at the U.S. Geological Survey have concluded that humans are likely the cause.81 After reviewing data on the Oklahoma quake, Dr. Geoffrey Abers, a seis-mologist at the Lamont-Doherty Earth Observatory, concluded that, “the risk of humans inducing large earthquakes from even small injection activities is probably higher” than previously thought.82 18 Fracking by the Numbers: Key Impacts of Dirty Drilling at the State and National Level
- 20. Quantifying the State and National Impacts of Fracking Quantifying the State and National Impacts of Fracking 19 Fracking imposes numerous costly impacts on our environment and public health. This report seeks to estimate several key impacts of fracking for oil and gas, with a primary focus on high-volume fracking. There have been few, if any, efforts to quantify the cumulative impacts of fracking at a state or national scale. The task is made difficult, in part, by differing definitions and data collection practices for uncon-ventional drilling used in the states. These variations in data make it difficult to isolate high-volume fracking from other practices. To address this challenge, we collected data on unconventional drilling targets (shale gas, shale oil, and tight-gas sands) and practices (horizontal and directional drilling) to ensure the comprehensiveness of the data. Where possible, we then narrowed the data to include only those wells using high-volume hydraulic fracturing involving more than 100,000 gallons of water. Photo: The Downstream Project via SkyTruth/LightHawk. More than 6,000 shale gas/liquids wells, such as this well site in Tioga County, have been drilled in Pennsylvania since 2005.
- 21. The data presented in the following sections come from multiple sources, including state databases, estimates from knowledgeable state employees, and information provided by oil and gas companies to a national website. As a result, the quality of the data varies and figures may not be directly comparable from state to state. Nonetheless, the numbers paint an initial picture of the extensive environmental and public health damage from fracking. Wells Fracked by State The most basic measure of fracking’s scope is a tally of how many fracking wells have been drilled. In addition, having an accurate count of wells by state offers a basis for estimating specific impacts to water, air and land. Fracking has occurred in at least 17 states (see Table 1), affecting approximately 82,000 wells. In the eastern U.S., Pennsylvania reports the most fracking wells since 2005, with 6,651 wells tapping into the Marcellus and Utica shales. More than 5,000 fracking wells have been drilled in North Dakota to produce oil from the Bakken formation. Western states with the most fracking include Colorado, New Mexico and Utah. Absent policies to rein in fracking, fracking is likely to expand in these and other states. Tennessee cur-rently Table 1. Estimate of Fracking Wells83 20 Fracking by the Numbers: Key Impacts of Dirty Drilling at the State and National Level has a handful of wells but more will soon be fracked in the Cumberland Forest.84 One test well was fracked in Georgia in the past year.85 Illinois recently adopted new regulations governing fracking, paving the way for the practice there.86 Oil and gas compa-nies are seeking to expand to states such as Califor-nia, New York, Maryland and North Carolina where there has been no such activity to date. In New York, as many as 60,000 wells could be drilled.87 Wastewater Produced One of the more serious threats fracking poses to drinking water is the millions of gallons of toxic wastewater it generates. While there are many ways in which fracking can contaminate drinking water—including but not lim-ited to spills of fracking fluid, well blowouts, leaks of methane and other contaminants from the well bore into groundwater, and the possible eventual migra-tion of fluids from shale to the water table—one of the most serious threats comes from the millions of gallons of toxic wastewater fracking generates. State Fracking Wells since 2005 Fracking Wells Drilled in 2012 Arkansas 4,910 719 Colorado 18,168 1,896 Kansas 407 236 Louisiana 2,327 139 Mississippi 9 Unavailable Montana 264 174 New Mexico 1,353 482 North Dakota 5,166 1,713 Ohio 334 234 Oklahoma 2,694 Unavailable Pennsylvania 6,651 1,349 Tennessee 30 Unavailable Texas 33,753 13,540 Utah 1,336 765 Virginia 95 1 West Virginia* 3,275 610 Wyoming 1,126 468 TOTAL 81,898 22,326 “Unavailable” means information was not available to determine when wells were drilled. See methodology for complete details. * Data for West Virginia is for permitted fracking wells, not wells that have been drilled. Data were not available on drilled wells.
- 22. Quantifying the State and National Impacts of Fracking 21 Table 2 shows how much wastewater has been pro-duced from fracking wells in selected states. In some states, such as New Mexico, North Dakota, Ohio, Penn-sylvania and Utah, well operators submit regular reports on the volume of wastewater, oil and gas produced from their wells. In some states where operators do not report wastewater volumes, we estimated wastewater volumes using state-specific data as described in the methodology. These estimates are for wastewater only, and do not include other toxic wastes from fracking, such as drilling muds and drill cuttings. The rapid growth of fracking has caused wastewater volumes to increase rapidly. In the Marcellus Shale underlying Pennsylvania, West Virginia and Ohio, for example, wastewater production increased six-fold from 2004 to 2011.89 In 2012 alone, fracking in Pennsylvania produced 1.2 billion gallons of wastewater, almost as much as was produced in a three-year period from 2009 to 2011.90 Table 2. Wastewater from Fracking in 201288 State Wastewater Produced (million gallons) Arkansas 800 Colorado 2,200 Kansas No estimate Louisiana No estimate Mississippi* 10 Montana 360 New Mexico 3,000 North Dakota** 12,000 Ohio 30 Oklahoma No estimate Pennsylvania 1,200 Tennessee No estimate Texas 260,000 Utah 800 Virginia No estimate West Virginia No estimate Wyoming No estimate TOTAL 280,000 * Data for Mississippi are for 2012-2013. ** Data for North Dakota are cumulative to early 2013. Fracking wastewater is disposed into Class II injection wells in Ohio. “Receiving” wells currently accept fracking wastewater. “Non-receiving” wells are those wells that could receive fracking wastewater but haven’t to date. Data mapped by the FracTracker Alliance on Frac- Tracker.org. Original data source: Bulk Transporter Magazine, accessed at www.fractracker.org/2013/06/oh-waste- network, 23 July 2013.
- 23. This huge volume of polluted wastewater creates many opportunities for contaminating drinking water. More wells and more wastewater increase the odds that the failure of a well casing or gasket, a wastewater pit or a disposal well will occur and that drinking water supplies will be contaminated. Moreover, as the sheer volume of wastewater generated exceeds local disposal capacity, drilling operators are increasingly looking to neighbor-ing states as convenient dumping grounds. For example, in 2011, more than 100 million gallons of Pennsylvania’s fracking waste were trucked to Ohio for disposal into underground injection wells.91 (See map of Ohio disposal wells.) As the volume of this toxic waste grows, so too will the likelihood of illegal dumping. For example, in 2013 Ohio authorities discovered that one drilling waste operator had dumped thousands of gallons of fracking wastewater into the Mahoning River.92 And in Pennsylvania, prosecutors recently charged a different company with dumping fracking waste.93 For other industries, the threats posed by toxic waste have been at least reduced due to the adop-tion of the federal Resource Conservation Recovery Act (RCRA), which provides a national framework for regulating hazardous waste. Illegal dumping is reduced by cradle-to-grave tracking and criminal penalties. Health-threatening practices such as open waste pits, disposal in ordinary landfills, and road spreading are prohibited. However, waste from oil and gas fracking is exempt from the haz-ardous waste provisions of RCRA—exacerbating the toxic threats posed by fracking wastewater. Chemicals Used Fracking fluid consists of water mixed with chemicals that is pumped underground to frack wells. Though in percentage terms, chemicals are a small compo-nent 22 Fracking by the Numbers: Key Impacts of Dirty Drilling at the State and National Level of fracking fluid, the total volume of chemicals used is immense. The oil and gas industry estimates that 99.2 percent of fracking fluid is water (by volume) and the other 0.8 percent is a mix of chemicals.94 Assuming that this percentage is correct and has held true since 2005, that means oil and gas companies have used 2 billion gallons of chemicals. These chemicals routinely include toxic substances. According to a 2011 congressional report, the toxic chemicals used in fracking include methanol, glutar-aldehyde, ethylene glycol, diesel, naphthalene, xy-lene, hydrochloric acid, toluene and ethylbenzene.95 More recently, an independent analysis of data sub-mitted by fracking operators to FracFocus revealed that one-third of all frack jobs reported there use at least one cancer-causing chemical.96 These toxic sub-stances can enter drinking water supplies from the well, well pad or in the wastewater disposal process. Water Used Since 2005, fracking has used at least 250 billion gal-lons of water across the nation. Extrapolating from industry-reported figures on water use at more than 36,000 wells since 2011, we estimated total water use for all wells that were fracked from 2005 through mid-2013. (See Table 3.) The greatest total water consumption occurred in Texas, at the same time the state was struggling with extreme drought. Other states with high water use include Pennsylvania, Arkansas and Colorado. The amount of water used for fracking in Colorado was enough to meet the water needs of nearly 200,000 Denver households for a year.97
- 24. Air Pollution Created Fracking created hundreds of thousands of tons of air pollu-tion in 2012. As shown in Table 4, well-site operations during drilling and well completion generated approximately 450,000 tons of health-threatening air pollution. And that does not even include the significant emissions from ongo-ing operations, compressors, waste pits and truck traffic to and from drilling sites carrying supplies and personnel. This air pollution estimate for all wells is based on emis-sions figures from wells in the Marcellus Shale. Different drilling targets and practices may lead to different results.99 Additional research and improved data availability will help clarify the amount of pollution occurring in different regions. The 2012 NOx emissions from the early stages of fracking in Colorado were equal to 27 percent of the NOx produced by power plants in the state, assuming fracking well emissions rates were similar to those in the Marcellus.100 In Pennsyl-vania, fracking produced NOx equal to 7 percent of that emitted in 2011 by electricity generation, a major source of smog-forming emissions. Table 4. Estimated Air Pollution Produced from Early Stages of Fracking (Drilling and Well Completion) in 2012 (tons) State Particulate Matter NOx Carbon Monoxide VOCs Sulphur Dioxide Arkansas 400 5,300 8,100 700 20 Colorado 1,100 14,000 21,000 2,000 50 Kansas 100 1,700 2,700 200 6 Louisiana 80 1,000 1,600 100 3 Mississippi Unavailable Unavailable Unavailable Unavailable Unavailable Montana 100 1,300 2,000 200 4 New Mexico 300 3,600 5,400 500 10 North Dakota 1,000 13,000 19,000 2,000 40 Ohio 100 1,700 2,600 200 6 Oklahoma Unavailable Unavailable Unavailable Unavailable Unavailable Pennsylvania 800 10,000 15,000 1,000 30 Tennessee Unavailable Unavailable Unavailable Unavailable Unavailable Texas 7,800 100,000 153,000 14,000 300 Utah 400 5,700 9,000 1,000 20 Virginia 1 7 11 1 0 West Virginia 400 4,500 6,900 600 20 Wyoming 270 3,500 5,300 500 12 TOTAL 13,000 170,000 250,000 23,000 600 Quantifying the State and National Impacts of Fracking 23 Table 3. Water Used for Fracking98 State Total Water Used since 2005 (million gallons) Arkansas 26,000 Colorado 26,000 Kansas 670 Louisiana 12,000 Mississippi 64 Montana 450 New Mexico 1,300 North Dakota 12,000 Ohio 1,400 Oklahoma 10,000 Pennsylvania 30,000 Tennessee 130 Texas 110,000 Utah 590 Virginia 15 West Virginia 17,000 Wyoming 1,200 TOTAL 250,000
- 25. Global Warming Pollution Released Completion of fracking wells produced global warm-ing pollution of 100 million metric tons of carbon dioxide equivalent from 2005 to 2012, equal to emis-sions from 28 coal-fired power plants in a year.101 Using the data on the number of fracking wells, we estimated emissions from well completion using an emissions rate from a recent study by researchers at MIT. The researchers calculated that the average fracked shale gas well completed in 2010 released 110,000 pounds of methane during the first nine days of operation.102 The researchers assumed that 70 percent of wells were operated with equipment to limit emissions, that 15 percent of wells flared gas, and that 15 percent of wells vented gas. Their calcu-lations did not include methane emissions after the first nine days, such as during processing, transmis-sion and distribution, nor did they include carbon di-oxide emissions from trucks and drilling equipment. We used data on the number of wells fracked since 2005 (as presented in Table 1 in “Estimate of Frack-ing Wells ”) to estimate methane emissions. Table 5 presents estimated emissions from completion of fracking wells from 2005 to 2012. In Texas, emissions from completion of fracking wells since 2005 are equal to those produced by 12 coal-fired power plants in a year.103 Completion of wells in Pennsylvania produced emissions equal to the pollu-tion from 1.7 million passenger vehicles in a year.104 This estimate of emissions from well completion is both incomplete and includes several points of uncertainty. First and foremost, it does not include emissions from ongoing operation of wells. Sec-ond, in states where regulators do not have a firm estimate of the number of fracking wells, such as in Colorado and Texas, our conservative estimate of the number of fracking wells results in an underestimate of emissions. Introducing uncertainty, this estimate treats all wells as if they were the same and have the Table 5. Global Warming Pollution from Completion of Fracking Wells State Based on Well Completion from 2005 to 2012 (metric tons of carbon dioxide-equivalent) Arkansas 6,200,000 Colorado 23,000,000 Kansas 500,000 Louisiana 2,900,000 Mississippi 11,000 Montana 300,000 New Mexico 1,700,000 North Dakota 6,500,000 Ohio 420,000 Oklahoma 3,400,000 Pennsylvania 8,300,000 Tennessee No estimate Texas 40,000,000 Utah 1,700,000 Virginia 120,000 West Virginia 4,100,000 Wyoming 1,400,000 TOTAL 100,000,000 same emissions. In reality, some wells produce gas, some produce oil, and some wells produce gas that requires additional processing.105 Finally, even those states that track the number of fracking wells typi-cally 24 Fracking by the Numbers: Key Impacts of Dirty Drilling at the State and National Level don’t track well type. We believe this estimate of emissions from well completions understates total emissions from frack-ing wells. To compare this estimate of emissions from well completion to an estimate from ongoing emissions and to avoid the problem of uncertainty regarding emissions by well type, we estimated emis-sions based on gas production for a few states.
- 26. Quantifying the State and National Impacts of Fracking 25 Researchers at Cornell have studied emissions from fracking in five unconventional gas formations.106 The researchers estimated the methane emissions released from multiple steps in the fracking pro-cess— drilling, fracking and processing—and calcu-lated emissions as a percentage of produced gas.107 Using estimates of gas production by state, where available, we calculated statewide global warming pollution from fracking. For the two states where we have complete production data—Pennsylvania and North Dakota—the production-based emis-sions estimate is higher than the estimate based on the number of completed wells. Using our production-based method, Pennsylva-nia, North Dakota and Colorado had the highest emissions. Pennsylvania produced the most global warming pollution from fracking for gas. In 2012, the state created 24 million metric tons of carbon dioxide-equivalent, as much pollution as produced by seven coal-fired power plants or 5 million pas-senger vehicles.108 Acres of Land Damaged Nationally, land directly damaged for fracking totals 360,000 acres. (See Table 6.) This estimate includes the amount of land that has been cleared for roads, well sites, pipelines and related infrastructure in each state. However, the total amount of habitat and land-scape affected by fracking is much greater. In trea-sured open spaces, a single well-pad can mar a vista seen from miles around. A study of fracking develop-ment in Pennsylvania estimated that forest fragmen-tation affected more than twice as much land as was directly impacted by development.109 Fracking activity in Colorado damaged 57,000 acres, equal to one-third of the acreage in the state’s park system.110 In Pennsylvania, the amount of land directly affected by fracking-related development since 2005 is equal to all the farmland protected since 1999 through the state’s Growing Greener land preservation program.111 Storage tanks can be a significant source of fugitive methane emissions. Table 6. Land Damaged for Fracking112 State Acres Damaged since 2005 Arkansas 24,000 Colorado 57,000 Kansas No estimate Louisiana No estimate Mississippi No estimate Montana 230 New Mexico 8,900 North Dakota 50,000 Ohio 1,600 Oklahoma 22,000 Pennsylvania 33,000 Tennessee No estimate Texas 130,000 Utah 9,000 Virginia 460 West Virginia 16,000 Wyoming 5,000 TOTAL 360,000 Photo: Gerry Dincher/Flickr.
- 27. In the years to come, fracking may affect a much bigger share of the landscape. According to a recent analysis by the Natural Resources Defense Council, 70 of the nation’s largest oil and gas companies have leases to 141 million acres of land, bigger than the combined areas of California and Florida.113 More- 26 Fracking by the Numbers: Key Impacts of Dirty Drilling at the State and National Level Photo: ©Dennis Dimick/Flickr. A grid of drilling sites and roads, similar to those used in fracking, lies across the landscape near Odessa, Texas. over, as noted earlier in this report, the oil and gas industry is seeking access to even more acres of land for fracking—including areas on the doorsteps of our national parks, and inside our national forests—some of which contain sources of drinking water for mil-lions of Americans.
- 28. Policy Recommendations 27 Policy Recommendations As evidenced by the data in this report, frack-ing is causing extensive damage to the en-vironment and public health in states across the country. States as disparate as Colorado, North Dakota, Pennsylvania and Texas suffer from air pol-lution, water pollution, habitat disruption and water depletion caused by widespread fracking. Wherever fracking has occurred, it has left its mark on the envi-ronment and our well-being. Fracking has additional impacts not documented in this report. Environmental damage includes water pollution from spills of fracking fluids and methane leaks into groundwater, as well as air pollution from toxic emissions that causes both acute and chronic health problems for people living near wells. Eco-nomic and social damage includes ruined roads and damage to farm economies. The scale of this threat is growing almost daily, with thousands of new wells being added across the nation each year. Given the scale and severity of fracking’s myriad impacts, constructing a regulatory regime sufficient to protect the environment and public health from dirty drilling—much less enforc-ing such safeguards at more than 80,000 wells, plus processing and waste disposal sites across the coun-try— seems implausible at best. In states where fracking is already underway, an im-mediate moratorium is in order. In all other states, banning fracking is the prudent and necessary course to protect the environment and public health. • At a minimum, state officials should allow cities, towns and counties to protect their own citizens through local bans and restrictions on fracking. • Moreover, states bordering on the fracking boom should also bar the processing of fracking waste so that they will not become dumping grounds for fracking operations next door. Vermont has already banned fracking and its waste, and similar proposals are under consideration in other states. Where fracking is already happening, the least we should expect from our government is to reduce the environmental and health impacts of dirty drill-ing as much as possible, including: • The federal government should close the loopholes that exempt fracking from key provi-sions of our federal environmental laws. For example, fracking wastewater, which often contains cancer-causing and even radioactive material, is exempt from our nation’s hazardous waste laws. • Federal and state governments should protect treasured open spaces and vital drinking water supplies from the risks of fracking. In 2011, the Obama administration’s science advisory panel on fracking recommended the “[p]reservation of unique and/or sensitive areas as off limits to drill-ing and support infrastructure.”114 In keeping with this modest directive, dirty fracking should not be allowed near our national parks, national forests or in watersheds that supply drinking water.
- 29. • Policymakers should end worst practices. Frack-ing operators should no longer be allowed to use open waste pits for holding wastewater. The use of toxic chemicals should not be allowed in fracking fluids. Operators should be required to meet aggressive water use reduction goals and to recycle wastewater. To ensure that the oil and gas industry—rather than taxpayers, communities or families—pays the costs of fracking damage, states and the Bureau of Land Management should require robust financial assur-ance from operators at every well site. While we conclude that existing data alone is suf-ficient 28 Fracking by the Numbers: Key Impacts of Dirty Drilling at the State and National Level to make the case against fracking, additional data will provide a more complete picture and is critical for local communities and residents to as-sess ongoing damage and liability where fracking is already occurring. As this report revealed, data available on fracking are inconsistent, incomplete and difficult to analyze. To remedy this, oil and gas companies should be required to report all fracking wells drilled, all chemicals used, amount of water used, and volume of wastewater produced and toxic substances therein. Reporting should occur into an accessible, national database, with chemical use data provided 90 days before drilling begins.
- 30. Methodology 29 Methodology This report seeks to estimate the cumulative impacts of fracking for oil and gas in the United States. We attempted to limit the scope of the data included in the report to wells using high-volume hydraulic fracturing with hori-zontal drilling, because that new technology has the greatest environmental impacts and its use is in-creasing rapidly. However, the definition of and data collection practices for unconventional drilling vary significantly from state to state, making it difficult— and in some cases impossible—to limit our study only to those wells that have been developed using high-volume fracking. To ensure that our estimates included the most comprehensive data possible, we began by collect-ing— largely from state oil and gas regulators, as de-scribed below—data on all unconventional drilling targets and practices (excluding acidization). Where possible, we then narrowed the data to include only those wells using high-volume hydraulic fracturing involving more than 100,000 gallons of water and/ or horizontal drilling. In many states, the information needed to identify these wells was lacking. In those states, we included all wells using unconventional drilling practices in the data. In the section “Number of Wells, Wastewater and Produced Gas,” we explain what types of drilling are included in the data for each state. For data on water use and for teasing apart state data on conventional and unconventional wells, we relied heavily on the work done by SkyTruth to make data reported by the fracking industry more accessible. Oil and gas drilling companies report some of their fracking activities to the FracFocus website, provid-ing information on individual wells in separate PDF files. SkyTruth compiles these individual PDFs and ex-tracts the data “as is,” placing the data into a standard machine-readable database that can be downloaded and analyzed. We downloaded SkyTruth’s Fracking Chemical Database from frack.skytruth.org/fracking-chemical- database/frack-chemical-data-download on 12 June 2013. References below to SkyTruth data or API numbers from SkyTruth refer to this database. The data we were able to collect undercounts the scope of fracking and its damage, for several reasons. First, when the data were unclear, we made conser-vative assumptions and chose conservative method-ologies. Second, the FracFocus data we drew upon for some of our calculations are incomplete (see text box “Problems with FracFocus Data”). Our analysis does not include data from several states where fracking is a subject of policy debates, including Michigan and California. In those states, the data show that little to no fracking has occurred using high volumes of water because oil and gas companies have not yet begun to combine horizon-tal drilling with fracking. In these states, hydraulic fracturing has taken place in vertical wells, which require far less water.
- 31. Problems with FracFocus Data Data collected on the FracFocus website have several limitations: FracFocus does not include all fracking wells in the nation, the data that are provided can be of poor quality, and loopholes in reporting requirements enable companies to hide some information. The FracFocus website does not include data on all fracking wells. The website came into operation in 2011, after thousands of wells had already been fracked and in most cases operators have not retroactively entered information on older wells. Furthermore, in many states, reporting to FracFocus is voluntary and therefore the website does not cover all wells fracked since 2011. Only Colorado, Louisiana, Montana, New Mexico, North Dakota, Oklahoma, Pennsylvania, Texas and Utah require reporting to FracFocus.115 In most of those states, however, the reporting requirement was adopted in 2012 or later and therefore not all earlier fracking activity is included on FracFocus. Table 7. FracFocus Contains an Incomplete Count of Fracking Wells (Using More than 100,000 Gallons of Water) Count from FracFocus Count Based on State Data State Fracking Wells since 2005 Fracking Wells in 2012 30 Fracking by the Numbers: Key Impacts of Dirty Drilling at the State and National Level Fracking Wells since 2005 Fracking Wells in 2012 Arkansas 1,461 611 4,910 719 Colorado 4,996 2,308 18,168 1,896 Kansas 150 108 407 236 Louisiana 1,078 346 2,327 139 Mississippi 5 3 9 Unavailable Montana 264 174 264 174 New Mexico 916 515 1,353 482 North Dakota 2,654 1,653 5,166 1,713 Ohio 156 121 334 234 Oklahoma 2,097 1,270 2,694 Unavailable Pennsylvania 2,668 1,295 6,651 1,349 Tennessee 2 0 30 Unavailable Texas 16,916 9,893 33,753 13,540 Utah 1,336 765 1,336 765 Virginia 5 3 95 1 West Virginia 280 170 3,275 610 Wyoming 1,126 468 1,126 468 TOTAL 36,457 19,923 81,898 22,326 We compared the data we collected from states with the data included in FracFocus. SkyTruth’s database of FracFocus data contains records for approximately 36,000 unique wells that used more than 100,000 gallons of water. Based on data we collected directly from states, we tallied more than 80,000 wells from the beginning of 2005 through mid-2013. Table 7 shows the state-by-state differences between our figures and those derived from FracFocus.
- 32. Further evidence of how much data are missing from FracFocus comes from a comparison of water use in all Texas wells reported to FracFocus by individual oil and gas companies versus water use calculated for the Texas Oil & Gas Association. This comparison shows that the figures in FracFocus in 2011 might be 50 percent too low. According to Jean-Philippe Nicot, et al., for the Texas Oil & Gas Association, Oil & Gas Water Use in Texas: Update to the 2011 Mining Water Use Report, September 2012, fracking used 81,500 acre-feet of water in Texas in 2011 and consumed 68,400 acre-feet. In contrast, the data from SkyTruth’s compilation of FracFocus data suggest total use was 46,500 acre-feet in 2011. Reporting by Texas operators was voluntary at this point, and in 2011 only half of Texas wells were reported to FracFocus, according to Leslie Savage, Chief Geologist, Oil and Gas Division of the Texas Railroad Commission, personal communication, 20 June 2013. Second, the quality and scope of the data are inconsistent. Typographical errors and incorrect chemical identifying numbers mean some of the data are unusable. Finally, companies are not required to report all the chemicals they use in the fracking process. Through a trade-secrets exemption, drilling companies can mask the identities of chemicals. In some states, up to 32 percent of the chemicals used are not disclosed because companies claim they are trade secrets, per SkyTruth, SkyTruth Releases Fracking Chemical Database, 14 November 2012. Methodology 31 Number of Wells, Wastewater and Produced Gas We obtained most of our data on a state by state basis for the number of wells, the amount of waste-water produced, and the amount of gas produced. Arkansas Data on well completions in Arkansas came from Arkansas Oil and Gas Commission, Fayetteville Well Completion Report, downloaded from www.aogc2. state.ar.us/FayettevilleShaleInfo/regularly%20up-dated% 20docs/B-43%20Field%20-%20Well%20 Completions.pdf, 4 June 2013. Essentially all these wells are fracked, per James Vinson, Webmaster, Little Rock Office, Arkansas Oil & Gas Commission, personal communication, 4 June 2013. We included wells with no date listed for “Date of 1st Prod” when they had other remarks indicating they were drilled in the past few years. Our calculation of the volume of flowback and pro-duced water in Arkansas is based on a finding in J.A. Veil, Environmental Science Division, Argonne National Laboratory, for the U.S. Department of Energy, Office of Fossil Energy, National Energy Technology Labora-tory, Water Management Practices Used by Fayetteville Shale Gas Producers, June 2011. Veil reports that one producer in the Fayetteville Shale estimates that “the combined return volume of flowback water and subsequent produced water for the Fayetteville shale is … about 25%.” We multiplied this by data on water consumed to frack Fayetteville shale wells in 2012. Colorado Colorado does not track fracking wells separately from other oil and gas wells. To estimate the number of fracking wells in the state, we counted the number of wells in Weld, Boulder, Garfield and Mesa counties with spud dates of 2005 or later. Data on well comple-tions came from Colorado Oil and Gas Conservation
- 33. Commission, 2013 Production Summary, accessed at cogcc.state.co.us/, 3 September 2013, and guidance on which counties to include came from Diana Burn, Eastern Colorado Engineering Supervisor, Colorado Oil and Gas Commission, personal communication, 4 September 2013. Many wells in Weld and Boulder counties use fracking to tap the Niobrara and Codell formations, while wells in Garfield and Mesa counties target the Piceance Basin. We excluded wells from all other counties because those wells use lower vol-umes of water due to shallower wells, foam fracking, or recompletion of existing wells. Our estimate of gas production and produced water volumes came from Colorado Oil and Gas Conserva-tion Commission, 2012 Annual Production Summary (Access database), downloaded 25 June 2013. We selected for gas and water production data from all wells drilled in Weld, Garfield, Boulder and Mesa counties since 2005 as described above. Kansas We obtained data on all horizontal wells from Kan-sas Geological Survey, Oil and Gas Well Database, accessed at chasm.kgs.ku.edu, 30 May 2013. We counted only those wells with a listed spud date. We were unable to obtain an estimate of wastewater produced. Louisiana We obtained data on shale wells drilled in the Haynesville formation from Louisiana Department of Natural Resources, Haynesville Shale Wells (spread-sheet), updated 13 June 2013. We counted only those wells with a spud date. The majority of fracking in Louisiana is occurring in the Haynesville shale, per Michael Peikert, Manager, Environmental Section of Engineering Division at the Department of Natural Resource’s Office of Conservation, personal commu-nication, early June 2013. Data on produced water are not available in Louisiana. Mississippi Mississippi began requiring permits for fracking wells only in March 2013. Therefore, we used data provid-ed 32 Fracking by the Numbers: Key Impacts of Dirty Drilling at the State and National Level to FracFocus by oil and gas companies involved in fracking. We used the “Find a Well” function on the FracFocus website to search for wells in Mississippi as of 18 June 2013. Reporting to the FracFocus website is voluntary for companies in Mississippi, so the website likely undercounts fracking wells in the state. Monthly data on produced water are available well by well from the Mississippi Oil and Gas Board’s website (http://gis.ogb.state.ms.us/MSOGBOnline/) using individual API numbers. We looked up three wells, one of which has been abandoned, and used the volume of produced water to calculate a state average. Montana Our count of fracking wells came from the FracFocus database. We screened for wells that reported using more than 100,000 gallons of water, and counted 264 wells. This estimate is conservative. A tally of new horizon-tal and recompleted horizontal wells in Montana Board of Oil and Gas Conservation, Horizontal Well Completion Count, accessed at www.bogc.dnrc. mt.gov, 29 May 2013 turned up 1,052 wells, which may include some coalbed methane wells. To obtain an estimate of produced water, we down-loaded the list of API numbers in Montana reported to FracFocus and compiled by SkyTruth. We provided that list of API numbers, which started in 2011, to Jim Halvorson, Petroleum Geologist, Montana Board of Oil and Gas, who queried the state’s database for all produced water reports associated with those API numbers in a spreadsheet on 27 June 2013. We summed the produced water figures for the 12-month period ending 31 May 2013.
- 34. Methodology 33 New Mexico We calculated the total number of fracking wells in New Mexico in two different ways and chose to use the lower estimate to be conservative. We counted 1,353 fracking wells by downloading a list of all permitted wells in the state from New Mexico Energy, Minerals and Natural Resources Department, Oil Conservation Division, OCD Data and Statistics, 12 June 2013. We selected all wells with an “H” (for hydraulically fractured) at the end of the well name, per a conversation with Phillip Goe-tze, New Mexico Oil Conservation Division, 25 June 2013. We further screened the wells to include just those with a status of “Active,” “Plugged” or “Zone Plugged.” We included wells that were identified as “New (Not drilled or compl)” if those records other-wise contained information suggesting the well has been completed (by listing days in production in 2011, 2012, or 2013). This count included a few wells started before 2005. We counted 1,803 fracking wells by reviewing the list of hydraulic fracturing fluid disclosure forms submit-ted by drillers for approval before fracking a well. We obtained the list from New Mexico Oil Conservation Division, Action Status Permitting Database, 13 June 2013. The requirement to submit these forms began in 2012, so this count doesn’t include wells from 2011 and earlier. This approach was based on a conversa-tion with Laurie Hewig, Administrative Bureau Chief, New Mexico Oil Conservation Division, 13 June 2013. To estimate produced water, we used water produc-tion data reported in New Mexico Energy, Minerals and Natural Resources Department, Oil Conservation Division, OCD Data and Statistics, 12 June 2013, and filtered as described above. We obtained gas produc-tion figures in the same manner. North Dakota We obtained data on fracking wells in North Dakota from North Dakota Oil and Gas Division, Bakken Hori-zontal Wells by Producing Zone, accessed at www.dmr. nd.gov, 29 May 2013. We assumed that all horizontal wells are fracked and that all fracking in the state happens in the Bakken Shale. We obtained data on produced water from this same data source. Howev-er, reported production data are cumulative by well and we could not calculate production by all fracking wells over a one-year period. Therefore, our tally of water includes multiple years of production. Data on gas production from fracking wells comes from North Dakota Industrial Commission, Depart-ment of Mineral Resources, North Dakota Monthly Gas Production and Sales, accessed at www.dmr. nd.gov/oilgas/stats/Gas1990ToPresent.pdf, 9 August 2013. We tallied production in 2012 only. Ohio For Ohio, we included data for wells drilled in both the Marcellus and Utica shales from the Ohio Depart-ment of Natural Resources, Division of Oil & Gas Re-sources. The state separates shale well permit activity into Marcellus and Utica categories, and presents it in spreadsheets entitled Cumulative Permitting Activ-ity, available at oilandgas.ohiodnr.gov/shale#SHALE, with well sites permitted through 2 May 2013. Produced water and gas information for the Utica came from Ohio Department of Natural Resources, Division of Oil & Gas Resources, 2012 Utica Shale Production Report, 16 May 2013. Data on produc-tion from the 11 drilled Marcellus wells came from Ohio Department of Natural Resources, Division of Oil & Gas Resources, Ohio Oil & Gas Well Database, accessed at http://oilandgas.ohiodnr.gov/well-infor-mation/ oil-gas-well-database, 24 June 2013. We used the API numbers from Ohio Department of Natural Resources, Division of Oil & Gas Resources, Marcellus Shale Horizontal Wells, 6 July 2013.
- 35. Oklahoma Our count of fracking wells in Oklahoma came from a database downloaded from FracTracker, Oklahoma Shale Wells (3-18-2013), accessed at www.fractracker. org/downloads/, 28 June 2013. The database does not contain any date information. Pennsylvania We included data for all unconventional wells with spud dates of January 1, 2005 and later from Pennsyl-vania Department of Environmental Protection, Oil and Gas Reports: SPUD Data Report, www.portal.state. pa.us, 29 May 2013. Data on gas and water produced in 2012 from Penn-sylvania’s fracking wells came from the Pennsylvania Department of Environmental Protection, PA DEP Oil & Gas Reporting Website—Statewide Data Downloads by Reporting Period, accessed at www.paoilandgasre-porting. state.pa.us/publicreports/Modules/DataEx-ports/ DataExports.aspx, 24 June 2013. Our produced water tally included “Drilling Fluid Waste,” “Fracing Fluid Waste” and “Produced Fluid.” Tennessee Our estimate of the number of fracking wells came from Ron Clendening, Geologist, Oil & Gas Contacts, Division of Geology, Tennessee Department of the Environment and Conservation, personal commu-nication, 8 July 2013. We were unable to obtain an estimate of wastewater or gas production. Texas Texas began keeping track of fracking wells in Febru-ary 2012. To compile an estimate of fracking wells since 2005, we used several data sources. • 2005-2009: We assume that from 2005 through 2009, the bulk of fracking activity in Texas occurred in the Barnett Shale and was barely beginning elsewhere. A total of 8,746 new horizontal wells were drilled in the Barnett Shale from 2005 through 2009, per Powell Barnett Shale Newsletter, 18 April 2010, as cited in Zhongmin Wang and Alan Krupnick, A Retrospective Review of Shale Gas Development in the United States, Resources for the Future, 2013. The Eagle Ford Shale was first drilled in 2008 and by 2009 there were 107 producing oil and gas wells, per Texas Railroad Commission, Eagle Ford Information, accessed at www.rrc.state.tx.us/eagleford/, 3 September 2013. • 2010: Nearly 40 percent of wells drilled in 2010 were fracked using more than 100,000 gallons of water, per Table 7 of Jean-Philippe Nicot, et al., Bureau of Economic Geology, Jackson School of Geosciences, University of Texas at Austin, for the Texas Water Development Board, Current and Projected Water Use in the Texas Mining and Oil and Gas Industry, June 2011. We multiplied 39.7 percent times the 8,133 “new drill dry/comple-tions” 34 Fracking by the Numbers: Key Impacts of Dirty Drilling at the State and National Level in 2010, per Railroad Commission of Texas, Summary of Drilling, Completion and Plugging Reports, accessed at www.rrc.state.tx.us/data/drill-ing/ drillingsummary/index.php, 19 July 2013. • January 2011 through January 2012: We calcu-lated the number of fracking wells in this period by multiplying the number of wells drilled by an estimate of the percentage of those wells that were fracked. The number of “new drill dry/ completions” came from Railroad Commission of Texas, Summary of Drilling, Completion and Plugging Reports, accessed at www.rrc.state. tx.us/data/drilling/drillingsummary/index.php, 3 September 2013. We interpolated between 2010 and February 2012 using the percentage of wells that were fracked using the 2010 estimate of 39.7 percent, described above, and the percent fracked from February 2012 to April 2013, described below. • February 2012 through April 2013: Beginning in February 2012, drilling companies in Texas have been required to report their drilling activities
- 36. Policy Recommendations 35 to FracFocus. Per SkyTruth, 19,678 wells were fracked in Texas in that period that used more than 100,000 gallons of water. This number of wells equals 82.5 percent of all “new drill dry/comple-tions” in the same period in Railroad Commis-sion of Texas, Summary of Drilling, Completion and Plugging Reports, accessed at www.rrc.state. tx.us/data/drilling/drillingsummary/index.php, 3 September 2013. Texas does not require reporting of produced water volumes. However, the state does track the volume of water that is injected into disposal wells or for enhanced recovery in other wells. Our estimate of wastewater is based on the assumption that 99 per-cent of all produced water is reinjected, and there-fore reinjected water volumes indicate wastewater production, per Leslie Savage, P.G., Chief Geologist, Oil & Gas Division, Railroad Commission of Texas, personal communication, 18 July 2013. Ms. Savage queried the Railroad Commission’s H10 Filing System to return results on injected saltwater volumes in 2012, which we used as the basis of our estimate. This includes both flowback and produced water. Utah Our count of fracking wells came from the FracFocus database. We screened for wells that reported using more than 100,000 gallons of water, and counted 1,336 wells. We calculated gas and produced water volumes from fracking wells in Utah from Utah Department of Natural Resources, Division of Oil, Gas and Min-ing, Production Data, accessed at http://oilgas.ogm. utah.gov/Data_Center/DataCenter.cfm#download, 12 July 2013. To limit our tally to production from fracking wells, we used API numbers for all Utah wells included in SkyTruth’s database from FracFocus data. Of the 1,607 wells with APIs in SkyTruth’s database, we found 2012 production reports for 1,364 wells in Utah’s data. Virginia We counted all horizontal wells included in Virginia Department of Mines, Minerals, and Energy Division of Gas and Oil Information System, Drilling Report, ac-cessed at www.dmme.virginia.gov, 29 May 2013. We were unable to obtain data on produced water. An estimated 15 to 30 percent of water and chemi-cals used to frack a well returns to the surface, per Virginia Department of Mines, Minerals, and Energy, Division of Gas and Oil, Hydraulic Fracturing in Virginia and the Marcellus Shale Formation, accessed at www. dmme.virginia.gov/DGO/HydraulicFracturing.shtml, 12 July 2013. However, we were unable to obtain data on how much formation water also is produced. West Virginia Our data for West Virginia includes all permitted wells targeting the Marcellus Shale. We were unable to narrow our count to drilled wells. We also chose to include wells without a listed permit date, on the as-sumption that any Marcellus drilling in West Virginia has occurred recently. Data is from West Virginia Department of Environmental Protection, Resource Extraction Data Viewer, http://tagis.dep.wv.gov/ fogm/, 20 June 2013. We tallied gas production from 2011 (the most recent year reported). We obtained 2011 production data from West Virginia Department of Environmental Pro-tection, Oil and Gas Production Data, accessed from www.dep.wv.gov/oil-and-gas/databaseinfo/Pages/ default.aspx, 12 July 2013. We looked up production from fracking wells by using the API numbers report-ed to FracFocus and compiled in SkyTruth’s database. Our calculation of production is an underestimate because only 52 wells from FracFocus corresponded to wells in West Virginia’s production database. West Virginia does not collect water production data.
- 37. Wyoming We used data on fracking wells reported to the FracFocus database to ensure we did not accidentally include coalbed methane wells. There are 1,126 wells in the FracFocus database that report using more than 100,000 gallons of water. This figure from FracFocus is close to data we ob-tained through another approach. We tallied 1,273 horizontal wells since 2005 in Wyoming from Frac- Tracker, WY_horiz_06032013, accessed at www. fractracker.org/data/, 28 June 2013. FracTracker obtained this list via a request to the Wyoming Oil and Gas Conservation Commission. This estimate excludes any wells that list a spud date before 2005, and includes wells with no date or that were flagged as coalbed. Water Used We multiplied the number of fracking wells per state since 2005 by average water use per well per state since 2011. Average water use per well that reported using more than 100,000 gallons came from Skytruth, Fracking Chemical Database, accessed at http://frack.skytruth. org/fracking-chemical-database/frack-chemical-data- download, 12 June 2013. SkyTruth compiled data posted in PDFs on the FracFocus website into a database that includes water use, which can encom-pass freshwater, produced water and/or recycled water. The inclusion of recycled water may lead to some double-counting of water used. We included data beginning in 2011 through the most recent en-tries for 2013. In calculating average water consump-tion per well, we excluded wells that listed “None” for water use. We excluded what appeared to be dupli-cate entries, based on API numbers, frack date and reported water use. We also excluded two wells from Texas that reported using more than 1 billion gallons of water each, which we assumed was a data entry error by the reporting operator. To estimate water use since 2005, we multiplied aver-age 36 Fracking by the Numbers: Key Impacts of Dirty Drilling at the State and National Level water use per reporting well in each state by the number of fracking wells (using more than 100,000 gallons of water) in each state since 2005. The source of our well count is described in the previous section. Air Pollution We used data from New York State’s assessment of air pollution from each well site to estimate the volume of particulate matter, smog precursors and other haz-ardous compounds from fracking. Though the U.S. Environmental Protection Agency recently studied air pollution from gas drilling, the data were com-piled primarily from vertically rather than horizon-tally fracked wells and were limited to fewer types of pollutants (see EC/R, Inc., for U.S. Environmental Pro-tection Agency, Oil and Natural Gas Sector: Standards of Performance for Crude Oil and Natural Gas Pro-duction, Transmission, and Distribution. Background Technical Support Document for Proposed Standards, July 2011. New York State’s pollution assessment was more complete and more relevant to high-volume fracking wells. We assume that four wells per drilling site are drilled, fracked and completed each year, per New York State Department of Environmental Conservation, Revised Draft Supplemental Generic Environmental Impact Statement on the Oil, Gas and Solution Mining Regula-tory Program: Well Permit Issuance for Horizontal Drill-ing And High-Volume Hydraulic Fracturing to Develop the Marcellus Shale and Other Low-Permeability Gas Reservoirs, 7 September 2011, 6-105. We assumed that wells produce dry gas, not wet gas, and that operators flare flowback gas instead of simply vent-ing it. This first assumptions means our air pollution estimate may understate the problem, since wet gas wells have higher emissions, while our second assumption changes the mix of pollutants released. We multiplied the tons-per-year emissions estimates from Table 6.7 of the Revised Draft Supplemental Generic Environmental Impact Statement by a recent year’s well completion figure for each state.