
Recommended
Recommended
More Related Content
What's hot
What's hot (20)
Similar to An Investigation into the Financial Performance of Micro, Small and Medium Enterprises (MSMEs) in Nanded, Maharashtra
Similar to An Investigation into the Financial Performance of Micro, Small and Medium Enterprises (MSMEs) in Nanded, Maharashtra (20)
More from Dr. Amarjeet Singh
More from Dr. Amarjeet Singh (20)
Recently uploaded
Recently uploaded (17)
An Investigation into the Financial Performance of Micro, Small and Medium Enterprises (MSMEs) in Nanded, Maharashtra
- 1. International Journal of Engineering and Management Research e-ISSN: 2250-0758 | p-ISSN: 2394-6962 Volume-11, Issue-5 (October 2021) www.ijemr.net https://doi.org/10.31033/ijemr.11.5.4 22 This Work is under Creative Commons Attribution-NonCommercial-NoDerivatives 4.0 International License. An Investigation into the Financial Performance of Micro, Small and Medium Enterprises (MSMEs) in Nanded, Maharashtra Dayanand Trimukh Hattiambire1 and Dr. Prabhakar Harkal2 1 Research Scholar, Yashwantrao Chavan Maharashtra Open University, Nashik, INDIA 2 Research Guide YCMOU & Ex-Associate Professor, Dnyanopasak College of Arts, Commerce, Science, and Technology, Parbhani, INDIA 1 Corresponding Author: hattiambire_dt@ycmou.digitaluniversity.ac ABSTRACT Micro, small and medium enterprises (MSMEs) are an indispensable part of the Indian economy. In terms of Gross Value Added (GVA) and Gross Domestic Product (GDP), MSMEs accounted for about 33% and 31% of India's GVA and GDP, respectively, in the year 2019-20. Unlike large enterprises that are concentrated in the metros, MSMEs are spread across smaller and larger rural as well as urban centres of India. They are also the biggest source of employment, especially in rural India, and contribute to the rural development and industrialisation. MSMEs also act as a great social bridge as smaller enterprises are owned by socially backward classes and women than are larger enterprises. For these reasons and more, the India government has always promoted the growth and development of MSMEs through policy initiatives, technology up gradation, and via other means. Consequently, MSMEs have also grown in multi-folds in the past decades in terms of the number of enterprises in operation and the collective revenue of the sector. Several challenges affect the growth of MSMEs, however. One of these is the limited academic studies into the financial performance of MSMEs, probably due to the unavailability of adequate data. The present research attempts to fill this gap by conducting a financial performance evaluation of 51 sample MSMEs based in the district of Nanded, Maharashtra. The research utilizes Data Envelopment Analysis (DEA) to compare the financial performance of sample MSMEs selectively using the suitable variables identified by Arasu et al. (2021). Findings suggest sharp differences in the financial performance of sample units. Inefficient units are suggested to improve their return on asset, return on capital employed, and net profit margin. Keywords-- Financial Performance Evaluation, MSMEs, Nanded, Small-Scale Industries, Data Envelopment Analysis (DEA) I. INTRODUCTION Prior to the enactment of the central government‟s Micro, Small and Medium Enterprises Development Act, 2006 (MSMED Act), India identified these enterprises as small-scale industries (SSIs). The concept was similar. Post the MSMED Act, small-scale industries were classified into micro, small and medium enterprises (MSMEs) based on capital investment as stated in Table 1. With effect from 1 July 2020, micro, small and medium enterprises were defined as stated in the third column. The new definition made changes in three respects – (i) it added an additional classification criterion, i.e., annual turnover, (ii) it increased the limits, and (iii) it removed the distinction between manufacturing and service-based enterprises. Nagaraj & Vaibhav (2020) point out that the recent revision was meant to (i) account for inflation, and (ii) to support growing start-ups in their early days by continuing to reap benefits. The authors also analysed CMIE database and estimated that the revision would benefit 2597 existing enterprises that earlier did not classify as an MSME. The average capital investment and annual turnover of these 2597 enterprises are ₹22.6 crores and ₹87 crores, respectively. Table 1: Definition of Micro, Small and Medium Enterprises “ Old definition (Inv.) New definition Mfg. Services Inv. Turnover Micro ₹25 lacs ₹10 lacs ₹1 crore ₹5 crore Small ₹5 crore ₹2 crore ₹10 crore ₹50 crore Medium ₹10 crore ₹5 crore ₹50 crore ₹250 crore” *The indicated numbers are the upper limits. Based on 2015-16 73rd round National Sample Survey (NSS), there were 633.88 lakh of these enterprises contributing 33.50% and 30.27% to India‟s gross value addition (GVA) and gross domestic product (GDP) in the year 2018-19, respectively. Over 99% of 633.88 lakh enterprises are micro enterprises and a majority based out of rural area. As a result, these enterprises play a vital role in the development of rural
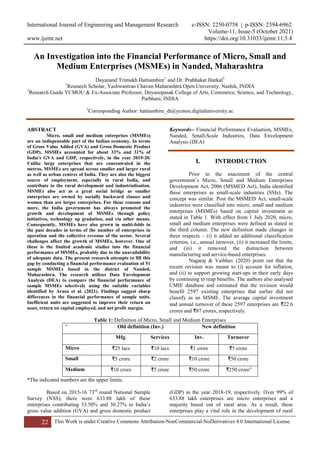
- 2. International Journal of Engineering and Management Research e-ISSN: 2250-0758 | p-ISSN: 2394-6962 Volume-11, Issue-5 (October 2021) www.ijemr.net https://doi.org/10.31033/ijemr.11.5.4 23 This Work is under Creative Commons Attribution-NonCommercial-NoDerivatives 4.0 International License. regions and smaller towns and cities. They create local jobs, in 2015-16, MSMEs employed over 11.09 crore workers about 45% of them in rural areas. The top three MSME sectors are manufacturing, trade, and service industries, each accounting for nearly a third of the entire MSME sector. Electricity sector accounts for 0.07% of the MSME sector in terms of number of registered units. Source: MSME Annual Report 2020-21 Figure 1: Employment in different MSME sectors Micro enterprises are also credited for creating a more equal society, more than 65% of them are led by entrepreneurs belong to socially backward groups (NSS 73rd round). Smaller and medium enterprises, in contrast, are predominantly under the ownership of entrepreneurs belonging to the minority general groups (NSS 73rd round). In terms of female leadership, only one in five micro enterprises is led by a woman entrepreneur. For small and mid-sized enterprises, the figures are as low as 5.26% and 2.67%, respectively. MSME jobs too tend to predominantly cater to men (76%) than women (24%). While women workers hold 27% of MSME jobs in rural areas, they account for only 20% of the urban MSME workforce. One of the key indicators of growth of MSMEs is the number of new registrations. Over the past few years, the Government of India has taken several initiatives to make the process of registration easier and user-friendly for new enterprises. With effect from 6 July 2020, new MSMEs could register using the user- friendly online platform called Udyam. Udyam cuts through the entire paperwork headache and registers new enterprises in a matter of few minutes, as long as one has an Aadhaar card. Between July 2020 to September 2021, the new platform registered 45 lakh micro, 2.6 lakh small and 31,000 medium-sized enterprises. Another interesting point to note is that 62% of these new registrations are service-based units, thus dwarfing the dominance of the manufacturing sector in the MSME space. Prior to Udyam, new enterprises could register on Udyog. Udyog Aadhar Memorandum or UAM used to be an online portal to file for the Entrepreneurship Memorandums (EMs). EM Part 1 and Part 2 were respectively required to be submitted, following the enactment of the MSMED Act in 2006, before and after the setup of the enterprise. Between 2007-15, 22+ lakh EM Part II were filed. Following the simplification of the process with UAM, another 1 crore memorandums were filed between 2015-20. Compared to these figures, Udyog has already registered over 48 lakh enterprises in a one-year period. Therefore, simplification of the registration process has been a progressive step and seems to have benefited the sector. Registrations are only a part of the whole picture. A comparison of MSME surveys from two different time periods is likely to give a better picture of the growth. Between 2006-07 to 2015-16, the MSME sector has expanded twice from 361.76 lakh registered units (the Fourth All India Census of MSME 2006-07) to 633.9 lakh (NSS 73rd round 2015-16). As a result of these affirmative action‟s in the recent past to ease the registration process and the process of running business, the number of days it takes, on average, to register a business has reduced drastically from 127 to 30 days only. In other respects, though, media reports point out the difficulties of an MSME. A local business in the state of Maharashtra, for instance, needs to get clearance for twelve procedures before it can start operations. By contrast, countries like Malaysia and the United States have only five procedures for business to start operations. Another area of concern for the Indian MSME sector is their inability to access formal credit. The credit requirement of the Indian 32% 0% 35% 33% Manufacturing Electricity Trade Other Services
- 3. International Journal of Engineering and Management Research e-ISSN: 2250-0758 | p-ISSN: 2394-6962 Volume-11, Issue-5 (October 2021) www.ijemr.net https://doi.org/10.31033/ijemr.11.5.4 24 This Work is under Creative Commons Attribution-NonCommercial-NoDerivatives 4.0 International License. MSME sector stood at a whopping ₹3.25 lakh crore in 2020, and despite this great demand, only 50 out of 633 lakh MSMEs had access to formal credit (Inc42, Ease of Doing Business from a MSME Perspective). Without financial literacy, these enterprises operate in the dark with little means to evaluate their financial performance. As would be discussed in the subsequent section, there has been little academic endeavour to fulfil this gap. The present research is likely one of the first such endeavours in the Indian academic sphere to evaluate the financial performance of Indian MSMEs on parameters that are used to evaluate listed companies. These parameters and the research geography would be detailed in a subsequent section, for now, in brief, the study employs financial ratios as input/output criteria in a Data Envelopment Analysis (DEA) model. The choices for financial ratios are based on Arasu et al. (2020) and the DEA model we use is none other than the infamous CCR-O model developed first by Charles et al. (1976). II. LITERATURE REVIEW Charles et al. (1976) originally developed the DEA to evaluate the efficiency of a set of production units against an efficiency frontier. Other researchers developed different DEA models, yet the CCR model continues to be the most popular in the town. Although originally meant to evaluate production efficiency, the CCR model has lately been extensively used to evaluate all sorts of outcomes – including financial metrics. Fecher et al. (1993) employed DEA to measure the technology efficiency of insurance companies. Grovera et al. (1998) used the CCR model to investigate whether information technology (IT) enhanced productivity by comparing two groups of decision-making units (DMUs) – one group employed IT and the other group didn‟t. Though unimportant to out discussion, the researchers found that IT had positive effects on the productivity of the sample units. DEA has extensively been used to evaluate financial performance of banks and non-banking financial institutions. Grigorian & Manole (2012) employed DEA to investigate the performance of commercial banks assuming both, one at a time – a variable return to scale (VRTS) and a constant return to scale (CRTS). The authors concluded that minimizing capital adequacy ratio should increase the overall profitability and return of the banks. Researchers have employed different creative approaches to measure the performance of MSMEs in the face of a data dearth. Dess et al. (1997) found that entrepreneurial approach and strategy appear to positively influence firm performance. Innovative firms are willing to launch riskier ventures and are more innovative in product marketplaces, according to Miller & Friesen (1984). Lee & Tsang (2001) found a strong correlation between entrepreneurial attitude and the performance of the firm. Bhunia (2002) studied the correlation between a small/medium-sized enterprise‟s financial health and their defaulting behaviour. She found correlation between credit history and the likelihood of default. Bhunia also remarked that evaluating the credit risk of a SME should be carried differently than that for a megacorporation. In order to determine how risk impacts the financial performance of MSMEs, Chiliya et al., (2015) have been investigated in order to identify the link between the risk and knowledge of risks in different industries. The results of this study reveal that risk awareness and risk management practises in industry are still below the required level in growing industries. Most respondents provide funding for training and risk management seminars in order to promote risk awareness and management practises. Wambazu et al. (2015) examined the impact of risk management on their financial outcomes in the study of 100 micro and small firms in Kenya. The study found that application of risk management has a direct impact on small to medium-sized businesses' financial performance and advocated that small and medium-sized organisations should apply Risk Management to manage their risk. Data from around 56,000 MSMEs from seventy-nine countries were reviewed by Chauvet & Jacolin (2015) and concluded that financial provision, which offers broader financial inclusion, helps to boost business growth. They concluded that the performance of micro and medium enterprises (MSMEs) was extremely well linked with the availability of finance, like earlier studies (from Ghana). Past research has shown that various external and internal elements need to be addressed in order to determine the overall success of small enterprises (David & Kovacs, 2020; Madai et al., 2020). The company's success is all linked to initial money, access to funding, the product mix and client demand. Corporate management, enterprise settings and the impact of economic and social policies are heavily influencing the business strategy and growth. Social and economic policies adversely affect enterprise strategy according to Arieftiara et al. (2019). A variety of internal and external elements can benefit MSMEs, including people, natural, fund source, products, marketing strategy, owned facilities, location and level of benefit (Parunti & Tumiwa, 2016). The MSME performance assessment indicators include increased sales turnover, increased capital, strengthened labour force development, broad market growth and continuous profit development (Anton et al., 2015; Fenyves-Tarnoczi, 2020). We discussed the lack of financial literacy in the MSME sector. Various researchers have investigated how this lack of financial literacy impacts the sector, adversely. The first major evidence on the association between financial results and financial conduct was provided by Letkiewicz (2012). Financial literacy is an important element for any entrepreneur to make a
- 4. International Journal of Engineering and Management Research e-ISSN: 2250-0758 | p-ISSN: 2394-6962 Volume-11, Issue-5 (October 2021) www.ijemr.net https://doi.org/10.31033/ijemr.11.5.4 25 This Work is under Creative Commons Attribution-NonCommercial-NoDerivatives 4.0 International License. financial choice. The author connected financial literacy and success with entrepreneurs and showed that there is a statistically significant connection between financial literacy and it is expected to succeed. In order to establish its loan search limits, Binks & Ennew (1996) has been studying the survey data on 6000 MSME. It indicates that credit limitations are its main constraints and that the absence of information is the most essential feature. This is especially important for expanding enterprises as the situation with respect to loan restrictions is substantially tighter. It is believed that a collateral and enhanced interaction between the lender and the borrower can reduce the negative effects of the asymmetry of information The absence of access to financial services is undoubtedly one big barrier to start- up and sustainable growth, Evans et al. (1989) point out. By studying their lending facilities, Bhalla & Kaur (2012) investigated banks' behaviour towards MSMEs. 71 representatives of the banks at branches in the Ludhiana district in Punjab were asked a number of questions from a pre-structured questionnaire. Factor analysis and weighted average values showed that banks were largely worried about profitability and the value guaranteed. The reason for a further cautious approach was the lack of information to make it possible for the entire organisation to understand them. Since the present research employs financial ratios to evaluate firms‟ financial performance, it is important to consider research into whether financial leverage affects the financial performance of a firm. Rajan & Zingales (1995) explores numerous leverage accounting measures and content. They proposed that the measurement be based on the analysis in order to assure the accuracy of the measurement. They claim that a solid assessment of whether the company may face bankruptcy shortly is the ratio of total liabilities to total assets. Nissim & Penman (2001) tried to investigate leverage benefits and downsides for various companies. According to the authors, financial leverage influences the value of shareholders. In this section the authors analyse various centuries-old concepts of the capital structure including topics like the theory of punching order and traditional trade-off. The article provides an examination of the financial statement that identifies the implications of financing liabilities on book value rates. The results reveal that, if leverage is favourable, profits grow; if leverage is unfavourable, losses are increased. The results show that the leverage is favourable. The report highlights also the impact of Dell, USA, as a case study financing liability. It is what the authors have done here that they have extended the idea of leverage from very fundamental to its subtle impact on rentability and mathematical explanations. Kakani et al. (2001) tried to discover data supporting generally held perspectives on Indian business performance. The writers underline the importance of knowing the various elements affecting corporate success, particularly for ordinary shareholders. During the span of eight years between 1992 and 2000, they have used financial statements and capital market data from more than 500 large corporations, divided into two sub-periodicals. The numerous variables used to analyse the financial performance of a company include the value of shareholders, accounting profits and their components, growth and risk of sample companies as well as leverage of the capital structure. It shows that the various capital market impacts can lead to radically different performance measurements based on market and accounting. Bouchand et al. (2001) reported a negative correlation of previous results with future volatility. The authors studied how finance, returns and stock prices are related and how the correspondence between companies can be seen differently. Others who witness use of leverage see it differently from those who do not. Six of the 10 French enterprises and those who issued debt instruments to raise money did so, when there was no recessionary pressure on the markets. As markets slowed, investors began to view debt in the capital structure as a probable recipe for bad returns, thereby removing stocks projected to be financially challenging on the market. This has led to a further decline in stock trading values on stock markets. The prior investigation supported prevalent assumptions that leverage has a large impact on trade prices and organisations' financial success. Chen & Zao (2005) analysed nearly 95,000 observations from US Stocks between 1972 to 2002 and concluded that financial decisions and leverage ratios might provide contrasting results, and that leverage ratios aren‟t the only inferences that may be erroneous, inferences based on leverage ratios alone may be misleading. Aydemir et al. (2007) stated that scholars are examining market and corporate leverage impacts. In addition, due of the nature of this research, stock volatility was again associated with leverage. Leverage can have a major influence on profitability, liquidity and the perception of investors. Leverage is related to the dominant market interest rate. The authors have stated that there is a connection between profitability and liquidity between a company's leverage and profitability and liquidity. Frank & Goyal (2008) said that literature had misinterpreted financial leverage and highly profitable companies are using debt for the purchase of equity while less profitable firms are using equity for raising money. The data from 185 NYSE-listed Latin American companies, the effects of leverages on profits and tangibility, company size, company development and other properties, have been studied by Bebczuk & Galino (2010). This study was carried out in the light of the recent subprime crisis. The study shows that lucrative companies, whose incomes increase over time, are less inclined to borrow for capital needs.
- 5. International Journal of Engineering and Management Research e-ISSN: 2250-0758 | p-ISSN: 2394-6962 Volume-11, Issue-5 (October 2021) www.ijemr.net https://doi.org/10.31033/ijemr.11.5.4 26 This Work is under Creative Commons Attribution-NonCommercial-NoDerivatives 4.0 International License. III. METHODOLOGY Financial analyses are a means of analysing a company's financial strengths and weaknesses by correlating profit and loss accounts and balances. Financial performance assessment consists of a collection of specific skills, which encompass definition of key performance indicators, handling performance reporting, drawing up strategic goals and outcome estimates, increasing, as well as economic results, financial and operational competence. The purpose of this study is to assess the financial performance of sample MSMEs in the Maharashtra district of Nanded. Nanded was chosen for this study because it was designated by the government of Maharashtra as D+, backward and less industrialised District. The district has more than 465 active MSMEs, of which just 18 are medium and large companies. The financial accounts of 51 units, as a convenient sample, for the period 2016-17 to 2020-21 have been studied. The research will analyse the financial performance and so provide important empirical insight into the financial achievements and challenges of sample small and medium enterprises. Target population: Active MSMEs in Nanded Target population size: 465 Sample size: 51 Sampling technique: Convenient sampling Study period: 2016-17 to 2020-21 Table 2 lists the data extract for the analysis. Six financial ratios were computed. Net profit margin, return on asset, and return on capital employed were used as output variables. Current ratio, quick ratio, and asset turnover ratio were employed as input variables in the DEA CCR model. The choices of variables are based on the findings of Arasu et al. (2021). Table 2: Ratios Computed for the Purpose of the Analysis RATIOS DESCRIPTION Net profit margin (%) The net profit margin is an easy instrument for monitoring a company's profitability. It is the percentage difference between total revenues and entire costs. This means that the corporation earns in sales with every dollar. The following is the net profit margin: ( ) where Return on asset (%) Return on assets represents the ratio of net income to the company's total assets, therefore showing us the profitability of the assets. It evaluates the return on every dollar invested in the assets of the company. The more efficient and successful the business is the better the return on assets. Asset returns are as follows: ( ) Return on capital employed (%) Another indicator of the company's profitability is the return on capital employed (ROCE). ROCE is a split by the capital used, which is a division between total asset and current liabilities, of net operating income (i. e. a net income before taxes and interest). In contrast to the return on assets, ROCE reflects the liabilities owing to the company so that the profitability of a company is given a more impartial picture. ( ) Current ratio Two widely sought liquidity measurements are current and fast ratios. In terms of liabilities, they provide us the financial health of the Company. The current ratio is the ratio of the assets currently incurred to the debt currently in force. Current assets include cash, accounts payable, securities tradable, inventory and articles prepayable. Actual accounts payable, notes paid, wages, taxes, debt and maturity commitments are included in current liabilities. A 1 ratio shows that the corporation has a $1 of assets for each dollar outstanding. Generally speaking, the bigger the value of the current ratio, the better its financial health, and, in the situation that things don't go for a while, the less likely the company will have to file for bankruptcy.
- 6. International Journal of Engineering and Management Research e-ISSN: 2250-0758 | p-ISSN: 2394-6962 Volume-11, Issue-5 (October 2021) www.ijemr.net https://doi.org/10.31033/ijemr.11.5.4 27 This Work is under Creative Commons Attribution-NonCommercial-NoDerivatives 4.0 International License. The current ratio is as follows: Quick ratio Since certain assets can be harder to convert or a longer period payable, we employ a rapid ratio to acquire insights into a company's financial health in the short term. It refers to the ratio of liquid assets to current obligations and the following equation expresses it. Cash, marketable securities and reimbursable accounts within a year include liquid assets. Asset turnover ratio (%) As regards total sales generated, asset turnover gauges the exploitation of the assets of a corporation. The return on the asset is different from the ratio of net income (profit) to total assets. The average sales of each firm in the same year amounted to 50 lakes and a total of 45 lakes, the company can thus generate 90 countries or €0.9 per rupee holding in assets in the same year. The company's asset sales ratio therefore stands at 90%. The ratio may be as expressed as follows: ( ) A unit is said to be “efficient” when it produces the maximum output with minimum resources/inputs. That is simply just the ratio of output over input when there is only one output and one input variables, or multiple outputs and a single input. It gets complicated when there are multiple output and input variables, though. DEA makes life easier. Assuming a constant return to scale (CRTS), the DEA CCR model compares the utilization of resources and the respective output of a set of decision-making units (DMUs) and assigns each of them an efficiency score between 0 to 1. A perfect score of 1 indicates that the DMU is efficient and anything less than 1 is inefficient. The lesser the score the more inefficient the DMU is. DEA also assigns different weights ui and vi to different inputs and outputs for each DMU, indicating the strengths of each DMU for decision makers to work upon and optimize the units. The analysis was carried out in MS Excel using a third-party extension. Since the DEA works best with a homogenous set of DMUs, the sample units were classified into (i) agro- and cotton-based industry, (ii) minerals & metal industry, and (iii) plastic, chemical and petro-based industry. Table 3 illustrates the number of sample micro, small and medium units for each of the three industries. Out of the 51 sample units, 43 were micro-sized units. The rest 6 and 2 were small- and medium-sized enterprises, respectively. The size of sample units, in terms of capital investment and turnover, has been illustrated in Table 4. Table 5 illustrates the mean profitability and liquidity figures of sample firms, and Figures 2-5 give a year-wise comparison of profitability and liquidity of these units. Table 3: Representation of Micro, Small and Medium Units Across Three Industries in the Sample Agro & cotton- based industry Minerals and metal- based industry Plastic, chemical, and petro- based industry Total Micro firms 12 15 16 43 Small firms 1 2 3 6 Medium firms 1 1 0 2 Total no. of firms 14 18 19 51
- 7. International Journal of Engineering and Management Research e-ISSN: 2250-0758 | p-ISSN: 2394-6962 Volume-11, Issue-5 (October 2021) www.ijemr.net https://doi.org/10.31033/ijemr.11.5.4 28 This Work is under Creative Commons Attribution-NonCommercial-NoDerivatives 4.0 International License. Table 4: Mean Investment and Annual Turnover of Sample Firms Mean Investment Mean turnover Micro 0.52 2.56 Small 6.62 31.12 Medium 29.64 82.35 Total 9.05 2.38 Table 5: Mean Profitability and Liquidity of Sample Units Net profit margin (%) Return on asset (%) ROCE (%) Current ratio Quick ratio Asset turnover ratio (%) Agro & cotton firms 12.52 12.67 24.87 2.10 1.56 109.70 Minerals & metal firms 11.30 9.65 19.84 1.96 1.35 111.76 Plastic, chemical, and petro 8.79 6.23 14.79 1.94 1.19 90.19 Total avg. 10.70 9.21 19.34 1.99 1.34 103.16 Figure 2: Year-wise avg. net profit margin 0.00 2.00 4.00 6.00 8.00 10.00 12.00 14.00 16.00 2020-21 2019-20 2018-19 2017-18 2016-17 Avg. Net Profit Margin (%) Agro & cotton firms Minerals & metal firms Plastic, chemical & petro firms
- 8. International Journal of Engineering and Management Research e-ISSN: 2250-0758 | p-ISSN: 2394-6962 Volume-11, Issue-5 (October 2021) www.ijemr.net https://doi.org/10.31033/ijemr.11.5.4 29 This Work is under Creative Commons Attribution-NonCommercial-NoDerivatives 4.0 International License. Figure 3: Year-wise avg. return on asset Figure 4: Year-wise avg. quick ratio 0.00 2.00 4.00 6.00 8.00 10.00 12.00 14.00 2020-21 2019-20 2018-19 2017-18 2016-17 Avg. Return on Asset (%) Agro & cotton firms Minerals & metal firms Plastic, chemical & petro firms 0.00 0.50 1.00 1.50 2.00 2.50 2020-21 2019-20 2018-19 2017-18 2016-17 Avg. Current ratio Agro & cotton firms Minerals & metal firms Plastic, chemical & petro firms
- 9. International Journal of Engineering and Management Research e-ISSN: 2250-0758 | p-ISSN: 2394-6962 Volume-11, Issue-5 (October 2021) www.ijemr.net https://doi.org/10.31033/ijemr.11.5.4 30 This Work is under Creative Commons Attribution-NonCommercial-NoDerivatives 4.0 International License. Figure 5: Year-wise avg. quick ratio IV. FINDINGS AND DISCUSSION 4.1 Agro and Cotton-based Industry Table 6 presents the year-wise data on no. of efficient DMUs in each year, the average efficiency scores, and the standard deviations. One could assume from this table that DMUs, on average, have performed rather worse in fiscal years 2017-18 and 2020-21, however, a closer inspection of year-wise output data (Table 7) indicates otherwise. The average net profit margin, return on asset, as well as ROCE are all at their peak in FY2020-21. Since a simple comparison of output without considering the input resources may be misleading, we ran a DEA with fiscal years as DMUs and the average output/input scores. To no one‟s surprise, the firms, together, were most efficient in FY2020-21 with a score of 1 (Figure 6). Table 6: Avg. Efficiency and No. of Efficient DMUs between 2016-17 to 2020-21 FY2016-17 FY2017-18 FY2018-19 FY2019-20 FY2020-21 Total no. of DMUs 14 14 14 14 14 No. of efficient DMUs 6 5 8 6 5 Avg. efficiency 0.8005 0.7601 0.8395 0.8644 0.8295 Maximum 1 1 1 1 1 Minimum 0.3112 0.331 0.2776 0.3259 0.306 Std. Deviation 0.2651 0.2443 0.2615 0.2119 0.2283 *Avg. data computed based on FY2016-17 to FY2020-21 data. Table 7: Avg. Output/Input Data for the period 2016-17 to 2020-21 FY2016-17 FY2017-18 FY2018-19 FY2019-20 FY2020-21 Net profit margin (%) 11.3 11.4 10.69 11.03 12.51 Return on asset (%) 12.28 12.28 11.94 11.49 12.67 ROCE (%) 23.94 24.16 23.67 21.52 24.86 Current ratio 2.18 2.11 2.07 2.1 2.09 Quick ratio 1.64 1.59 1.57 1.49 1.55 Asset turnover ratio (%) 136.6 134.73 139.32 122.67 109.7 *Avg. data computed based on FY2016-17 to FY2020-21 data. 0.00 0.20 0.40 0.60 0.80 1.00 1.20 1.40 1.60 1.80 2020-21 2019-20 2018-19 2017-18 2016-17 Avg. Quick Ratio Agro & cotton firms Minerals & metal firms Plastic, chemical & petro firms
- 10. International Journal of Engineering and Management Research e-ISSN: 2250-0758 | p-ISSN: 2394-6962 Volume-11, Issue-5 (October 2021) www.ijemr.net https://doi.org/10.31033/ijemr.11.5.4 31 This Work is under Creative Commons Attribution-NonCommercial-NoDerivatives 4.0 International License. Figure 6: Year-wise Efficiency of 14 DMUs based on Avg. Output/Input Values Table 8 presents compiles the efficiency scores of all 14 agro & cotton-based industry enterprises. It also gives an average efficiency score for each firm and ranks each of them a rank based on their average efficiency score over the study period of five years between 2016- 17 to 2020-21. Firms 1, 3, and 11 were efficient throughout the five-year period. Firm 4 was efficient throughout 2016-17 to 2019-20 and scored pretty close to 1 in FY2020-21. Firms 2, 6, and 8 finished with a mean efficiency score of more than 0.9. Table 8: Year-wise DMUs Efficiency Scores FY2016-17 FY2017-18 FY2018-19 FY2019-20 FY2020-21 Avg. Rank Firm 1 1 1 1 1 1 1 1 Firm 2 0.8893 0.9047 0.9747 0.9713 0.9667 0.94134 6 Firm 3 1 1 1 1 1 1 1 Firm 4 1 1 1 1 0.9505 0.9901 4 Firm 5 0.3112 0.4838 1 0.9532 0.306 0.61084 12 Firm 6 1 1 1 1 0.6484 0.92968 7 Firm 7 0.8501 0.6927 0.694 0.87 0.9452 0.8104 8 Firm 8 0.9265 0.8469 1 1 1 0.95468 5 Firm 9 0.3911 0.331 0.3085 0.3259 0.4601 0.36332 14 Firm 10 0.3907 0.72 1 0.9736 0.8823 0.79332 9 Firm 11 1 1 1 1 1 1 1 Firm 12 1 0.685 0.8696 0.773 0.6311 0.79174 10 Firm 13 0.8998 0.6311 0.6284 0.7212 0.8229 0.74068 11 Firm 14 0.548 0.3465 0.2776 0.5136 1 0.53714 13 *Avg. data computed based on FY2016-17 to FY2020-21 data. 4.2 Minerals and Metals-based Industry Table 9 presents the year-wise data on no. of efficient DMUs in each year, the average efficiency scores, and the standard deviations. One could assume from this table that DMUs, on average, have performed rather worse in fiscal years the last three years. This is 0 0.1 0.2 0.3 0.4 0.5 0.6 0.7 0.8 0.9 1 FY2016-17 FY2017-18 FY2018-19 FY2019-20 FY2020-21 Efficiency DMU
- 11. International Journal of Engineering and Management Research e-ISSN: 2250-0758 | p-ISSN: 2394-6962 Volume-11, Issue-5 (October 2021) www.ijemr.net https://doi.org/10.31033/ijemr.11.5.4 32 This Work is under Creative Commons Attribution-NonCommercial-NoDerivatives 4.0 International License. also indicated in Table 10 where we see that the net profit margin is worse in the previous three years. The average return on asset and ROCE are at their peak in FY2020-21, however. Since a simple comparison of output without taking into account the input resources may be misleading, we ran a DEA with fiscal years as DMUs and the average output/input scores. Figure 7 illustrates the comparison of the financial performance of all 18 DMUs, combined, throughout the five-year period. One may observe the performance of these DMUs were at their best in 2017-18 and 2020-21. Their performance was close to a perfect score of 1 in 2016- 17, while the industry saw troublesome performance in fiscal years 2018-19 and 2019-20. Table 9: Avg. Efficiency and the Number of Efficient DMUs between 2016-17 to 2020-21 FY2016-17 FY2017-18 FY2018-19 FY2019-20 FY2020-21 Total no. of DMUs 18 18 18 18 18 No. of efficient DMUs 7 3 1 1 4 Avg. efficiency 0.7635 0.6031 0.4442 0.3008 0.5316 Maximum 1 1 1 1 1 Minimum 0.1858 0.1078 0.0848 0 0.1318 Std. Deviation 0.2845 0.3155 0.28 0.2673 0.3019 *Avg. data computed based on FY2016-17 to FY2020-21 data. Table 10: Avg. Output/Input Values between 2016-17 to 2020-21 FY2016-17 FY2017-18 FY2018-19 FY2019-20 FY2020-21 Net profit margin (%) 9.48 9.39 8.92 7.21 11.30 Return on asset (%) 8.43 8.45 8.16 4.98 9.65 ROCE (%) 18.49 19.62 18.54 8.72 19.83 Current ratio 1.57 1.44 1.67 1.80 1.96 Quick ratio 1.03 0.94 1.09 1.21 1.34 Asset turnover ratio (%) 137.61 141.57 148.45 140.78 111.75 *Avg. data computed based on FY2016-17 to FY2020-21 data. Figure 7: Industrial Efficiency of Sample Units (based on industrial mean values) Table 11 presents compiles the efficiency scores of all 18 minerals and metal-based industry enterprises. It also gives an average efficiency score for each firm and ranks each of them a rank based on their average efficiency score over the study period of five years between 2016-17 to 2020-21. Only one DMU, firm 25, was efficient throughout the five-year period. Firms 15 and 22 came close at an average efficiency score of above .8. 0 0.2 0.4 0.6 0.8 1 1.2 FY2016-17 FY2017-18 FY2018-19 FY2019-20 FY2020-21 Comparison of performance of 18 DMUs throughout the 5-year period
- 12. International Journal of Engineering and Management Research e-ISSN: 2250-0758 | p-ISSN: 2394-6962 Volume-11, Issue-5 (October 2021) www.ijemr.net https://doi.org/10.31033/ijemr.11.5.4 33 This Work is under Creative Commons Attribution-NonCommercial-NoDerivatives 4.0 International License. Table 11: Efficiency of Sample Units between 2016-17 to 2020-21 FY2016-17 FY2017-18 FY2018-19 FY2019-20 FY2020-21 Avg. Rank Firm 15 1 1 0.8064 0.7564 0.6417 0.8409 2 Firm 16 0.2637 0.2637 0.1338 0.0961 0.2247 0.1964 17 Firm 17 0.1078 0.1078 0.0848 0.052 0.1524 0.10096 18 Firm 18 0.5764 0.5764 0.7267 0 0.2472 0.42534 11 Firm 19 0.2502 0.2502 0.2463 0.3082 0.5 0.31098 14 Firm 20 0.9624 0.9624 0.5214 0.407 1 0.77064 4 Firm 21 0.2933 0.2933 0.2678 0.1627 0.2572 0.25486 15 Firm 22 0.9924 0.9924 0.793 0.3358 1 0.82272 3 Firm 23 0.5107 0.5107 0.3981 0.4117 0.5657 0.47938 9 Firm 24 0.9633 0.9633 0.6787 0.4752 0.3994 0.69598 5 Firm 25 1 1 1 1 1 1 1 Firm 26 1 1 0.1905 0.0001 1 0.63812 6 Firm 27 0.5042 0.5042 0.2073 0.1832 0.3898 0.35774 12 Firm 28 0.653 0.653 0.749 0.3398 0.4106 0.56108 7 Firm 29 0.2967 0.2967 0.1598 0.1154 0.1318 0.20008 16 Firm 30 0.7176 0.7176 0.39 0.1086 0.7215 0.53106 8 Firm 31 0.4157 0.4157 0.3718 0.5196 0.41 0.42656 10 Firm 32 0.3489 0.3489 0.2706 0.1429 0.5171 0.32568 13 *Avg. data computed based on FY2016-17 to FY2020-21 data. 4.3 Plastic, Chemical and Petro-based Industry Table 12 presents the year-wise data on no. of efficient DMUs in each year, the average efficiency scores, and the standard deviations. One could assume from this table that DMUs, on average, have given consistent performance throughout the five-year period. Table 13 presents average output/input values (of all 19 DMUs). It can be observed that the net profit margin declined sharply in the first two years between 2016-18 and has remained consistent ever since. Return on asset and ROCE have somewhat remained consistent throughout the five-year period. Since a simple comparison of output without taking into account the input resources may be misleading, we ran a DEA with fiscal years as DMUs and the average output/input scores. Figure 8 illustrates the comparison of the financial performance of all 19 DMUs, combined, throughout the five-year period. One should be conscious while taking note from the graph in Figure 8 since it‟s a comparison of the industry between 2016-21, it does not indicate that the industry was efficient in 3 out of 5 years, just that they did better in comparison to the rest two. Table 12: Avg. Efficiency & Number of the Efficient DMUs between 2016-17 to 2020-21 FY2016-17 FY2017-18 FY2018-19 FY2019-20 FY2020-21 Total no. of DMUs 19 19 19 19 19 No. of efficient DMUs 5 6 3 5 5 Avg. efficiency 0.6712 0.758 0.6667 0.7063 0.6406 Maximum 1 1 1 1 1 Minimum 0.0002 0.2334 0.2533 0.0275 0 Std. Deviation 0.3266 0.2376 0.2102 0.2736 0.3153 *Avg. data computed based on FY2016-17 to FY2020-21 data. Table 13: Avg. Output/Input Values between 2016-17 to 2020-21 FY2016-17 FY2017-18 FY2018-19 FY2019-20 FY2020-21 Net profit margin (%) 13.38 10.14 7.26 7.50 8.79 Return on asset (%) 6.36 7.48 6.52 5.85 6.23 ROCE (%) 14.90 17.50 18.11 13.09 14.79 Current ratio 1.79 1.98 1.84 1.92 1.94 Quick ratio 1.12 1.28 1.13 1.21 1.19 Asset turnover ratio (%) 94.01 104.71 114.56 100.25 90.19 *Avg. data computed based on FY2016-17 to FY2020-21 data.
- 13. International Journal of Engineering and Management Research e-ISSN: 2250-0758 | p-ISSN: 2394-6962 Volume-11, Issue-5 (October 2021) www.ijemr.net https://doi.org/10.31033/ijemr.11.5.4 34 This Work is under Creative Commons Attribution-NonCommercial-NoDerivatives 4.0 International License. Figure 8: Year-wise Industrial Efficiency Table 14 compiles the efficiency scores of all 19 DMUs. It also gives an average efficiency score for each firm and ranks each of them a rank based on their average efficiency score over the study period of five years between 2016-17 to 2020-21. Firms 38, 44, and 45 were efficient throughout the five-year period. Firm 37 came close with an avg. score of above .97. Table 14: Year-wise Efficiency Score of DMUs FY2016-17 FY2017-18 FY2018-19 FY2019-20 FY2020-21 Avg. Rank Firm 33 0.7768 0.879 0.7143 0.3773 0.8936 0.7282 7 Firm 34 0.8354 1 0.7443 0.8146 0.1897 0.7168 8 Firm 35 0.6771 0.6635 0.6438 0.5413 0.3276 0.57066 14 Firm 36 0.8436 0.3639 0.313 0.5629 0 0.41668 19 Firm 37 0.9452 1 0.9145 1 1 0.97194 4 Firm 38 1 1 1 1 1 1 1 Firm 39 0.3886 0.733 0.5928 0.5534 0.6808 0.58972 12 Firm 40 0.7954 0.7884 0.4872 0.0275 0.6218 0.54406 17 Firm 41 0.5145 1 0.4453 0.3415 0.5642 0.5731 13 Firm 42 0.766 0.5233 0.2533 0.8215 0.3709 0.547 15 Firm 43 0.3144 0.6298 0.6549 1 0.4814 0.6161 11 Firm 44 1 1 1 1 1 1 1 Firm 45 1 1 1 1 1 1 1 Firm 46 0.0002 0.2334 0.6679 0.8346 0.9865 0.54452 16 Firm 47 0.1591 0.5446 0.6131 0.7706 1 0.61748 10 Firm 48 1 0.7853 0.649 0.8732 0.6854 0.79858 5 Firm 49 0.5752 0.7573 0.6635 0.5408 0.6023 0.62782 9 Firm 50 0.1622 0.5363 0.6013 0.5369 0.328 0.43294 18 Firm 51 1 0.9643 0.7097 0.8227 0.4385 0.78704 6 *Avg. data computed based on FY2016-17 to FY2020-21 data. 0 0.1 0.2 0.3 0.4 0.5 0.6 0.7 0.8 0.9 1 FY2016-17 FY2017-18 FY2018-19 FY2019-20 FY2020-21 Efficiency DMU
- 14. International Journal of Engineering and Management Research e-ISSN: 2250-0758 | p-ISSN: 2394-6962 Volume-11, Issue-5 (October 2021) www.ijemr.net https://doi.org/10.31033/ijemr.11.5.4 35 This Work is under Creative Commons Attribution-NonCommercial-NoDerivatives 4.0 International License. V. CONCLUSION MSMEs have played a great role in the Indian economy. They have been the greatest source of local jobs in the Indian economy, and they do so at a relatively low capital cost. MSMEs are also noted for their role in industrializing underdeveloped and rural regions, in eliminating regional imbalances, and in ensuring a fairer distribution of income. In fact, a majority of all MSMEs are based in rural area (NSS 73rd round). One in every five MSMEs are owned and run by female entrepreneurs and every fourth job position in these enterprises are held by a woman worker (NSS 73rd round). Approx. 65% of these firms are run by backward classes, e.g., SC, ST, and OBC (NSS 73rd round). MSMEs also account for a third of the national gross value added and are therefore an indispensable part of the national economy. The agro and cotton-based enterprises gave their best output with minimum resources in 2020-21, even though the number of efficient DMUs were less in 2020-21 (5) than in 2016-17 (6), 2018-19 (8), or 2019-20 (6). One could observe that the average profitability was maximum in 2020-21 than in any other fiscal year. Three of 14 agro and cotton-based firms were efficient throughout the five-year period. 4 units gave consistently good performance over the period between 2016-17 to 2020-21. The rest seven DMUs gave inconsistent performance or were consistently poor performers throughout the five-year period between 2016-17 to 2020-21. The minerals and metals-based industry, as a group, was efficient in 2017-18 and 2020-21. The average net profit margin was highest for the fiscal year 2017-18 (50%) than for any other period. Over the five- year period, though, the industry seems to have witnessed unequal growth. The number of efficient DMUs in 2020-21 were just 4, as compared to 7 for the period 2016-17. The average efficiency score in 2020-21 (0.5316) was 0.23 points lower than that for the period 2016-17 (0.7635). The average net profit margin as well as the return on asset and ROCE were all at their peak in 2020-21 (11.3, 9.65, and 19.83, respectively) than in any other period. Thus, as an industry, the fiscal year 2020- 21 outperformed other periods with greater returns, which is primarily due to a handful of DMUs outperforming the rest in recent years (as indicated by the lower number of efficient DMUs in 2020-21 than 2016-17). As an industry group, the plastic, chemical and petro-based industry gave consistent performance throughout the five-year period (except in the year 2019- 20) (Figure 8). The number of efficient DMUs too have remained around ~5 throughout the study period (except for the year 2018-19), with the average efficiency of around 0.65 to 0.70. The return for every rupee invested in the industry (measured in return on asset and ROCE) have remained consistent around 6-7% (return on asset) and 14-18% (ROCE). The net profit margin, however, have declined from 13.38% in 2016-17 to only 8.79% in 2020-21. 3 out of 19 DMUs scored a perfect efficient score of 1 throughout the study period, another one had an average efficiency score of 0.97 between 2016-17 and 2020-21. Other firms scored between 0.4 to 0.7 on average in the study period. This indicates that, except for a handful of excellent performing DMUs, others gave equitable performance. However, those handful of DMUs also show the true potential and profit prospect of the industry that other DMUs too may adapt. In the case of all three industry groups, one could observe that a handful of DMUs set the benchmark with consistent and excellent outputs, churning maximum return for every rupee invested in the company. Other DMUs were either inconsistent with their performance or gave poor consistent outputs throughout the five-year period. Weighted data for individual firms could be found in relevant sections, for a majority of DMUs though, greater weightages were assigned to return on asset and return on capital employed. REFERENCES [1] Arieftiara, D., Utama, S., Wardhani, R., & Rahayu, N. (2019). Contingent fit between business strategies and environmental uncertainty: The impact on corporate tax avoidance in Indonesia. Meditari Accountancy Research. [2] Aydemir, A. C., Gallmeyer, M., & Hollifield, B. (2007). Financial leverage and the leverage effect-a market and firm analysis. Tepper School of Business, 142. [3] Bebczuk, R. & Galindo, A. J. (2010). Corporate leverage, the cost of capital, and the financial crisis in Latin America. Available at: SSRN 1577687. [4] Bhalla, A. & Kaur, M. (2012) „SMEs‟ access to finance: An analysis of attitude and decision-making criteria of commercial banks. Asia-Pacific Journal of Management Research and Innovation, 8(1), 69–76. [5] Bhunia, A. (2012). The impact of liquidity on profitability: A case study of FMCG companies in India. Research and Social Practices in Social Sciences, 7(2), 44-58. [6] Binks, M. R. & Ennew, C. T. (1996). Growing firms and the credit constraint. Small Business Economics, Special Issue on Financing and Small Firm Dynamics, 8(1), 17-25. [7] Bouchard, B., Kabanov, Y. M., & Touzi, N. (2001). Option pricing by large risk aversion utility under transaction costs. Decisions in Economics and Finance, 24(2), 127-136. [8] Charnes, A., Cooper, W. W., & Rhodes, E. (1978). Measuring the efficiency of decision making units. European Journal of Operational Research, 2(6), 429-444.
- 15. International Journal of Engineering and Management Research e-ISSN: 2250-0758 | p-ISSN: 2394-6962 Volume-11, Issue-5 (October 2021) www.ijemr.net https://doi.org/10.31033/ijemr.11.5.4 36 This Work is under Creative Commons Attribution-NonCommercial-NoDerivatives 4.0 International License. [9] Chauvet, L. & Jacolin, L. (2017). Financial inclusion, bank concentration, and firm performance. World Development, 97, 1-13. [10] Chen, L. & Zhao, X. (2006). On the relation between the market-to-book ratio, growth opportunity, and leverage ratio. Finance Research Letters, 3(4), 253- 266. [11] Chiliya, W., Rungani, E. C., Chiliya, N., & Chikandiwa, C. T. (2015). The impact of risk on the financial performance of small medium enterprises in the construction industry in Eastern Cape, South Africa. Risk Governance and Control: Financial Markets and Institutions, 5(3), 224-234. [12] Dávid, S. & Kovács, L. (2019). The development of clearing services–paradigm shift. Economy and Finance: English-Language Edition of Gazdaság És Pénzügy, 6(3), 296-310. [13] Dess, G. G., Lumpkin, G. T., & Covin, J. G. (1997). Entrepreneurial strategy making and firm performance: Tests of contingency and configurational models. Strategic Management Journal, 18(9), 677-695. [14] Evans, D.S. & Boyan, J. (1989). An estimated model of entrepreneurial choice under liquidity constraints. Journal of Political Economy, 97(4), 808- 827. [15] Berger, A.N. & Udell, G.F. (1995) Relationship lending and lines of credit in small firm finance. Journal of Business, 68(3), 351-382. [16] Fecher, F., Kessler, D., Perelman, S., & Pestieau, P. (1993). Productive performance of the French insurance industry. Journal of Productivity Analysis, 4(1), 77-93. [17] Fenyves, V., Zsido, K. E., Bircea, I., & Tarnoczi, T. (2020). Financial performance of Hungarian and Romanian retail food small businesses. British Food Journal. [18] Frank, M. Z. & Goyal, V. K. (2008). Trade-off and pecking order theories of debt. Handbook of Empirical Corporate Finance, 135-202. [19] Government of India, Agriculture Census 2011-12. [20] Government of India, Census 2011. [21] Government of India, Factories Act 1948. [22] Government of India, Fourth All India Census of MSME. [23] Government of India, MSME Annual Report 2020- 21. [24] Government of India, NSS 73rd round. [25] Government of India, The Micro, Small, and Medium Enterprises Development Act, 2006 (MSMED). [26] Grigorian, D. & Manole, V. (2002). Determinants of commercial bank performance in transition: An application of data envelopment analysis (World Bank Policy Research Working Paper 2850). Washington, DC: The World Bank. [27] Grover, V., Teng, J., Segars, A. H., & Fiedler, K. (1998). The influence of information technology diffusion and business process change on perceived productivity: The IS executive's perspective. Information & Management, 34(3), 141-159. [28] Inc42. (2020). Ease of doing business from a msme perspective. Available at: https://inc42.com/resources/ease-of-doing-business- from-a-msme-perspective/. Accessed on: 18-09-2021. [29] Lee, D. Y. & Tsang, E. W. (2001). The effects of entrepreneurial personality, background and network activities on venture growth. Journal of Management Studies, 38(4), 583-602. [30] Letkiewicz, J. C. (2012). Self-control, financial literacy, and the financial behaviors of young adults. The Ohio State University. [31] Miller, D. & Friesen, P. H. (1984). A longitudinal study of the corporate life cycle. Management Science, 30(10), 1161-1183. [32] Ministry of MSME, Govt. of India. Brief industrial profile of Nanded district. Available at: http://dcmsme.gov.in/old/dips/IPS%20NANDED.pdf. [33] Nissim, D. & Penman, S. H. (2001). Ratio analysis and equity valuation: From research to practice. Review of Accounting Studies, 6(1), 109-154. [34] Rajan, R. G. & Zingales, L. (1995). What do we know about capital structure? Some evidence from international data. The Journal of Finance, 50(5), 1421- 1460. [35] Tumiwa, J. R. & Tuegeh, O. D. M. (2019). Microfinance and financial performance on SMEs in Manado–Indonesia. Available at: http://eworkcapital.com/microfinance-and-financial- performance-on-smes-in-manado-indonesia/.