Download to read offline

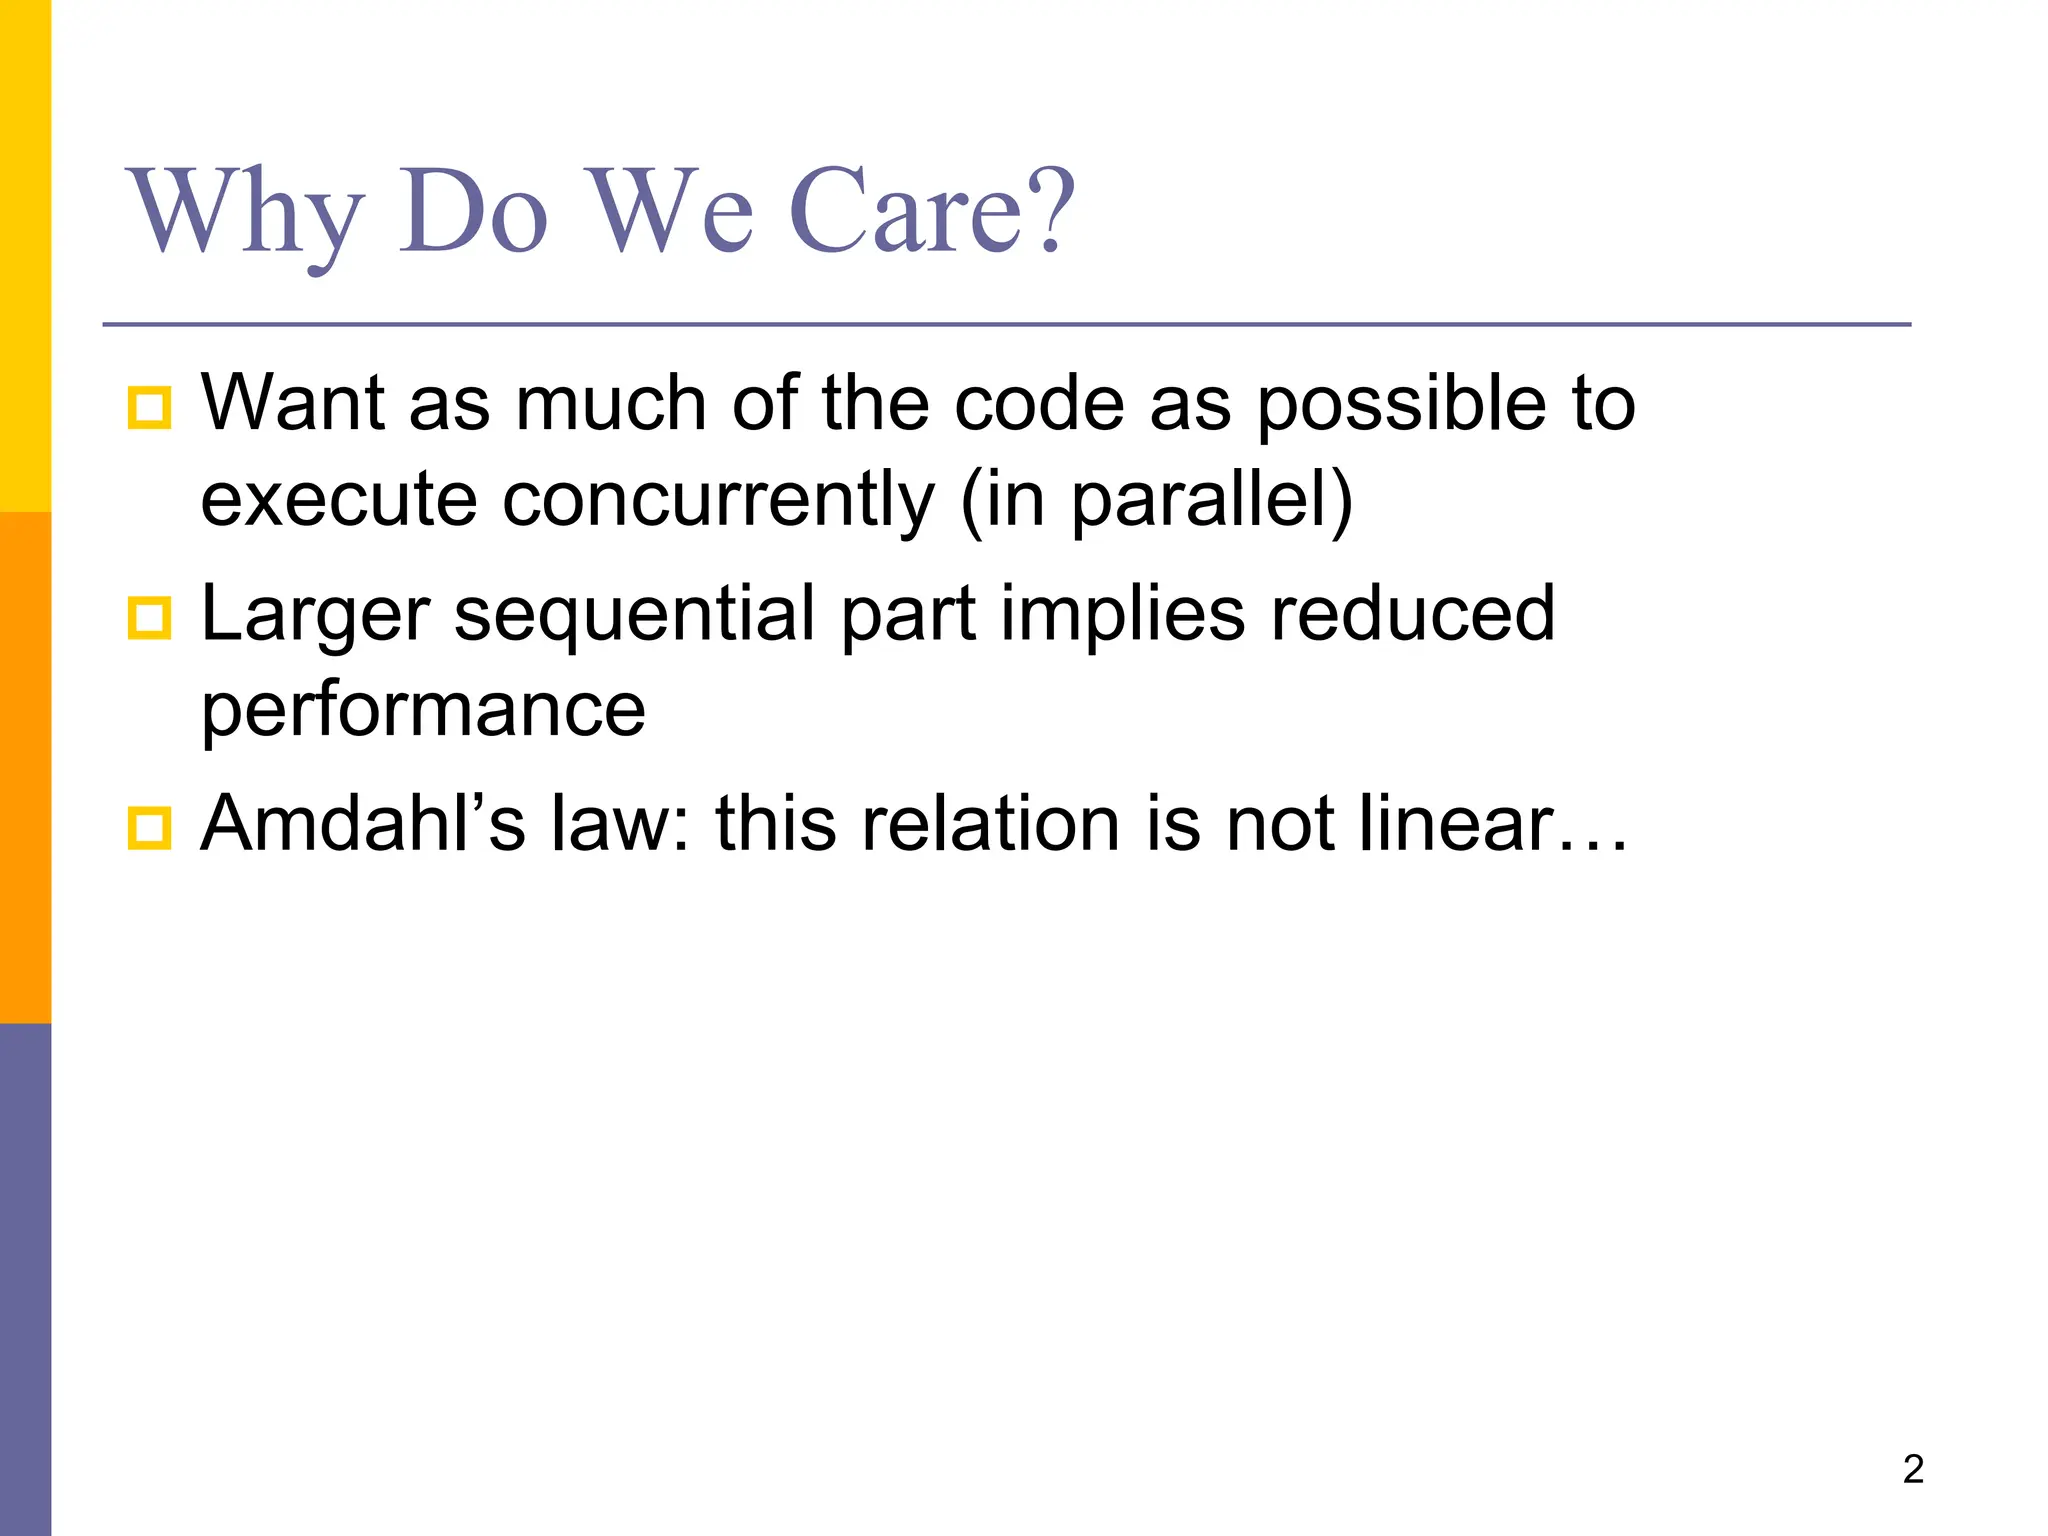
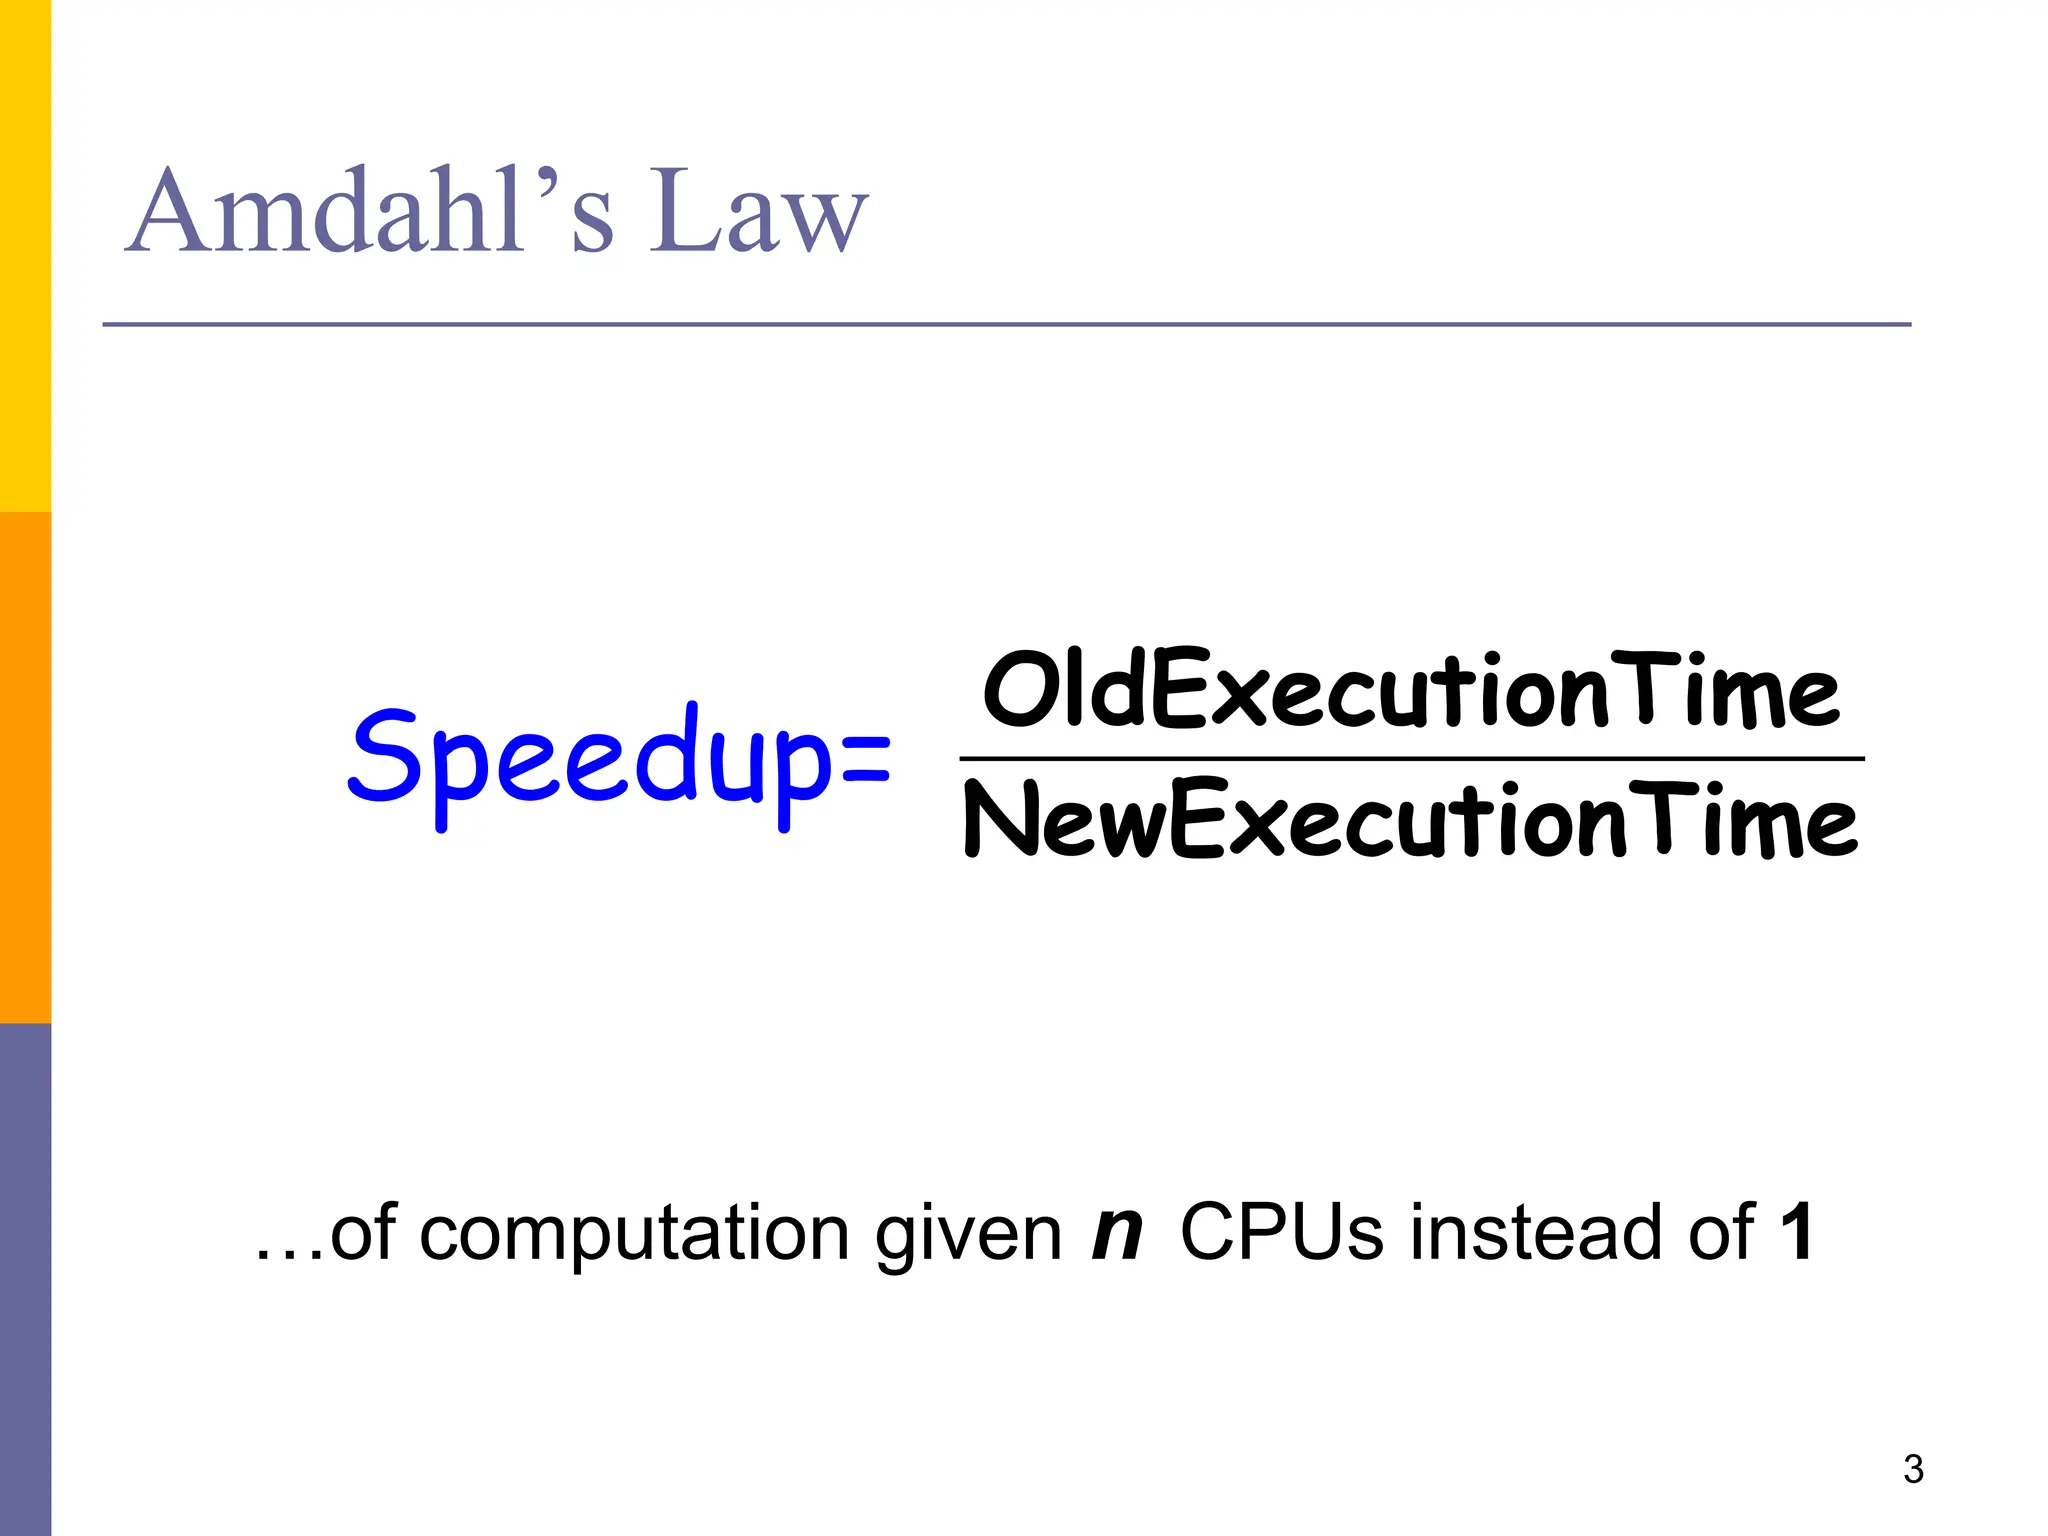
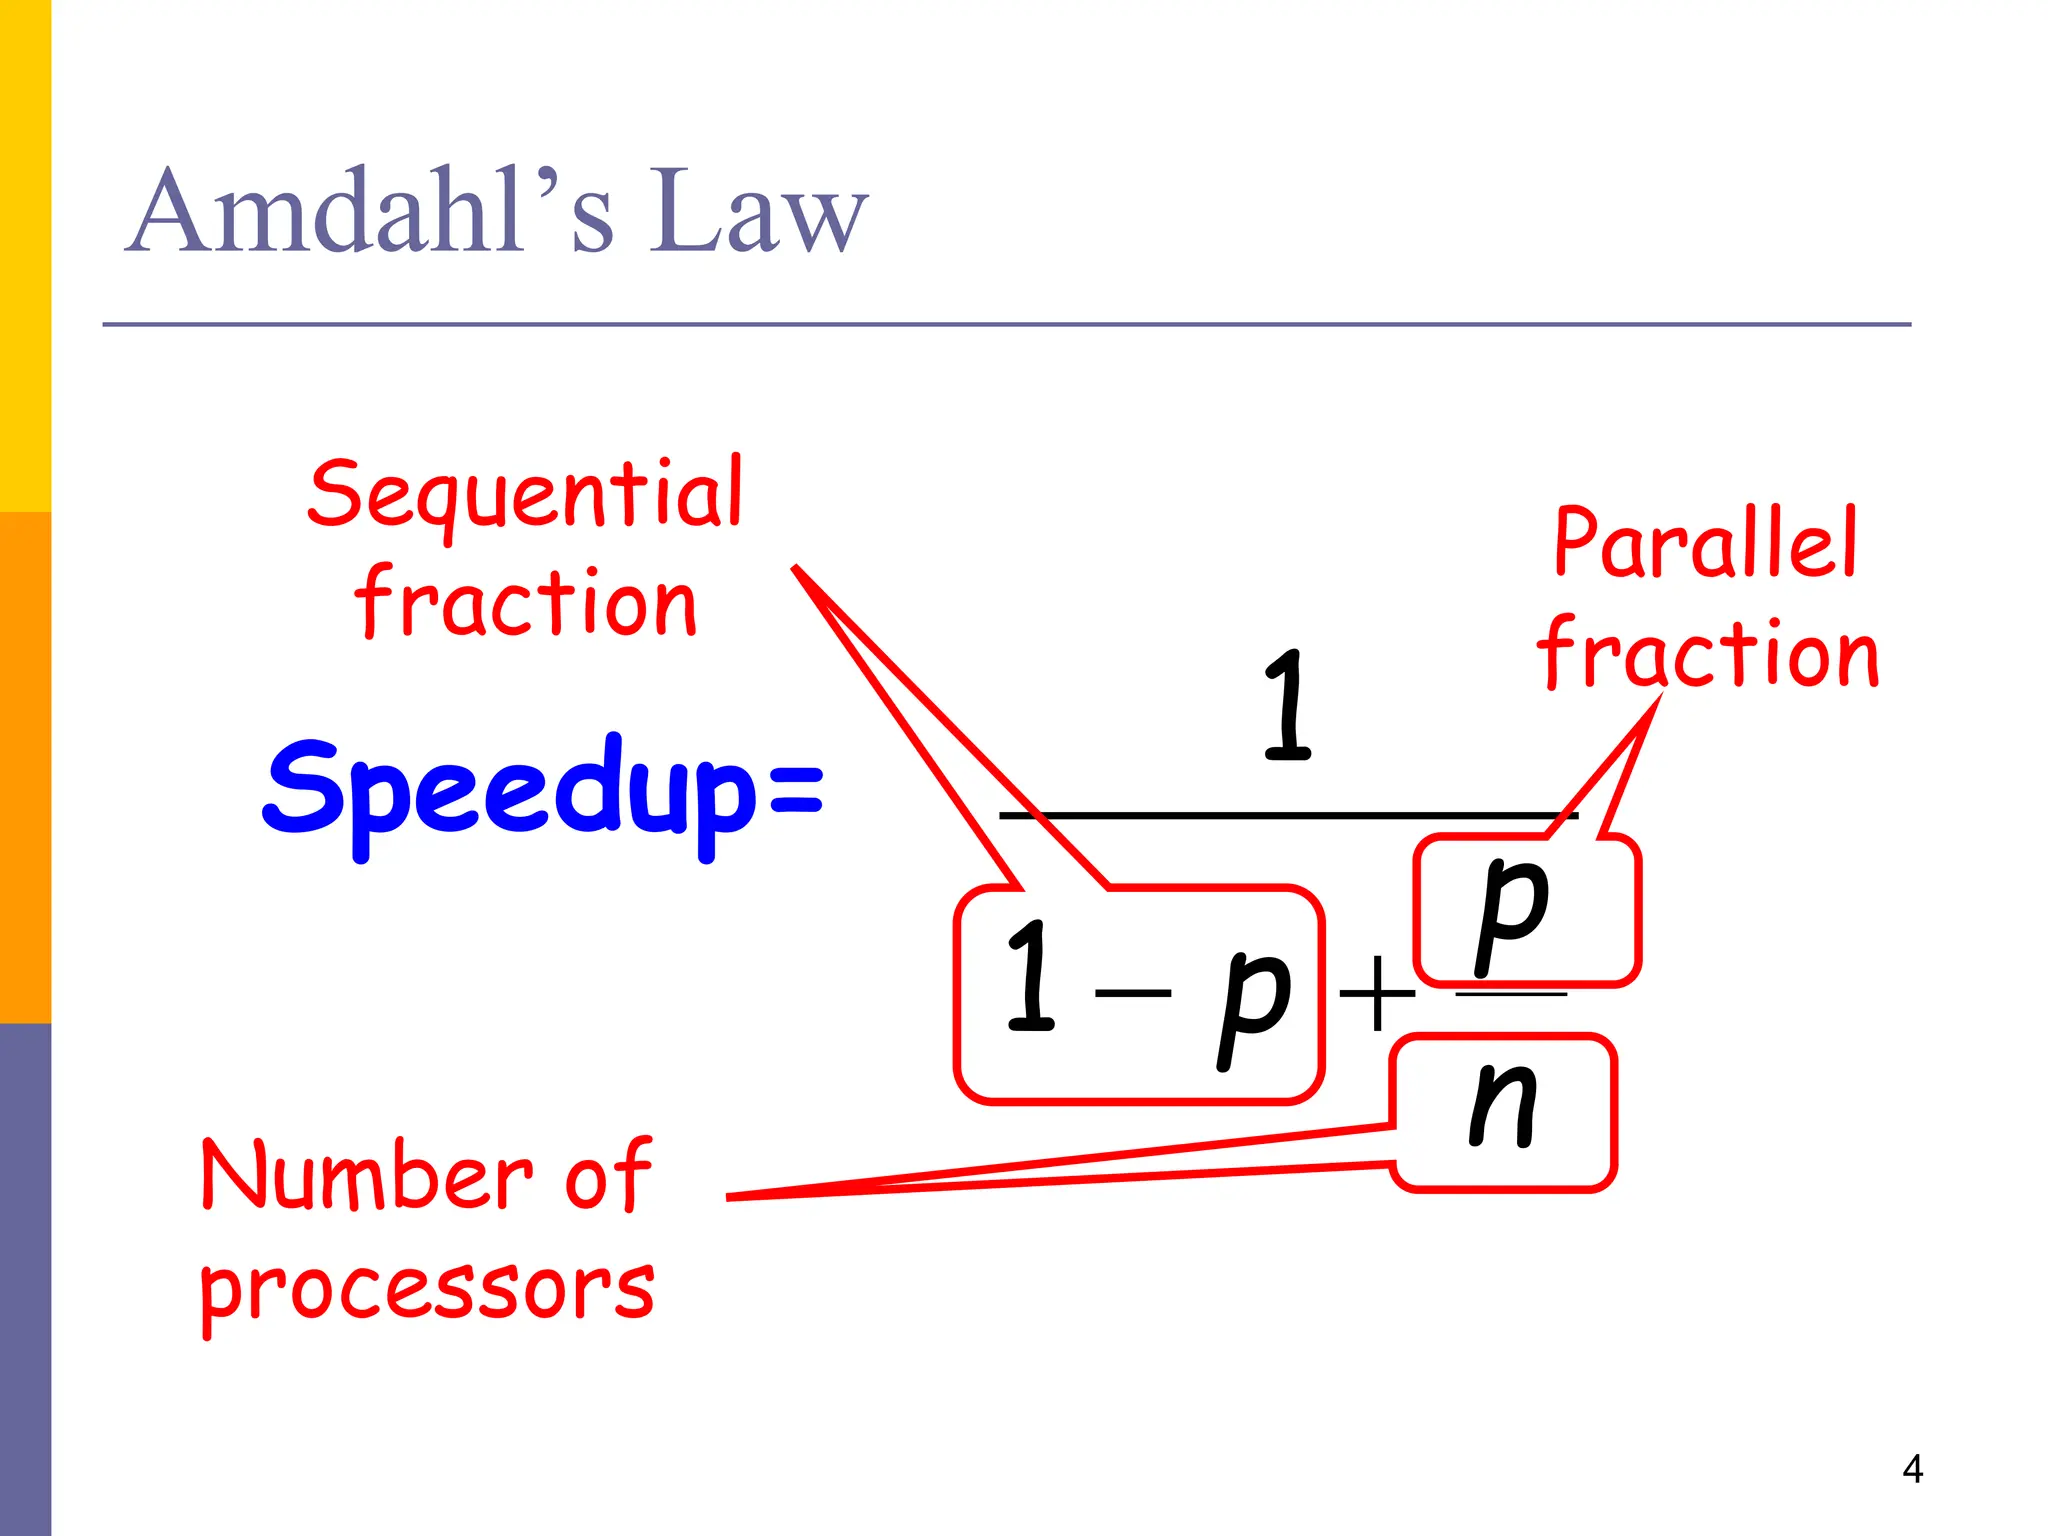

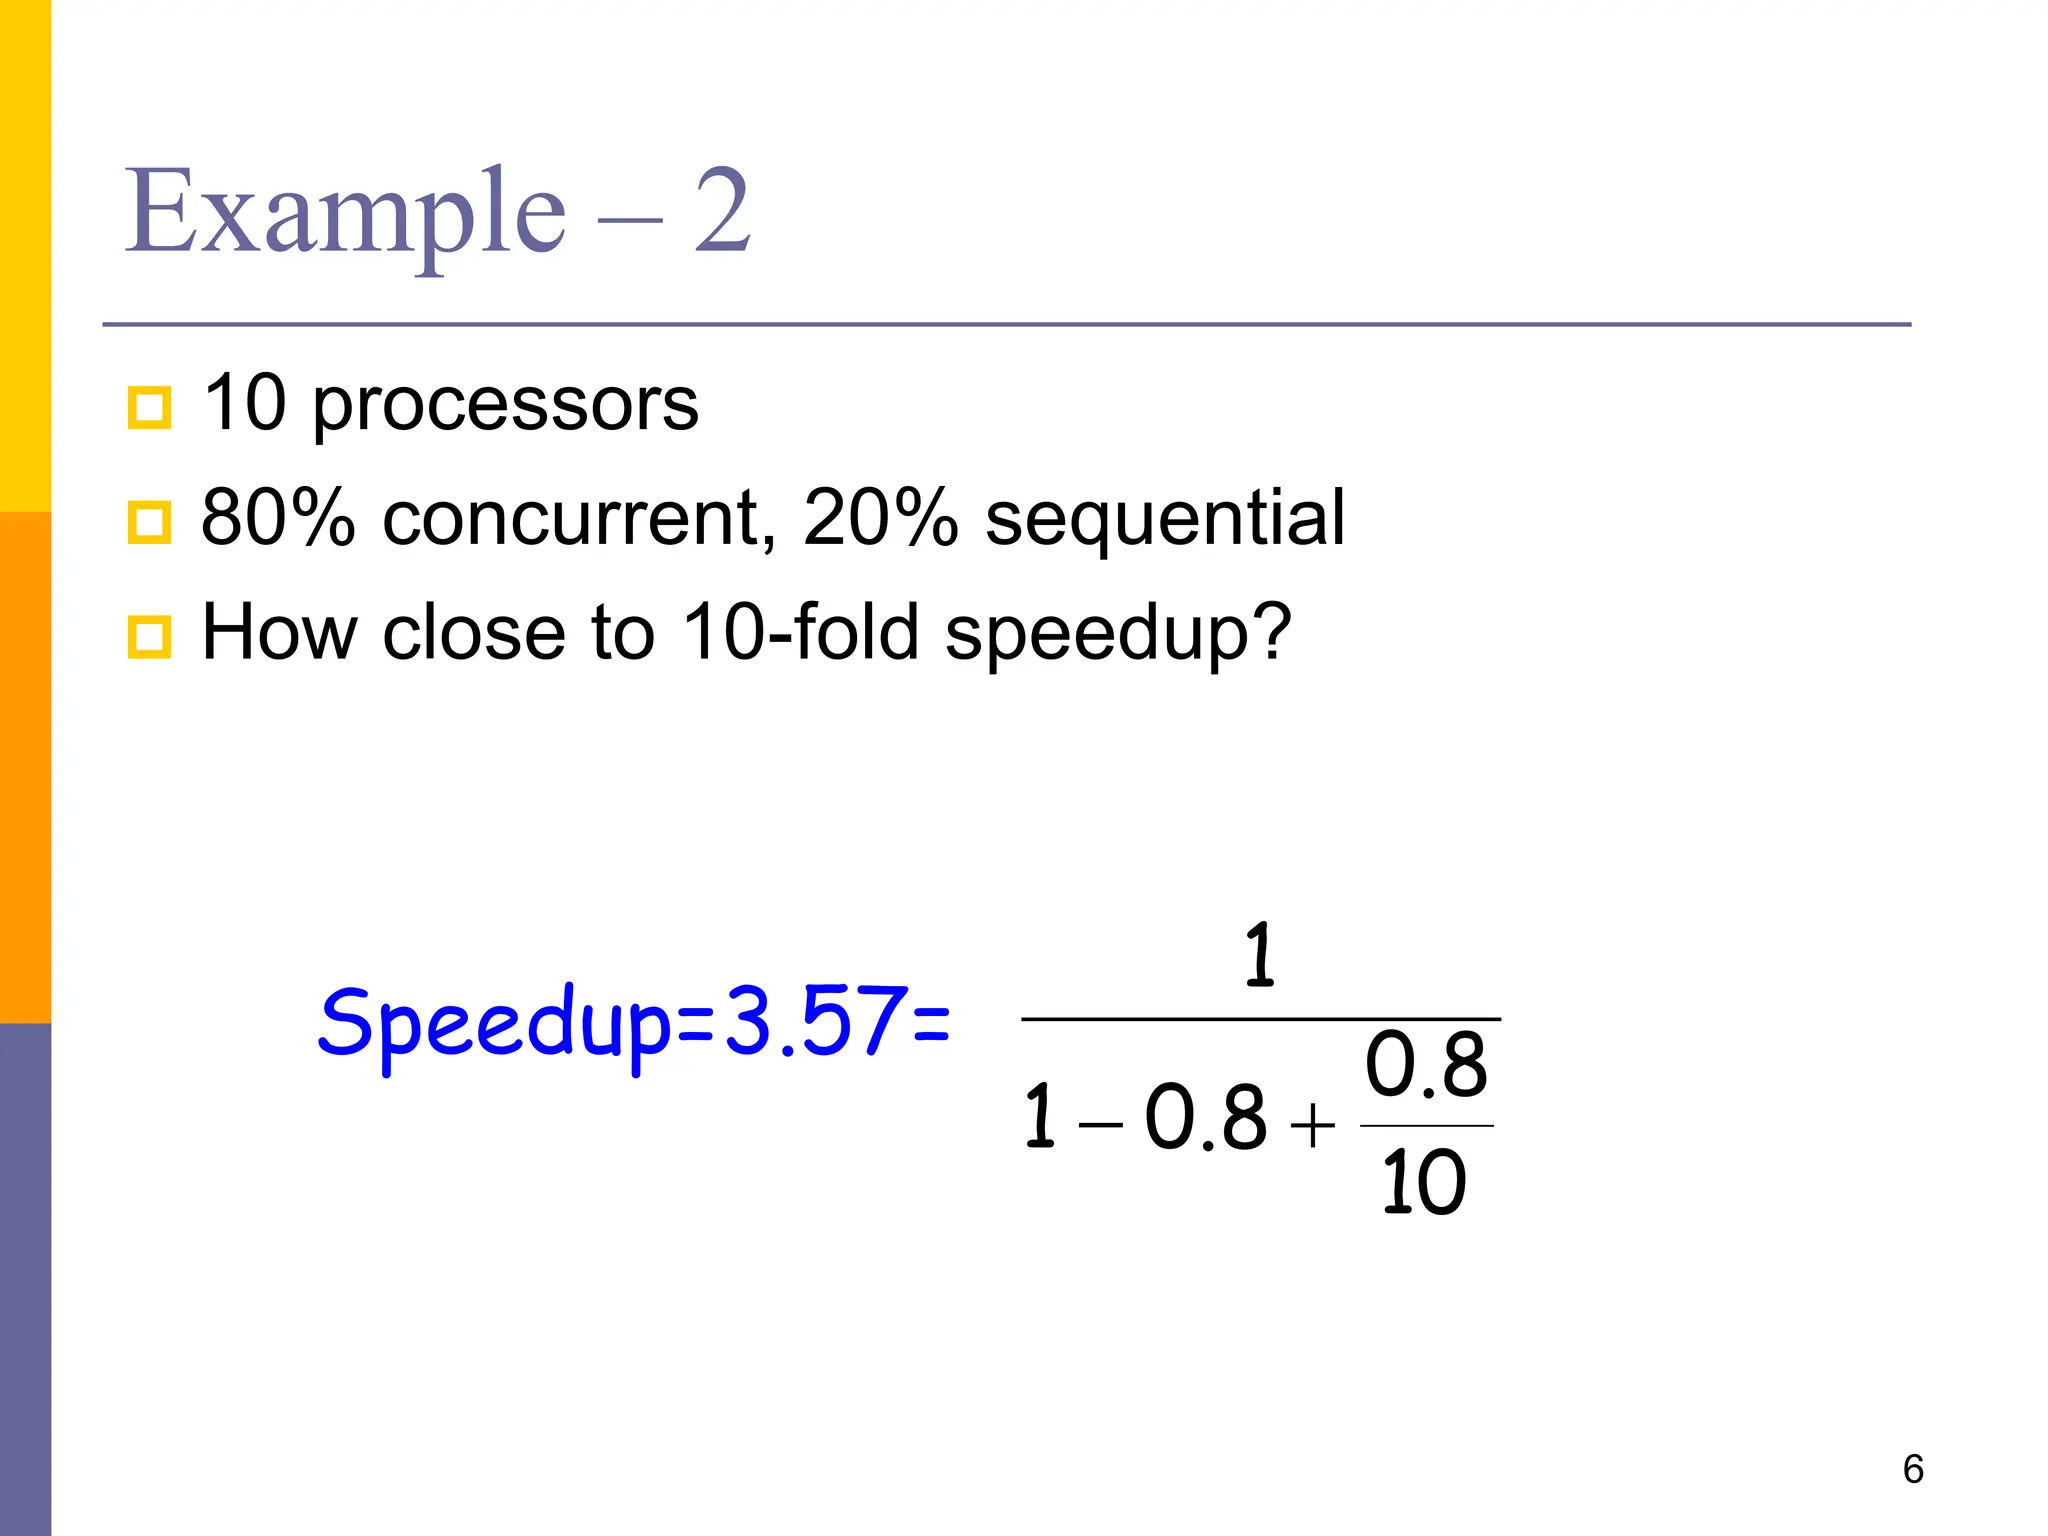

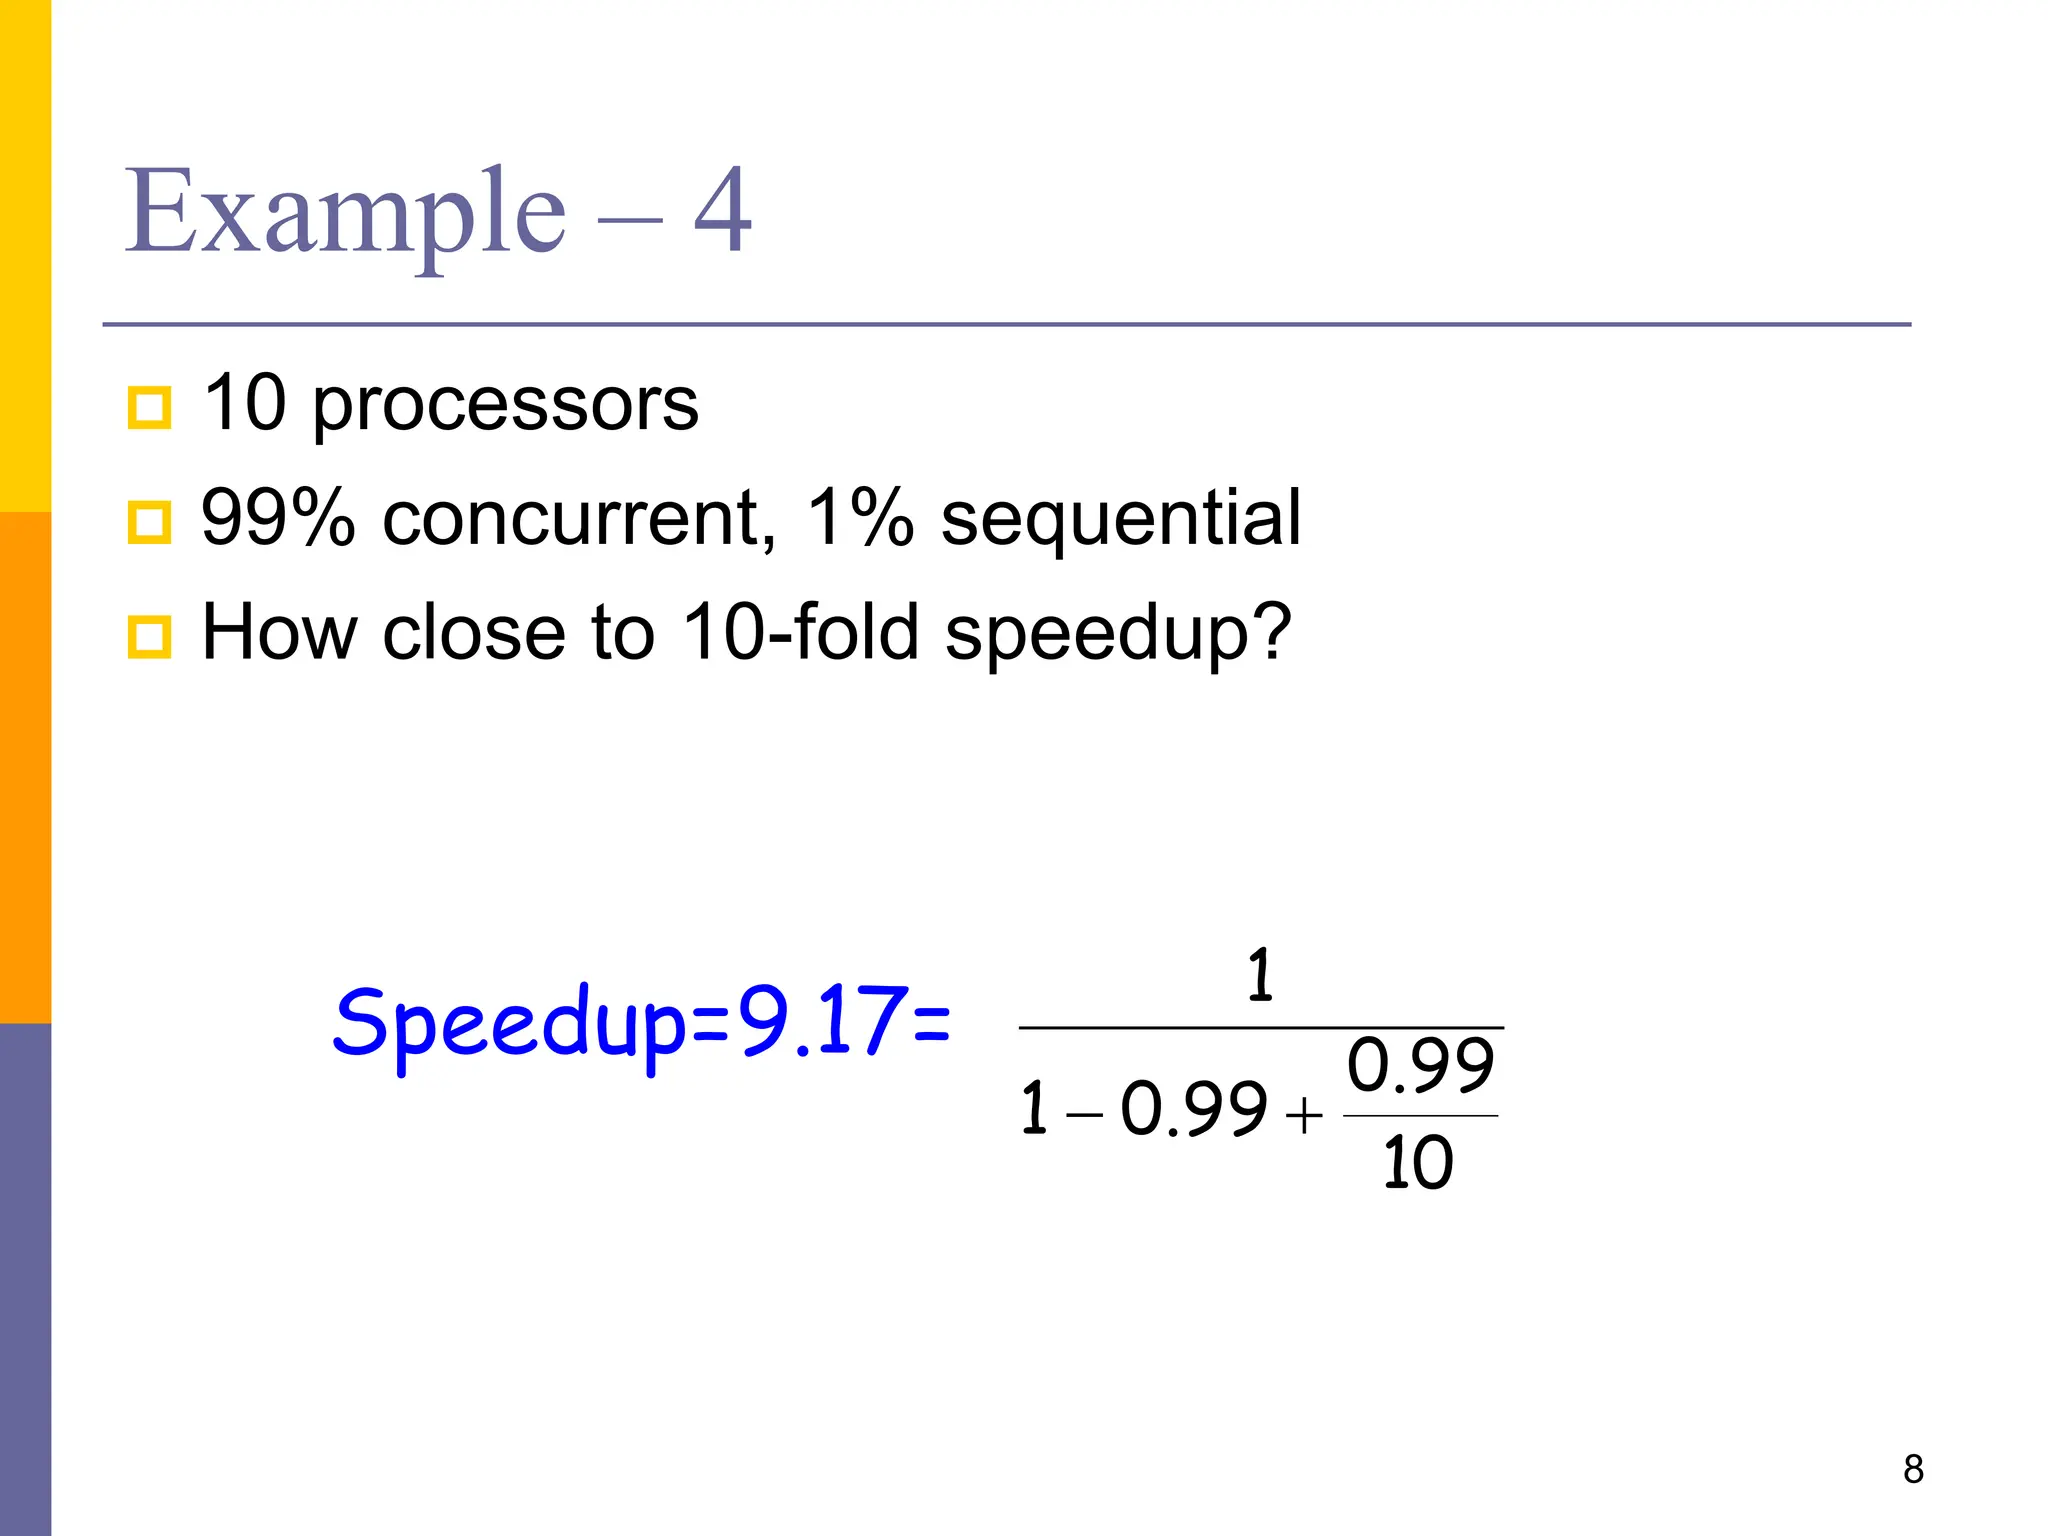
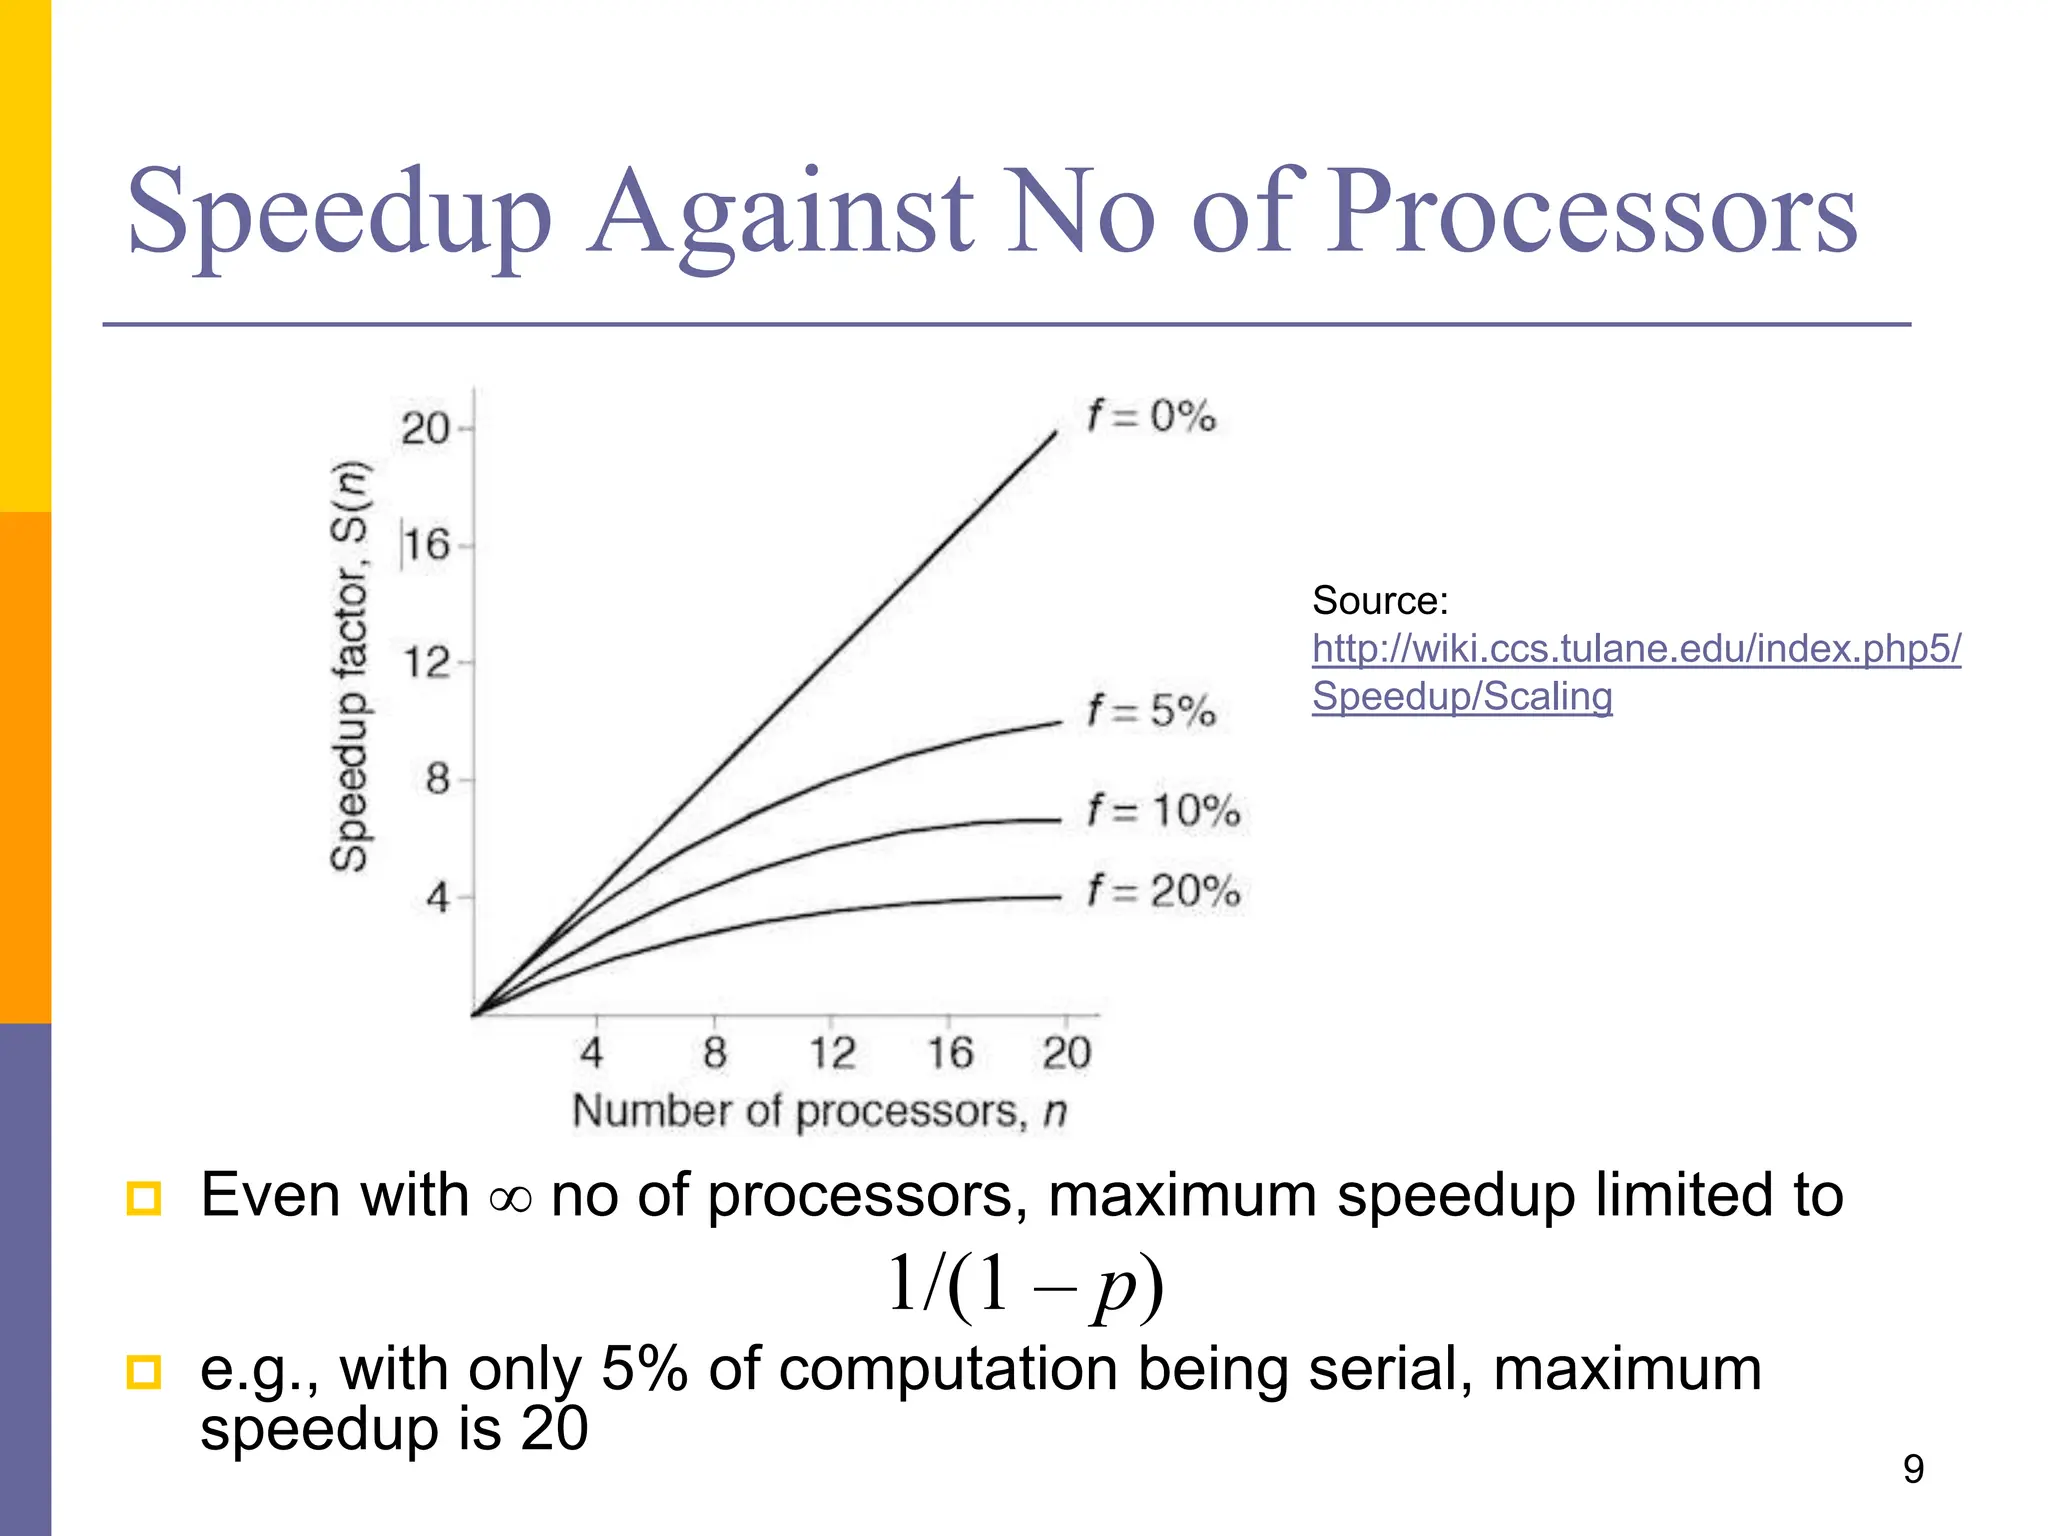
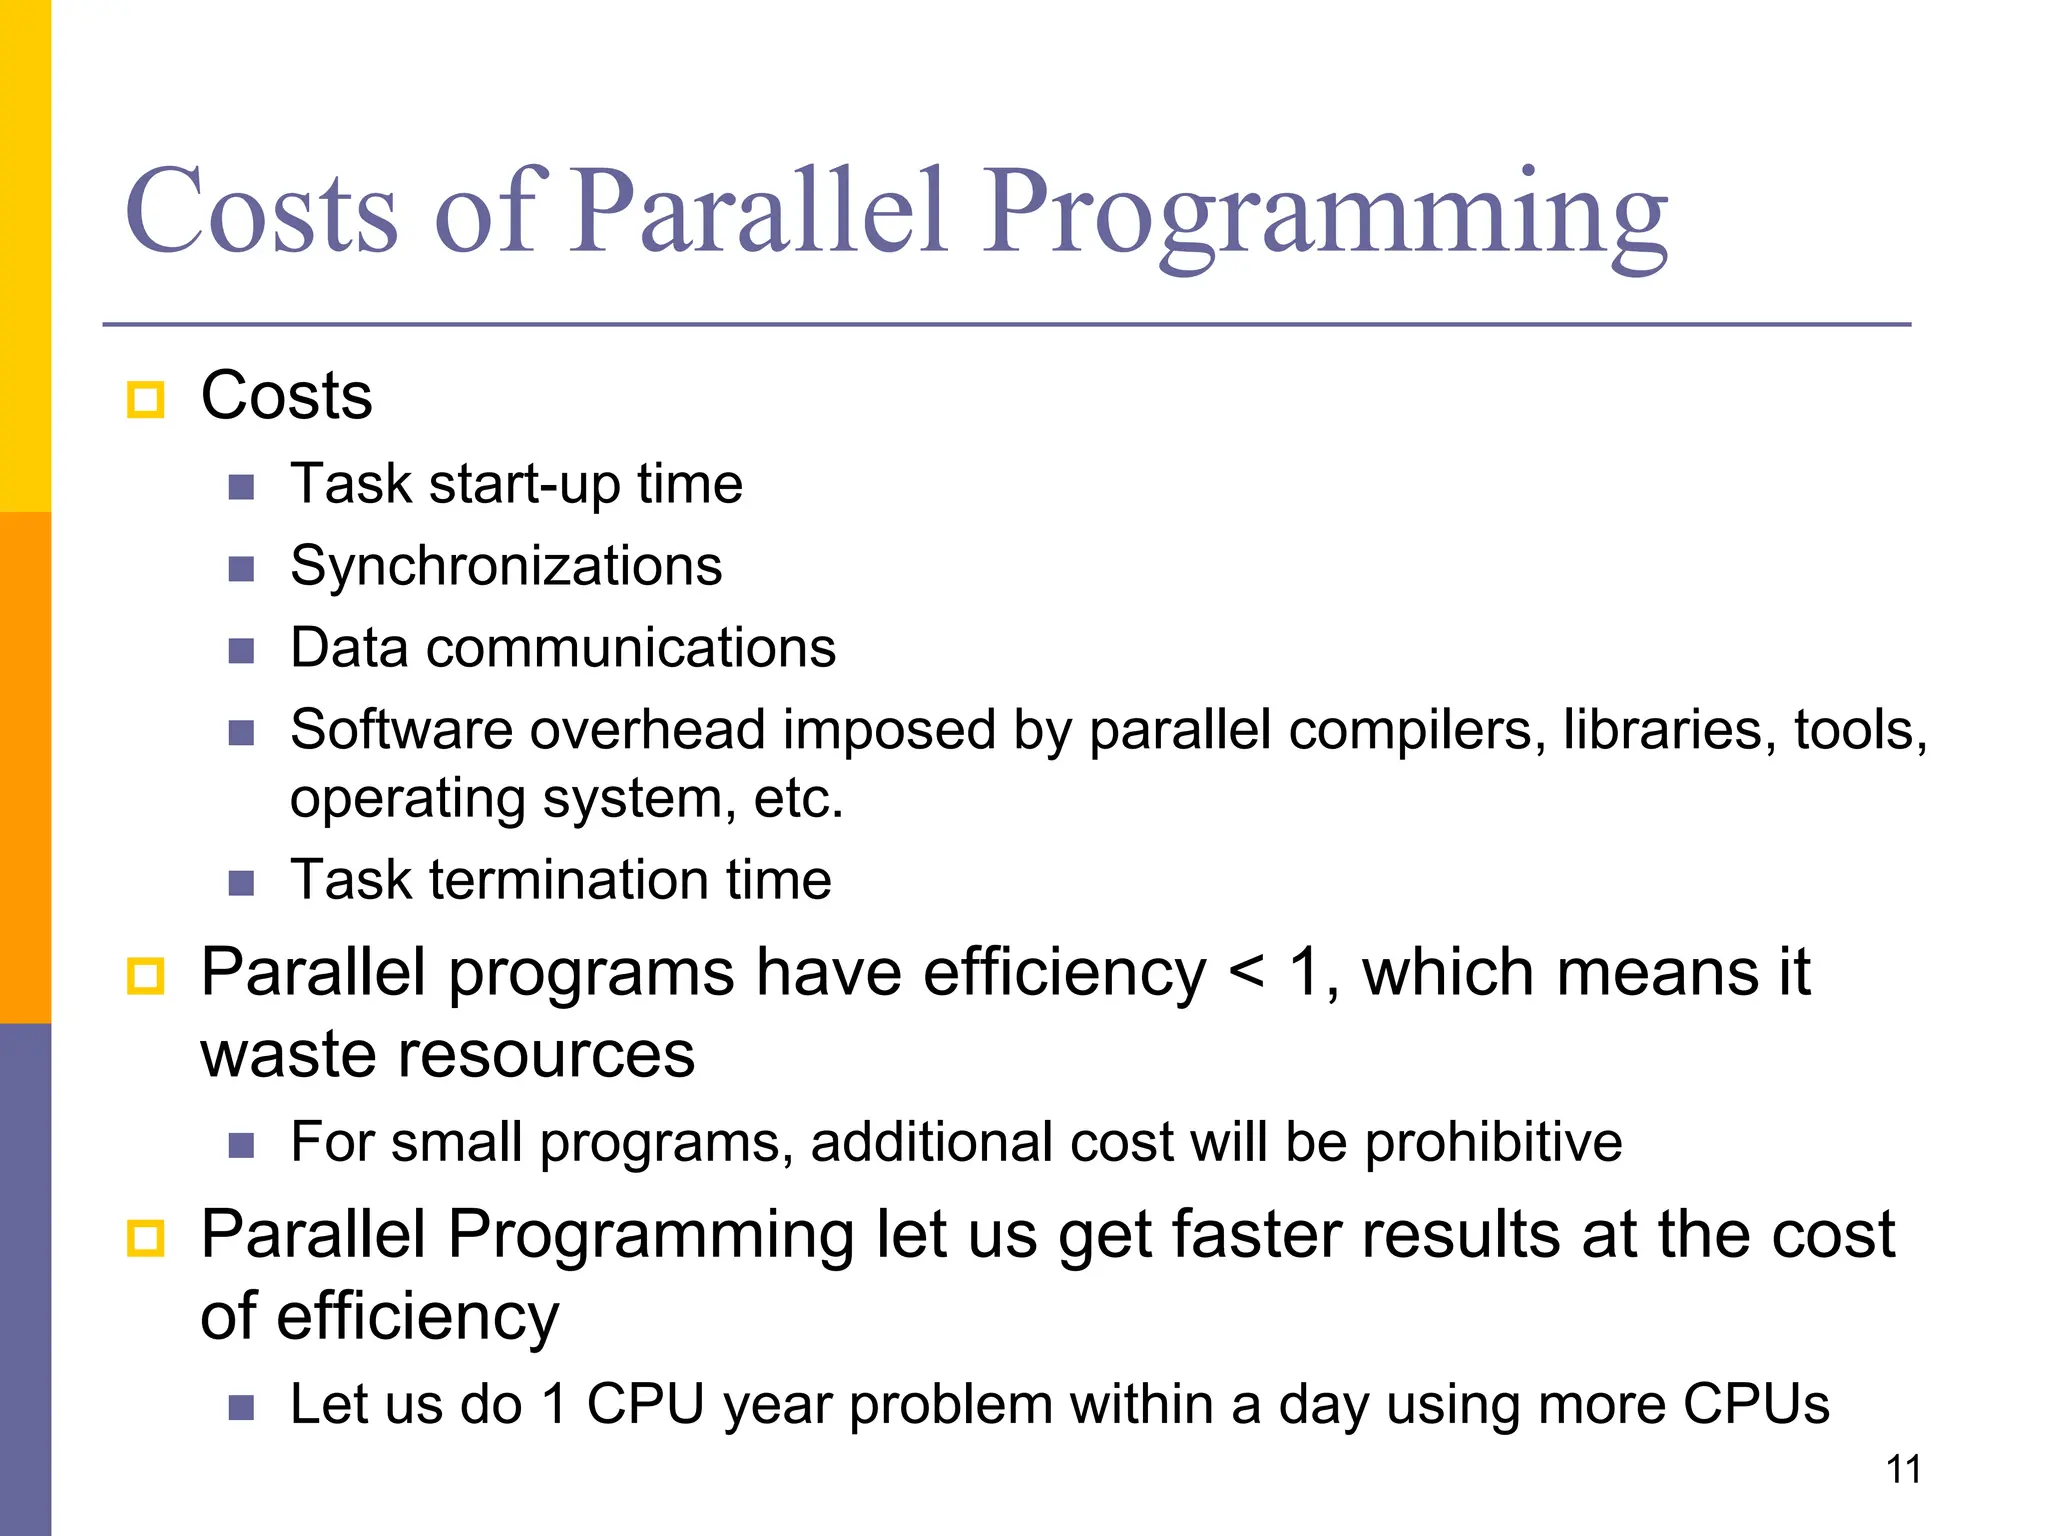
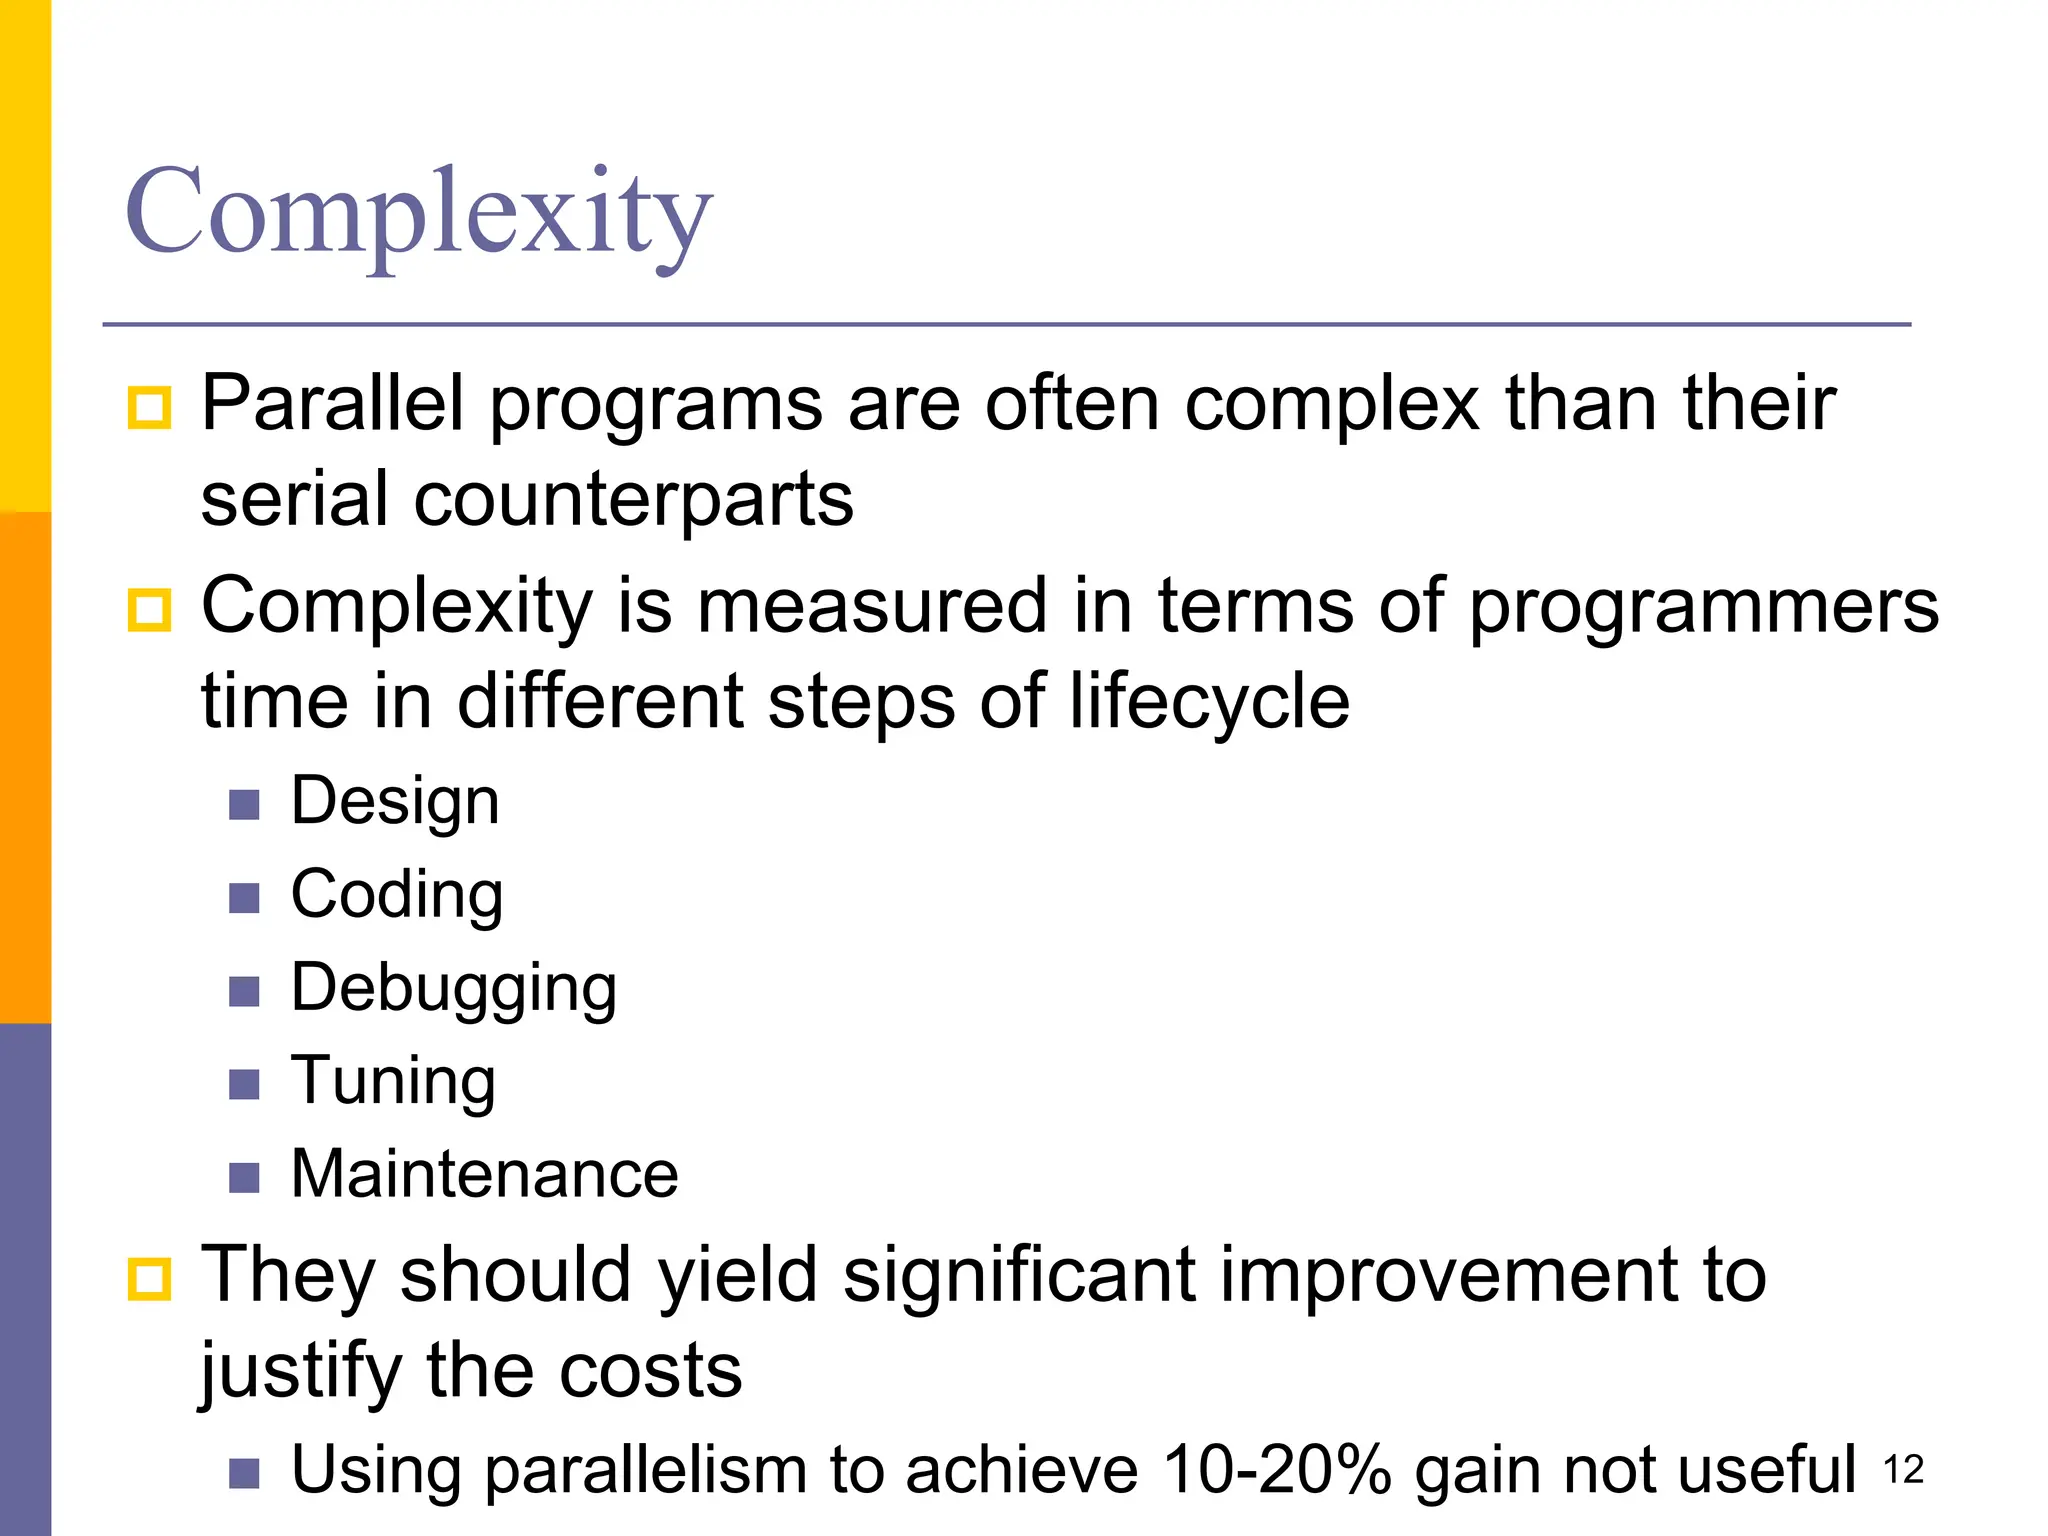
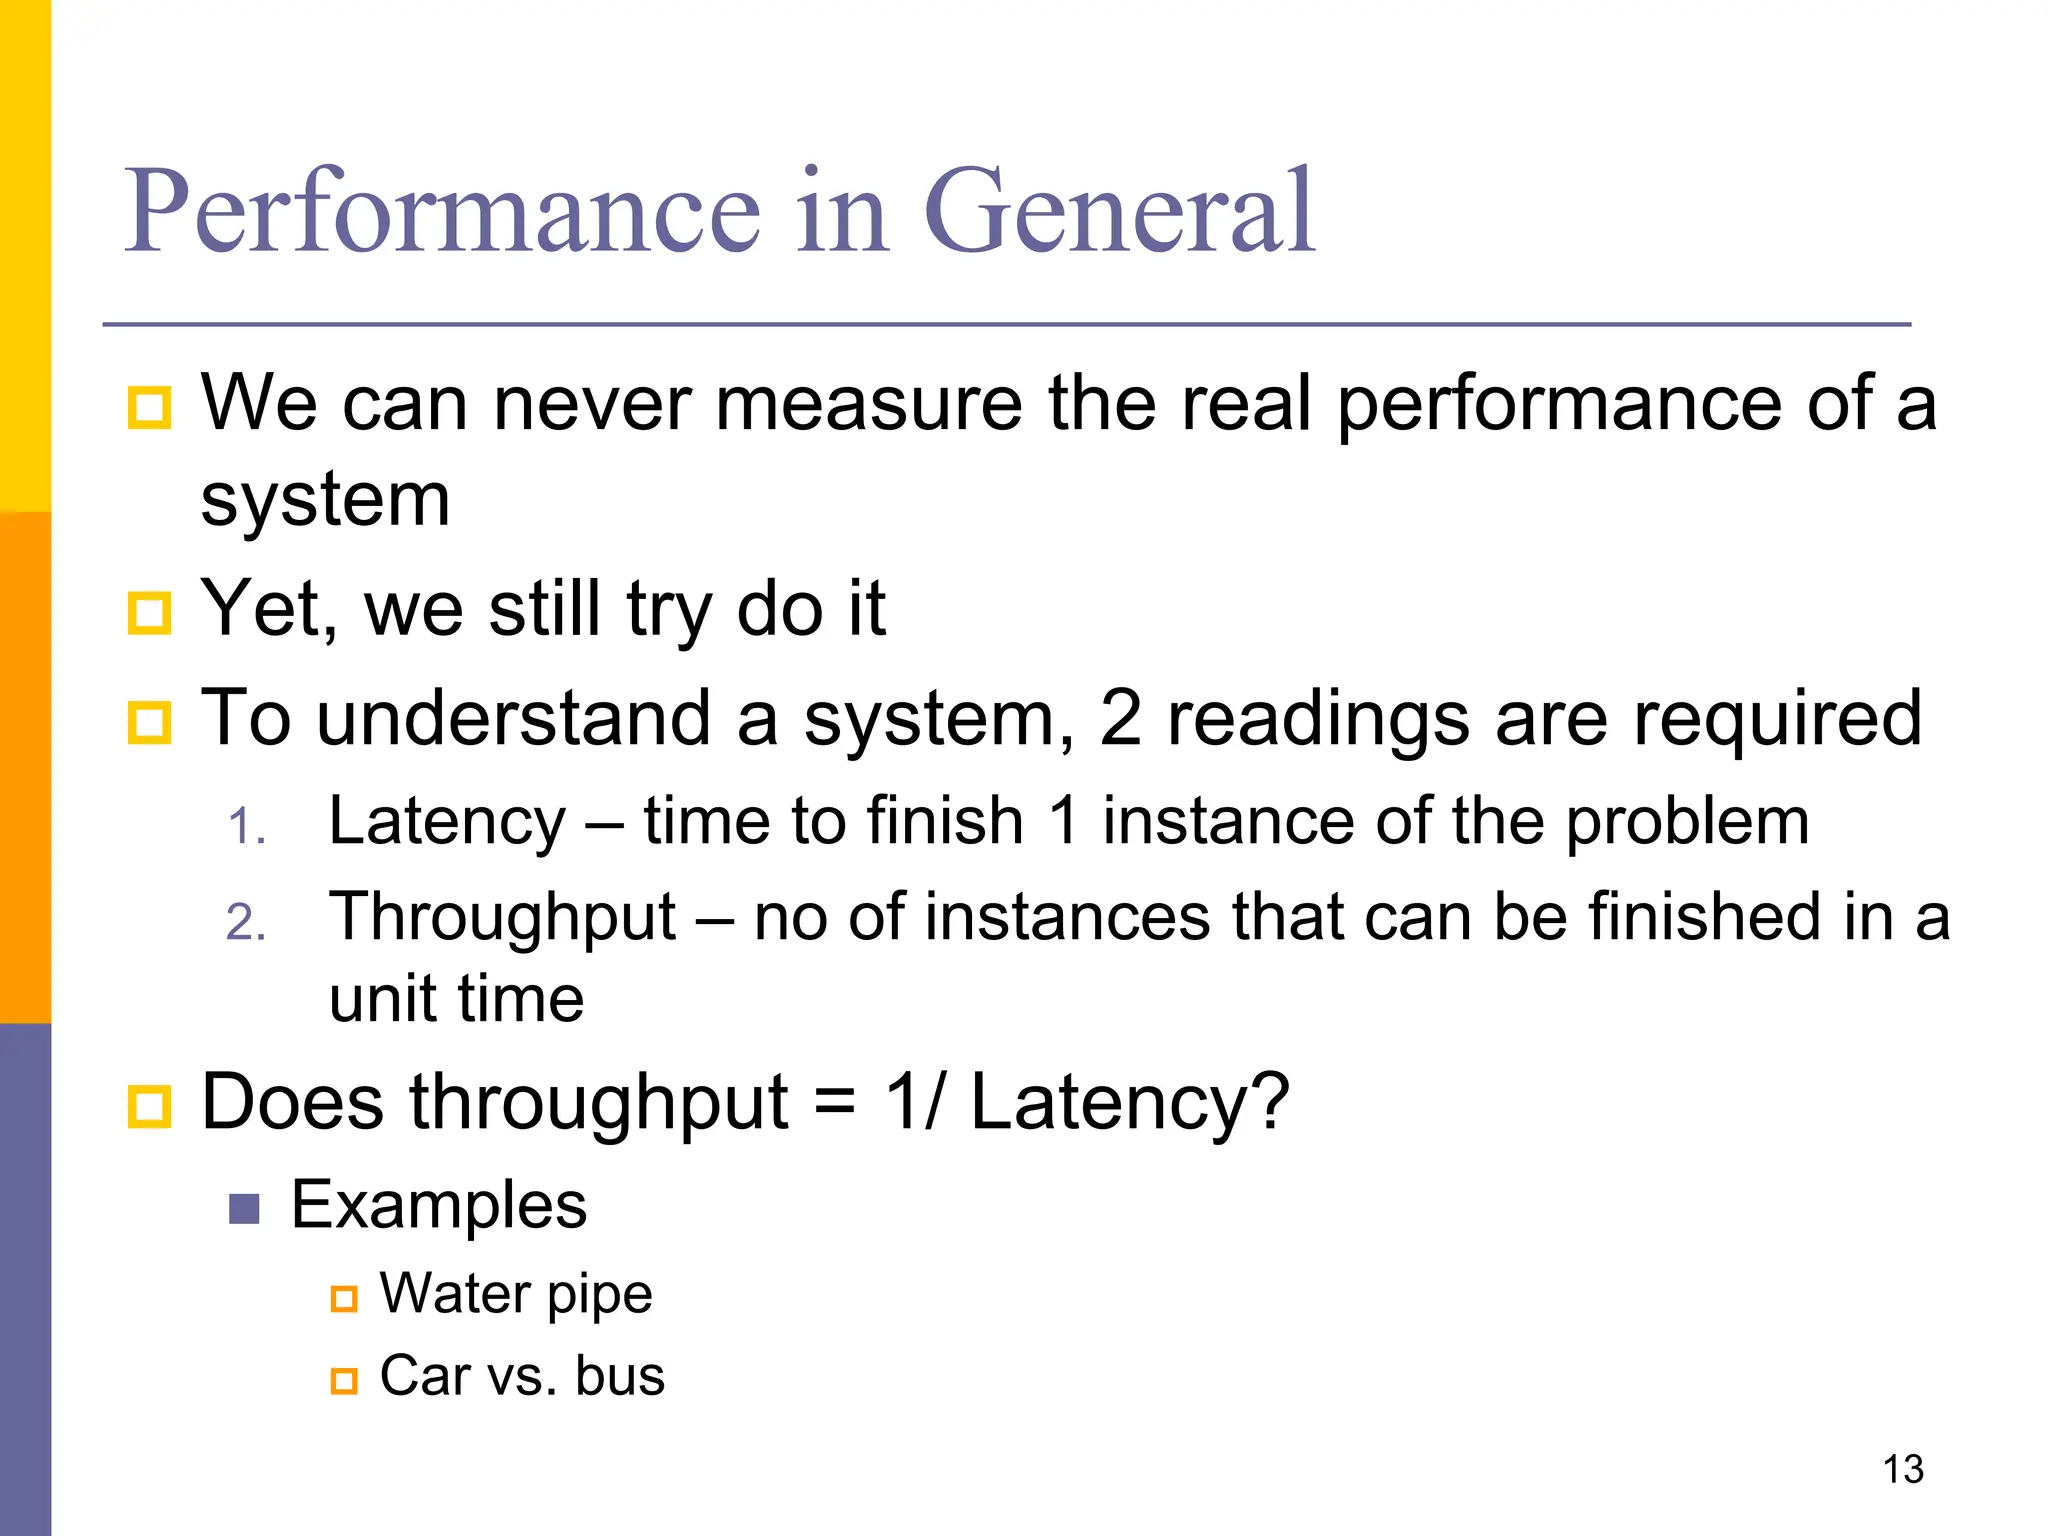
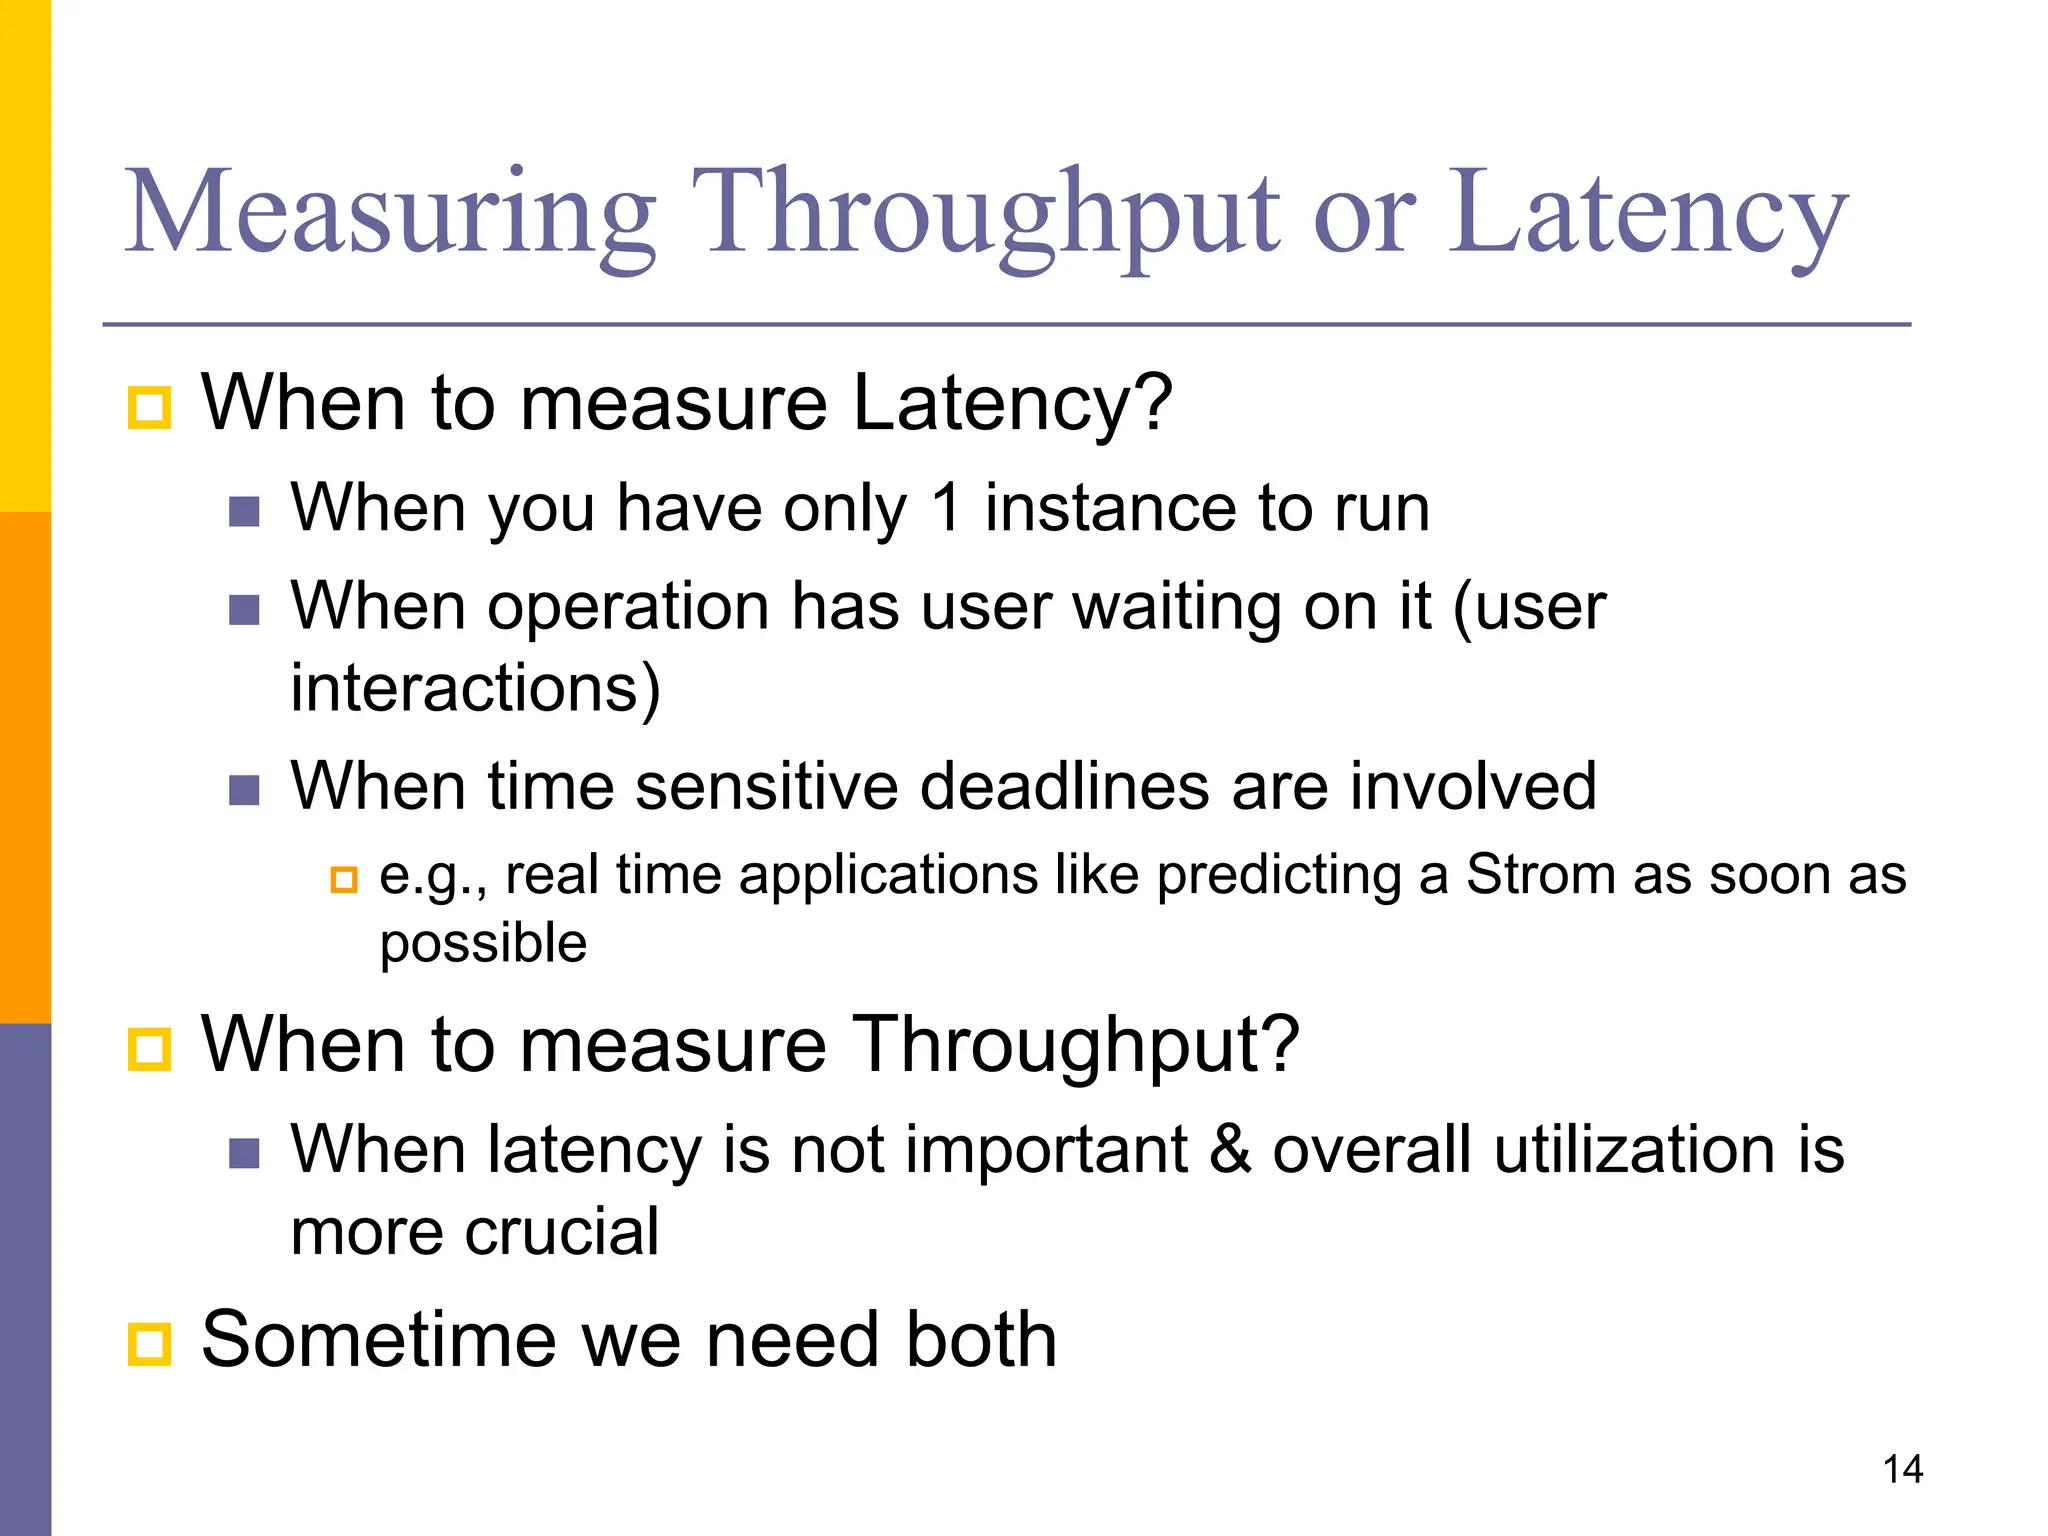
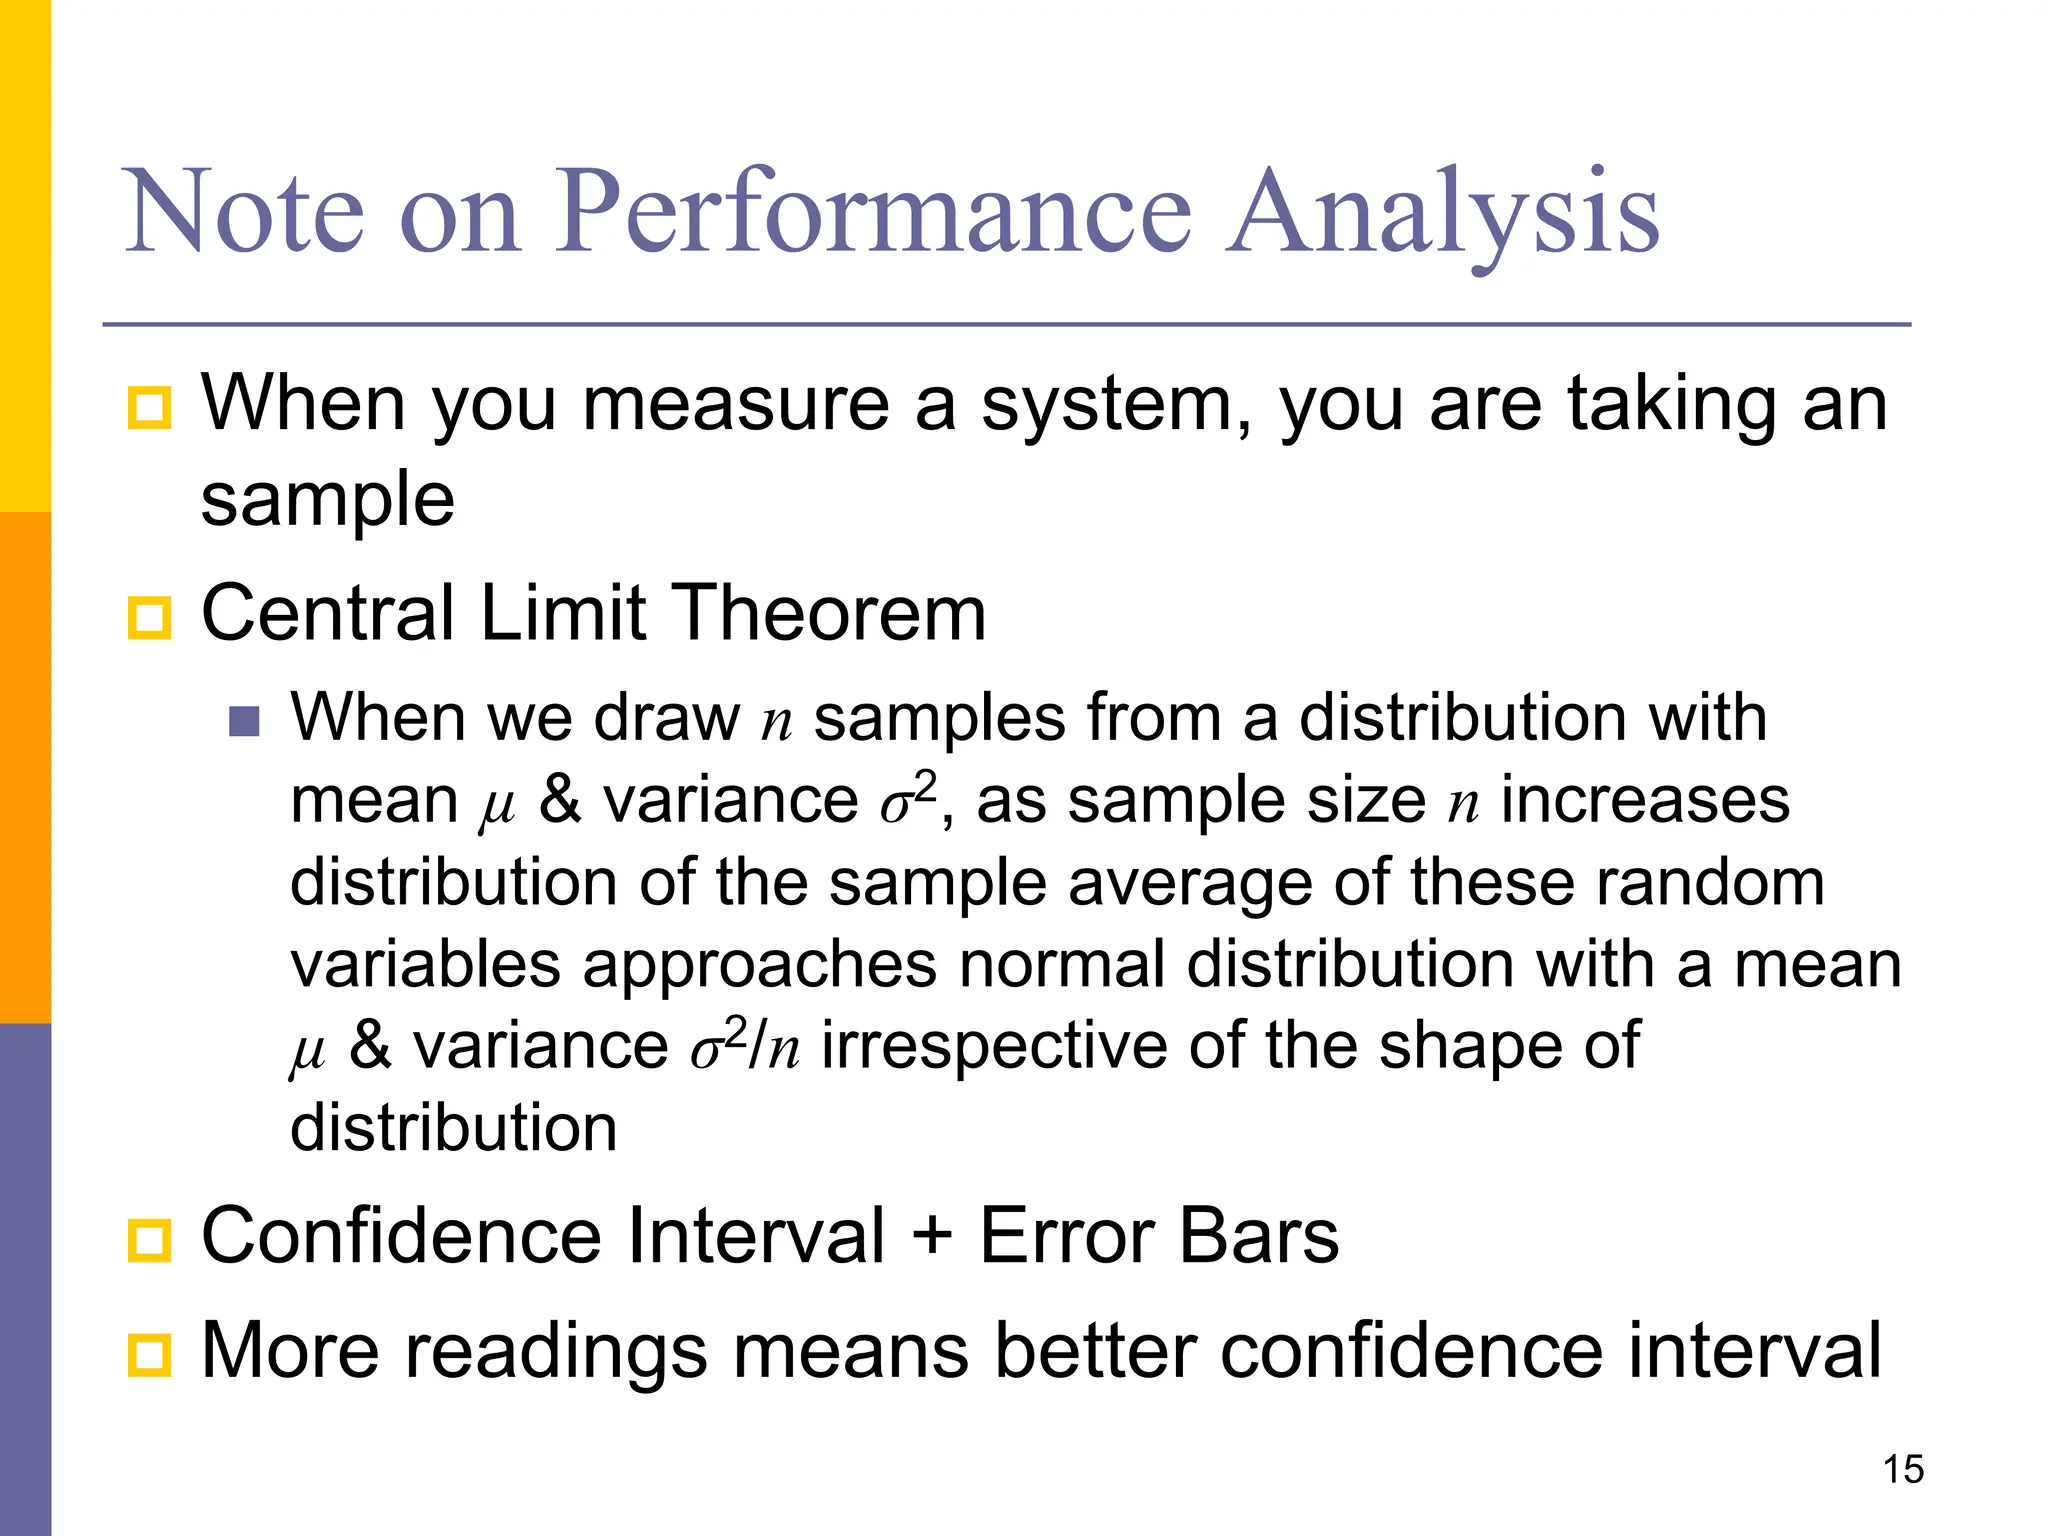
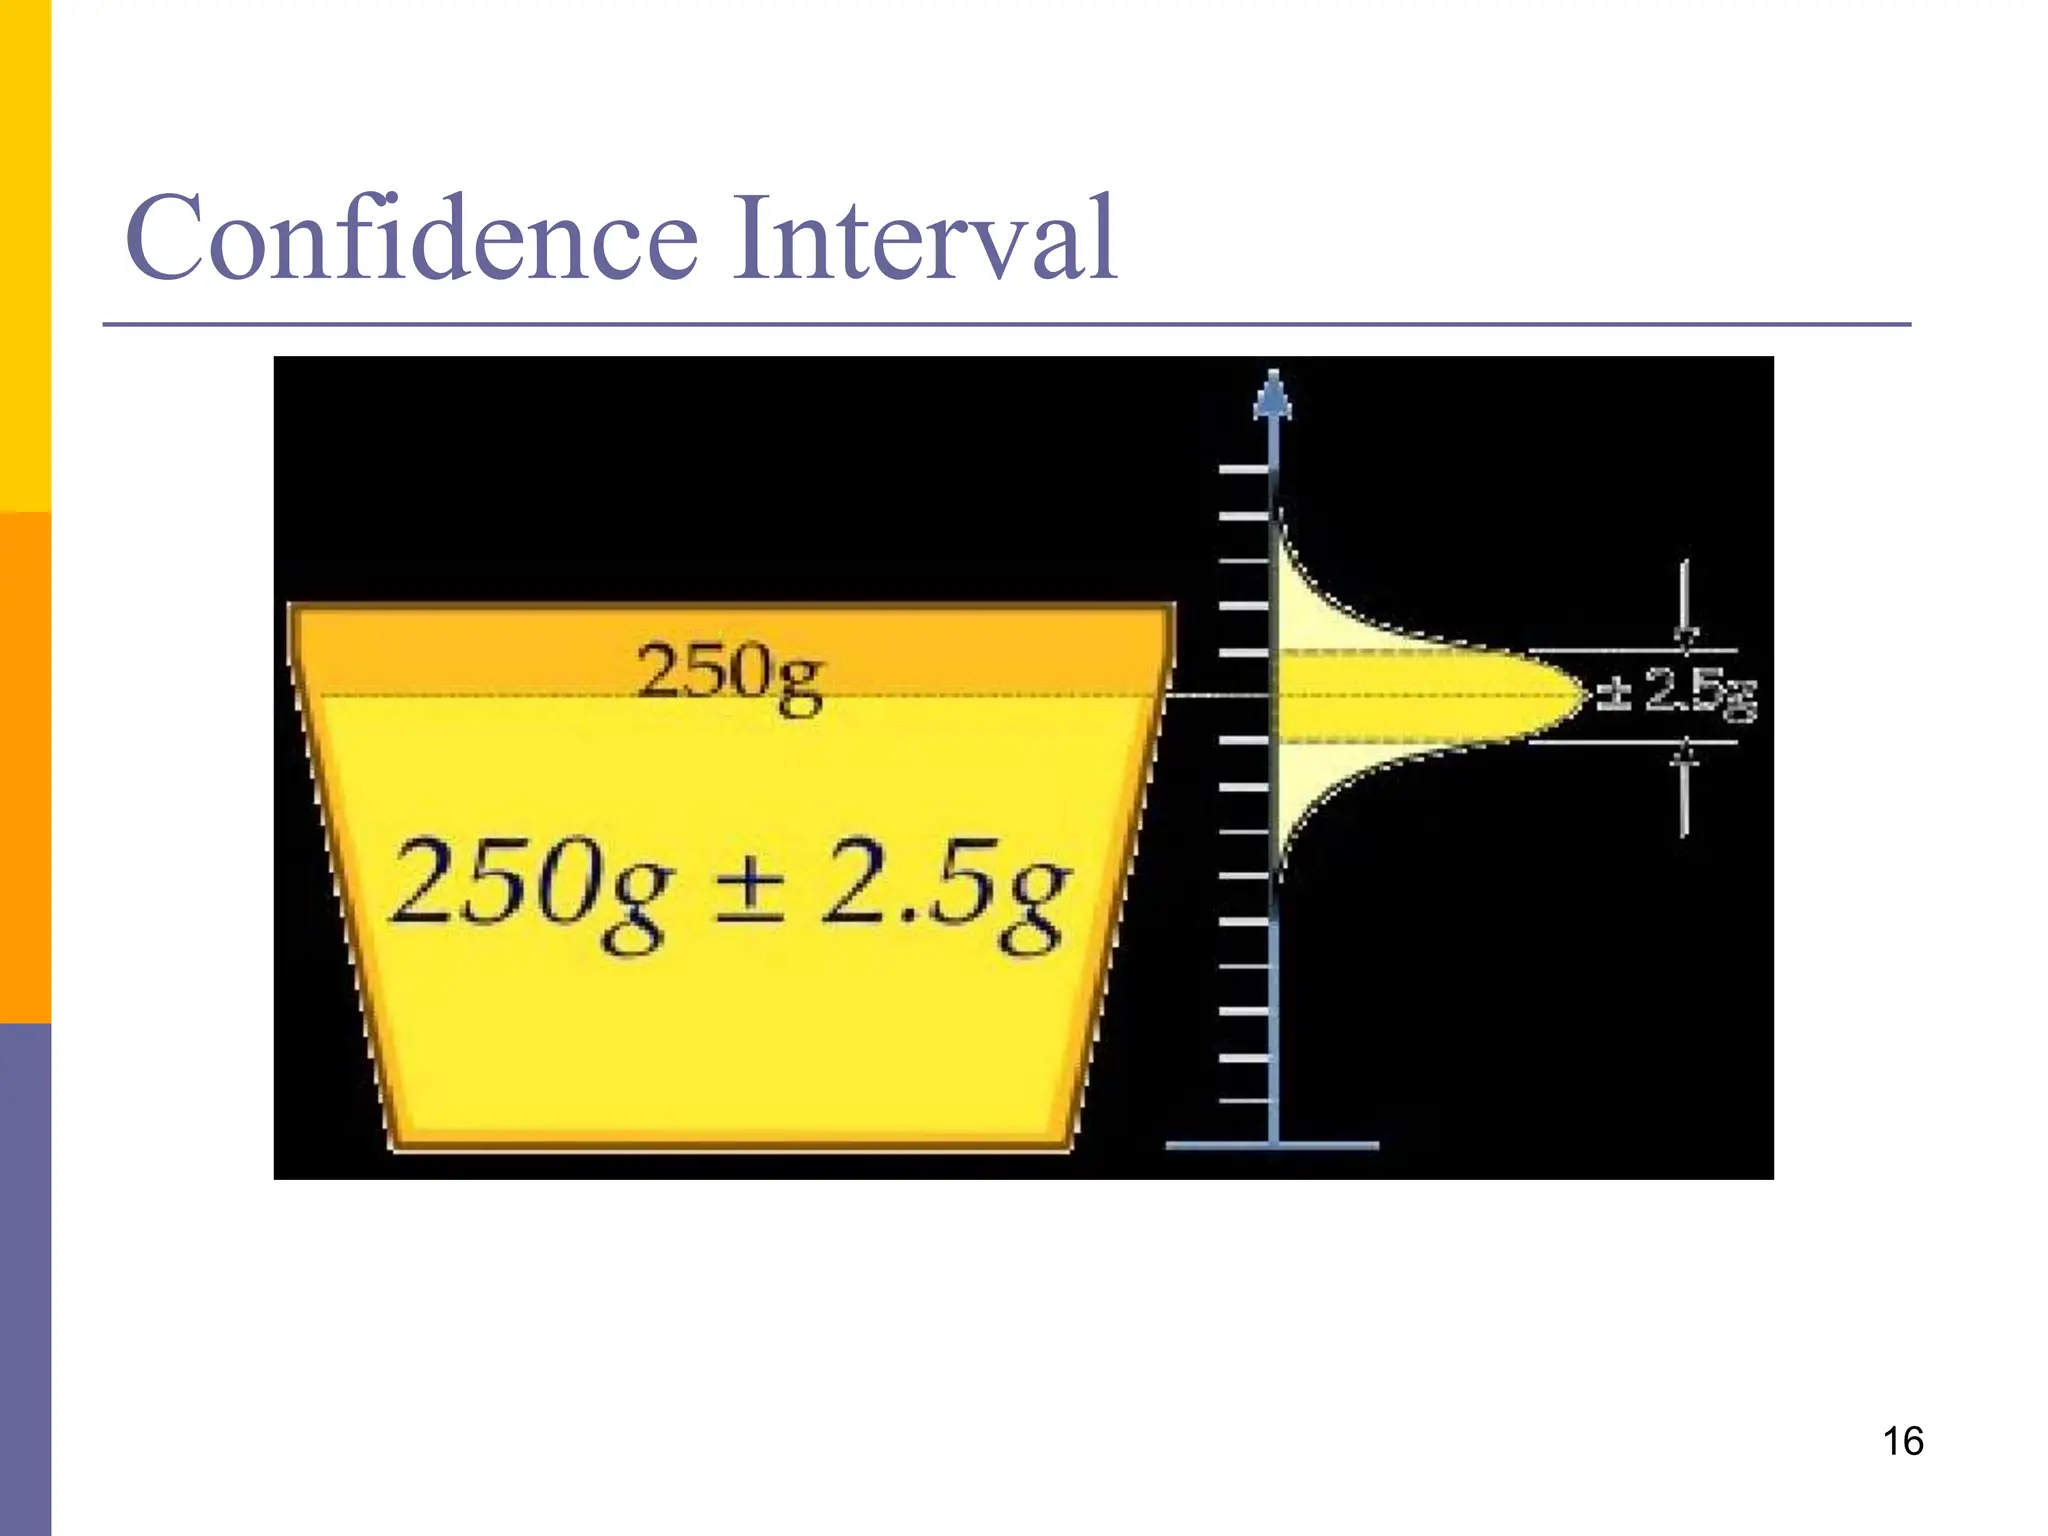
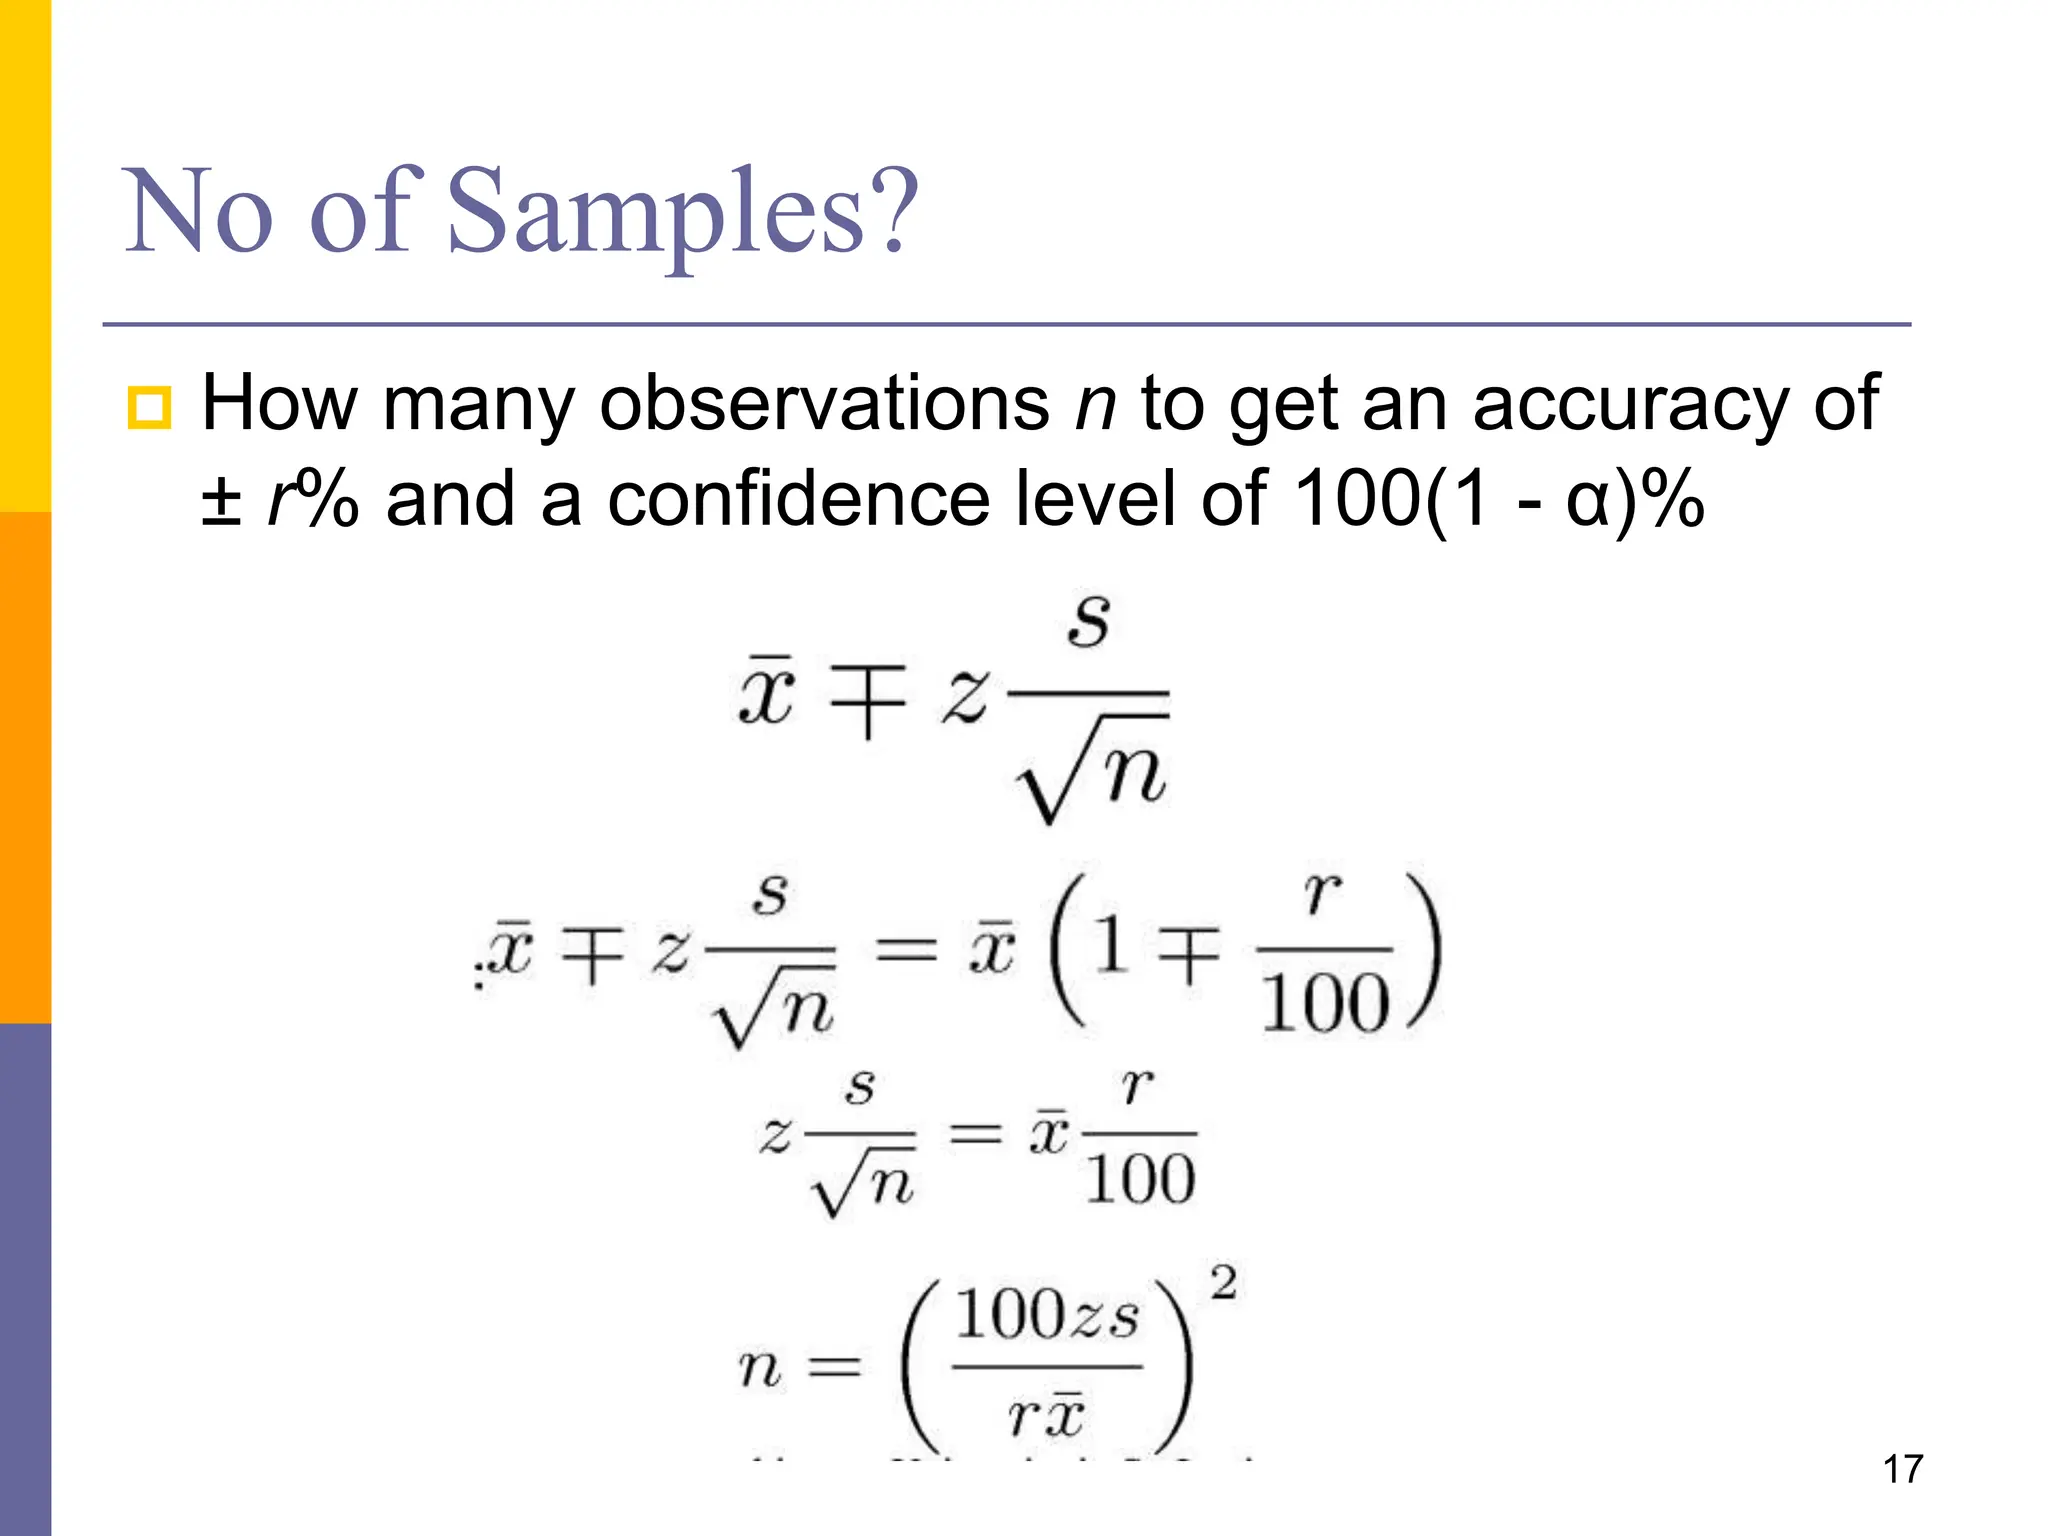
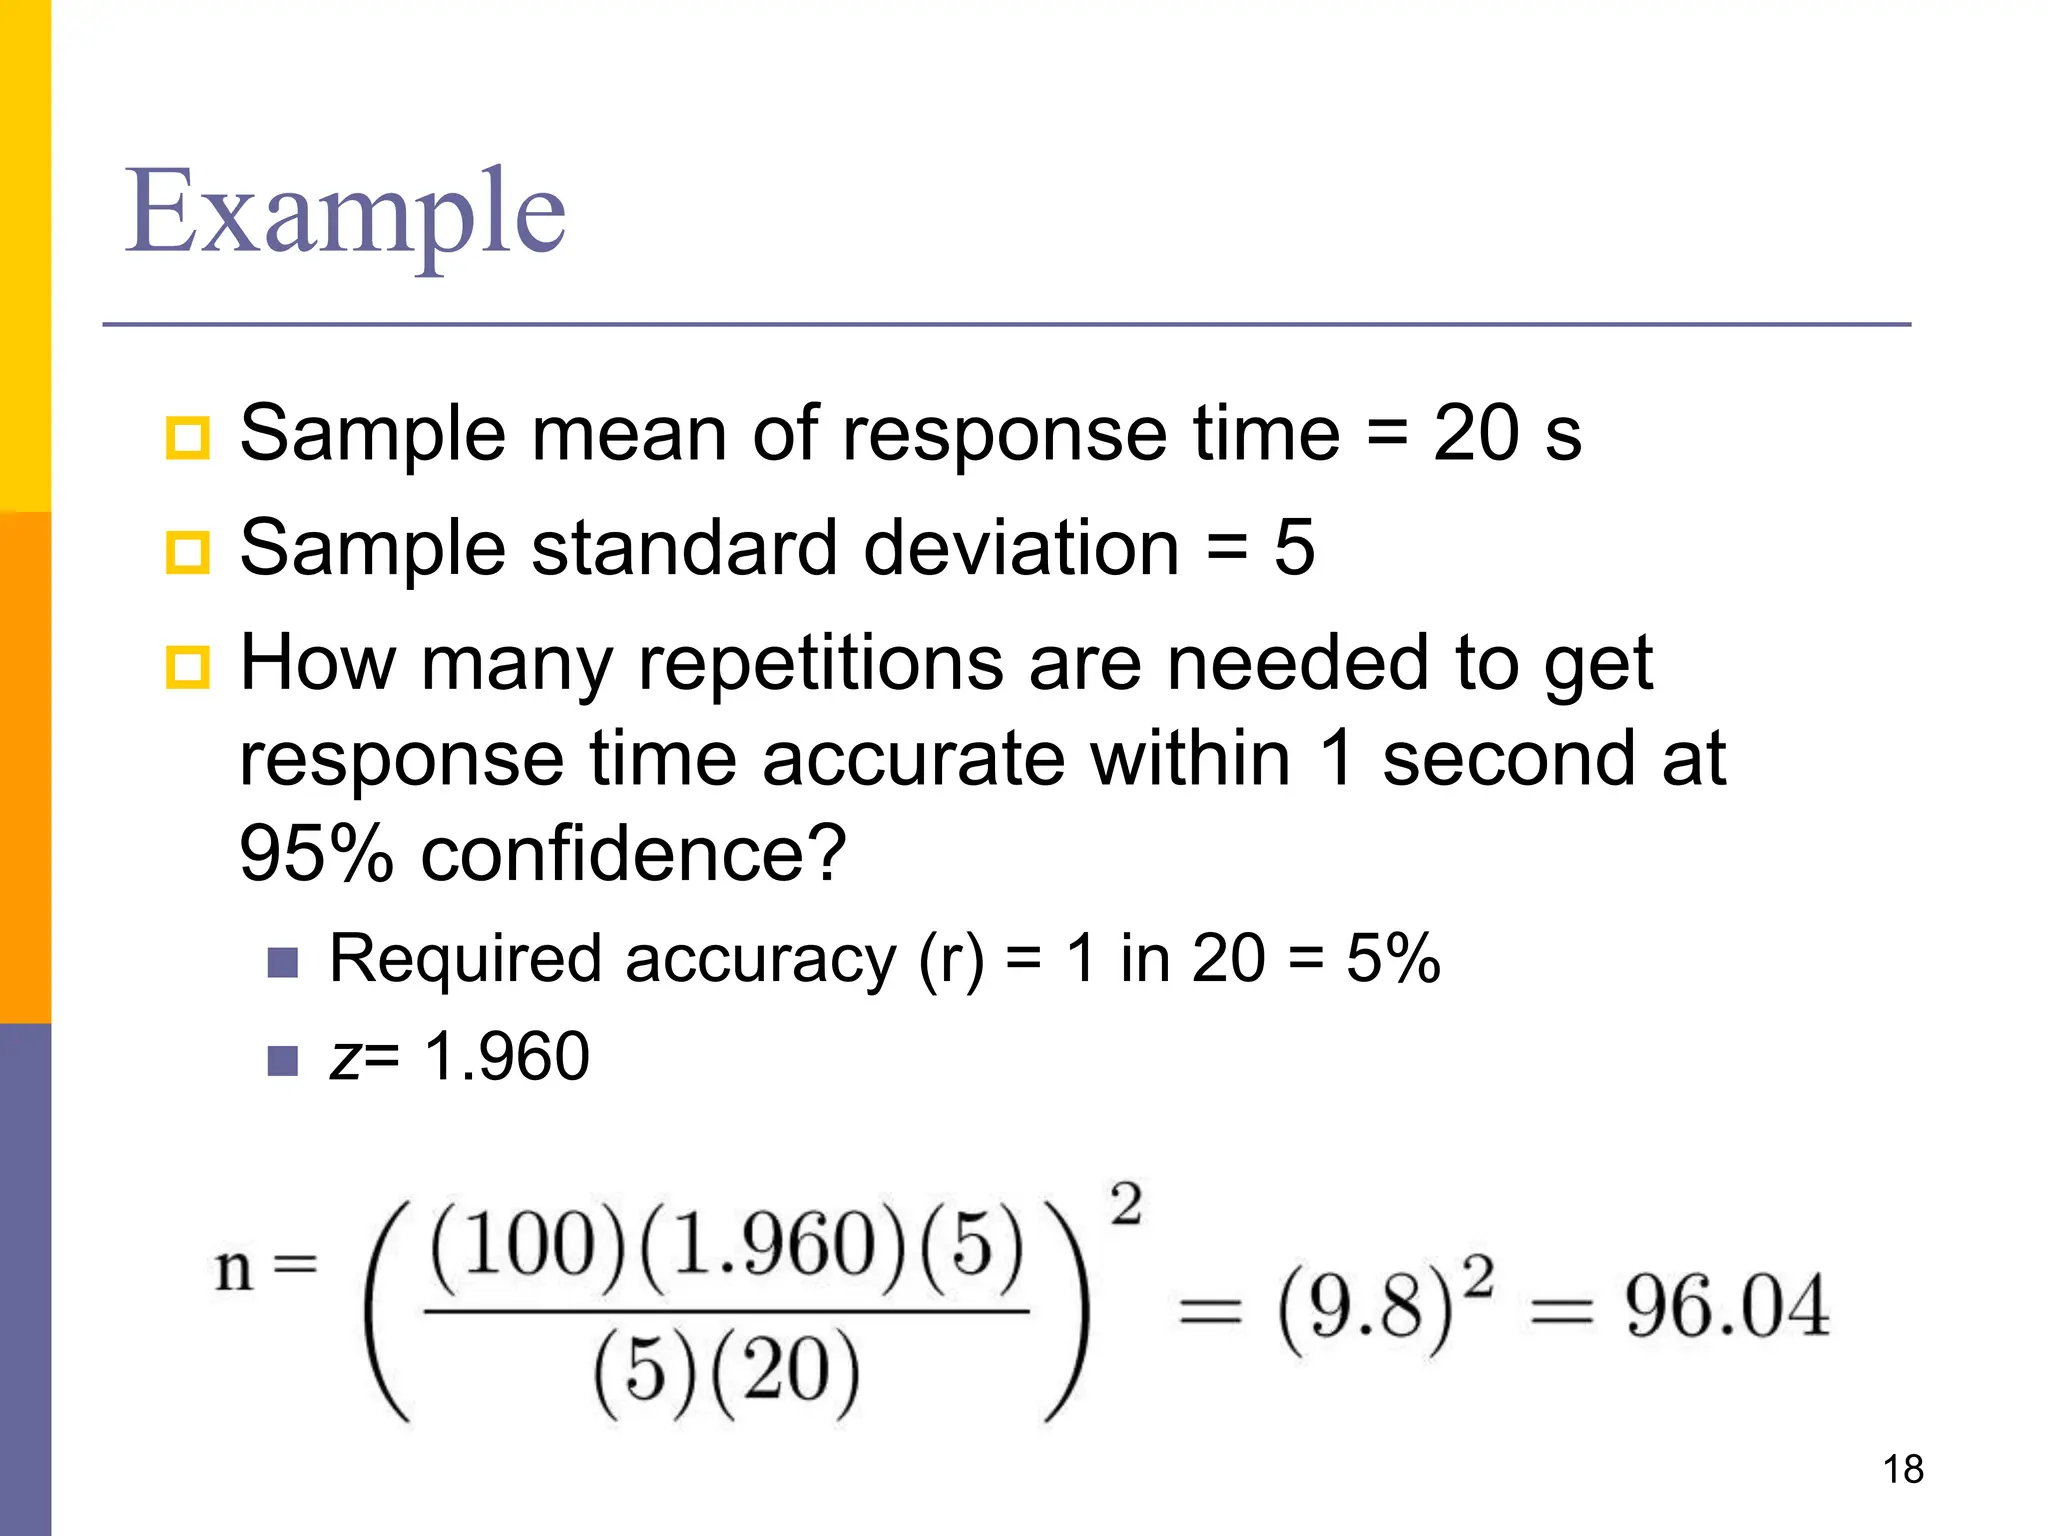


The document discusses the importance of parallelism in concurrent programming, emphasizing Amdahl's Law and its implications on speedup based on the ratio of concurrent to sequential code. It outlines the trade-offs in performance, costs, and complexity associated with parallel programming, including the impacts of task start-up and synchronization costs. Additionally, the document highlights the significance of accurately measuring performance through metrics like latency and throughput, along with the use of statistical analysis for confidence in results.