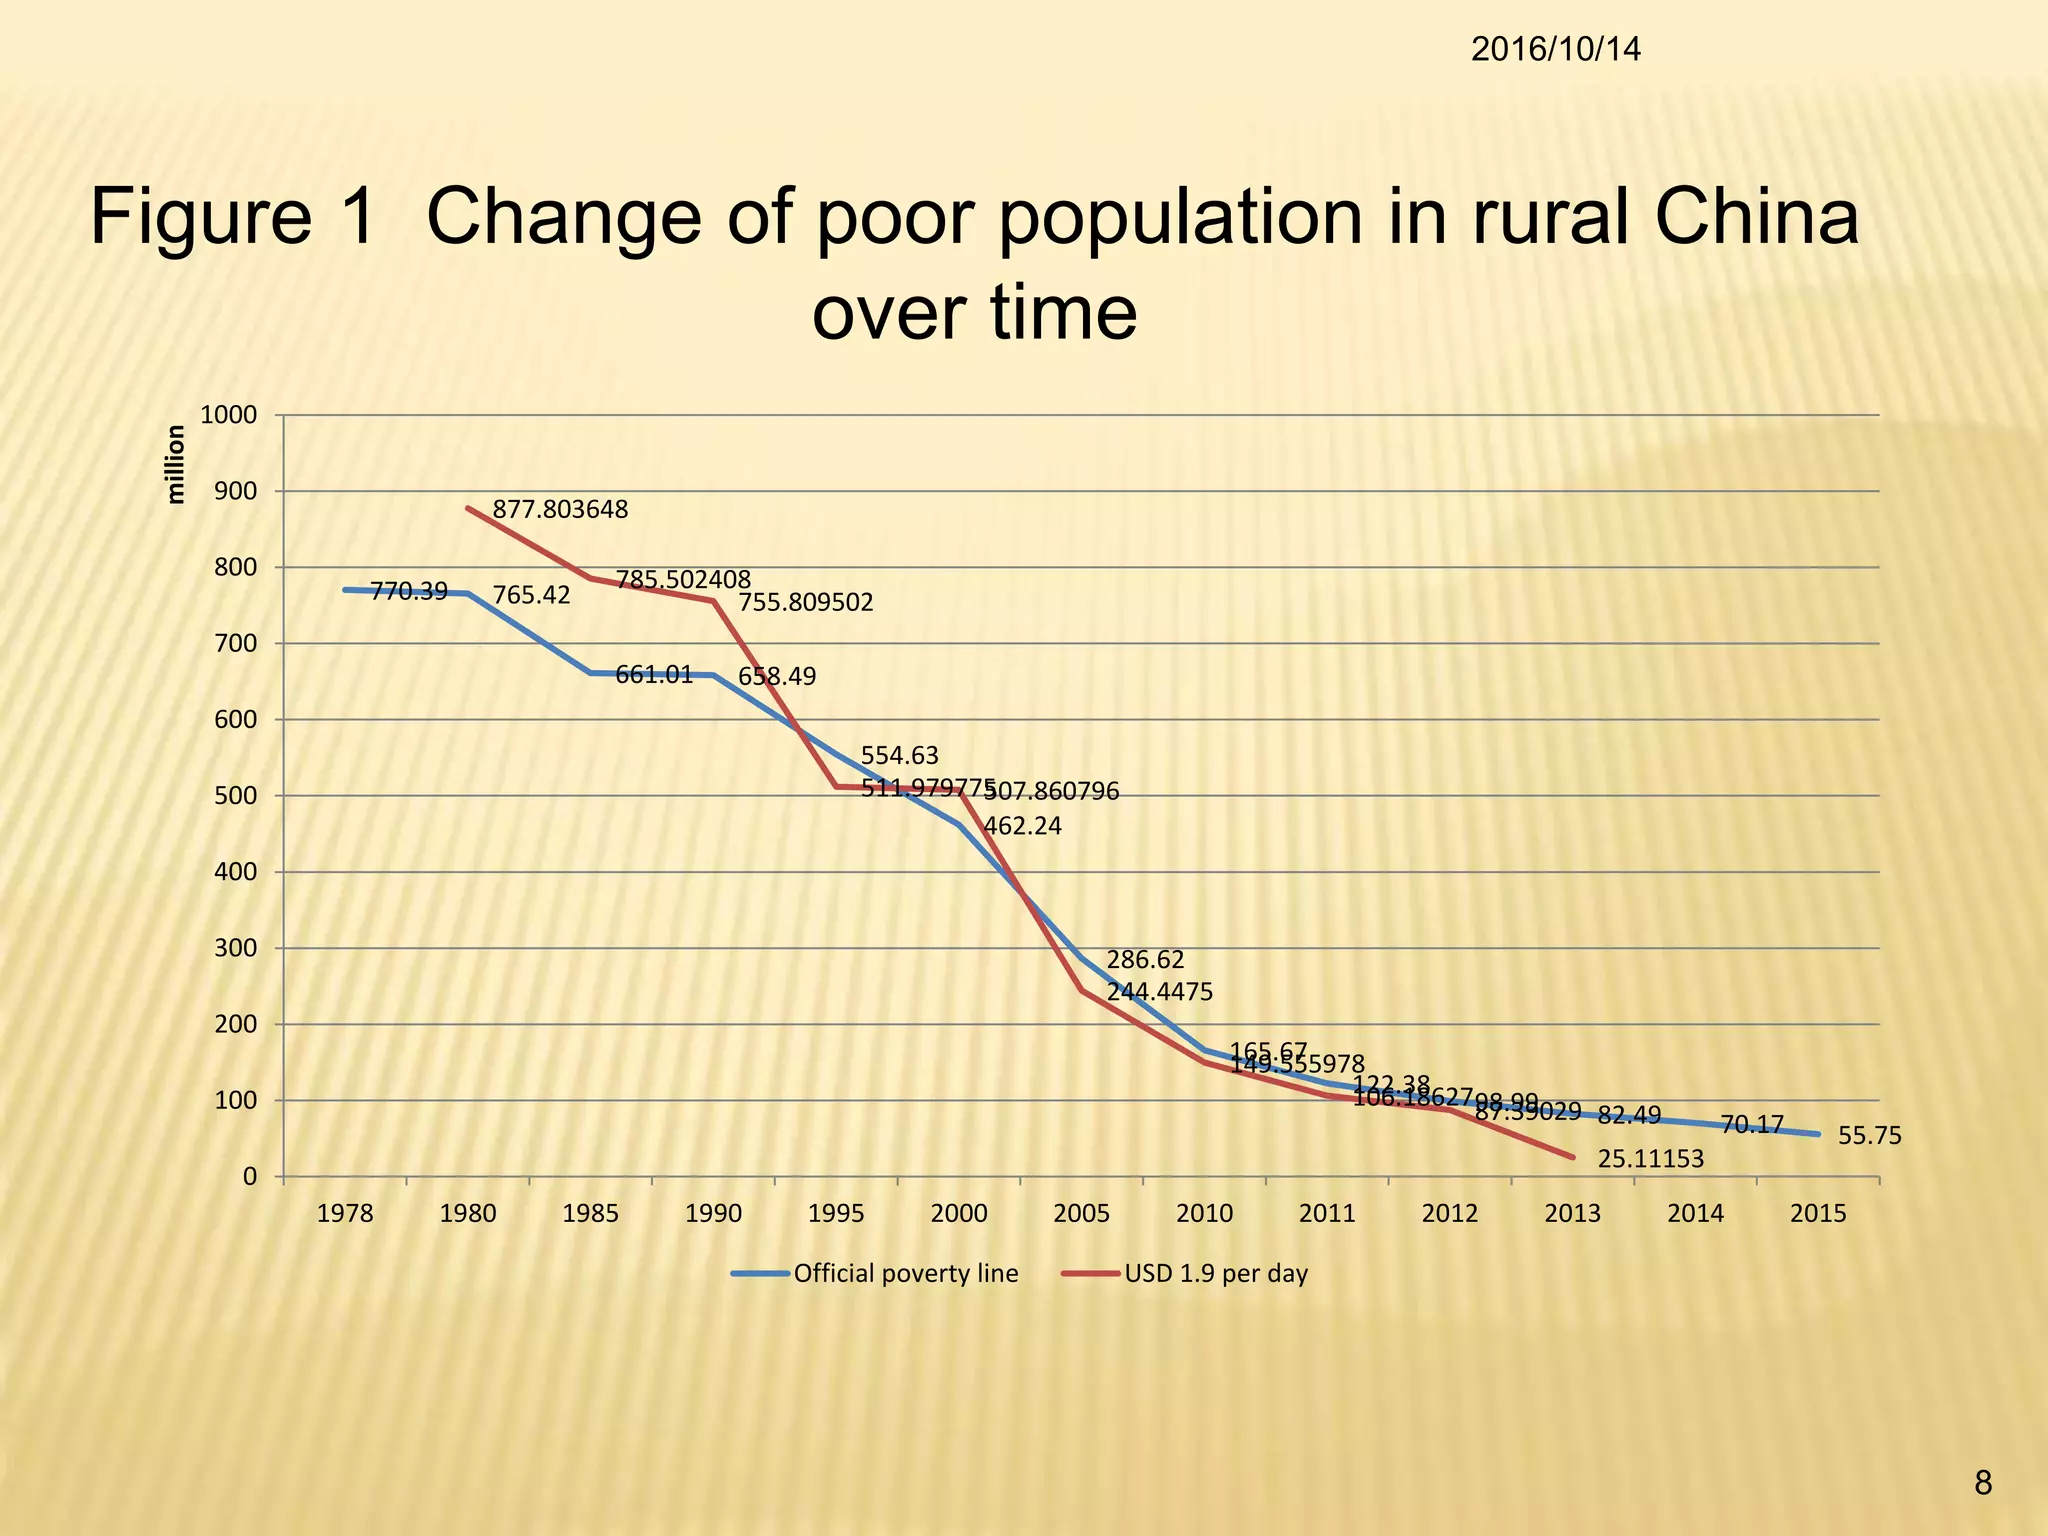
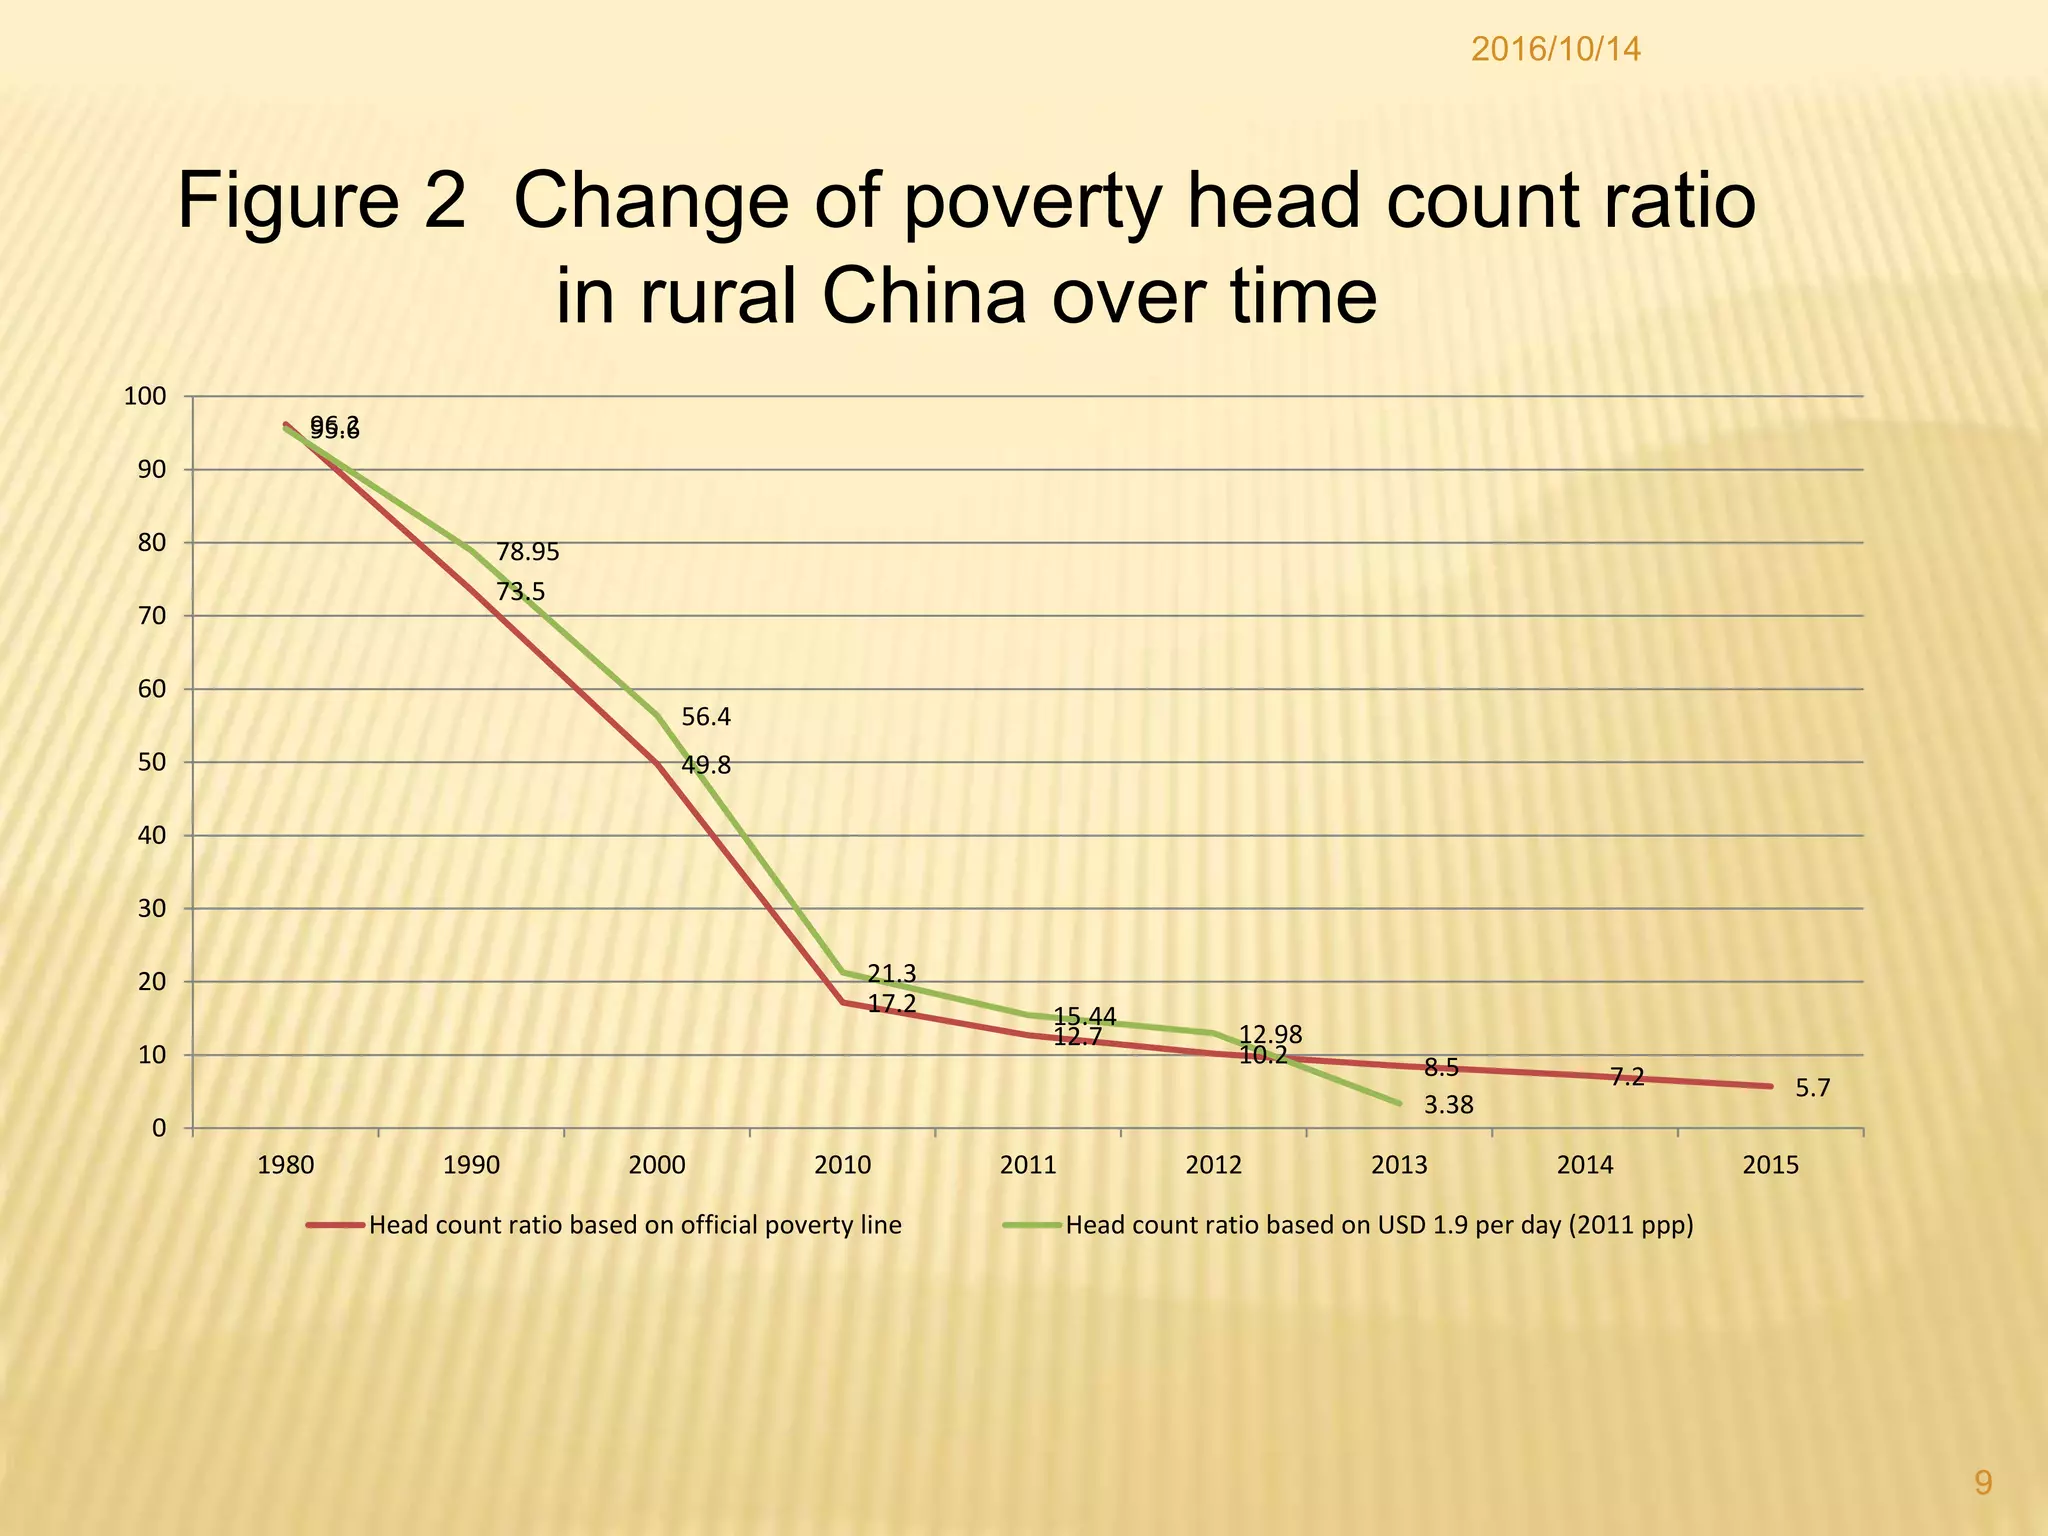
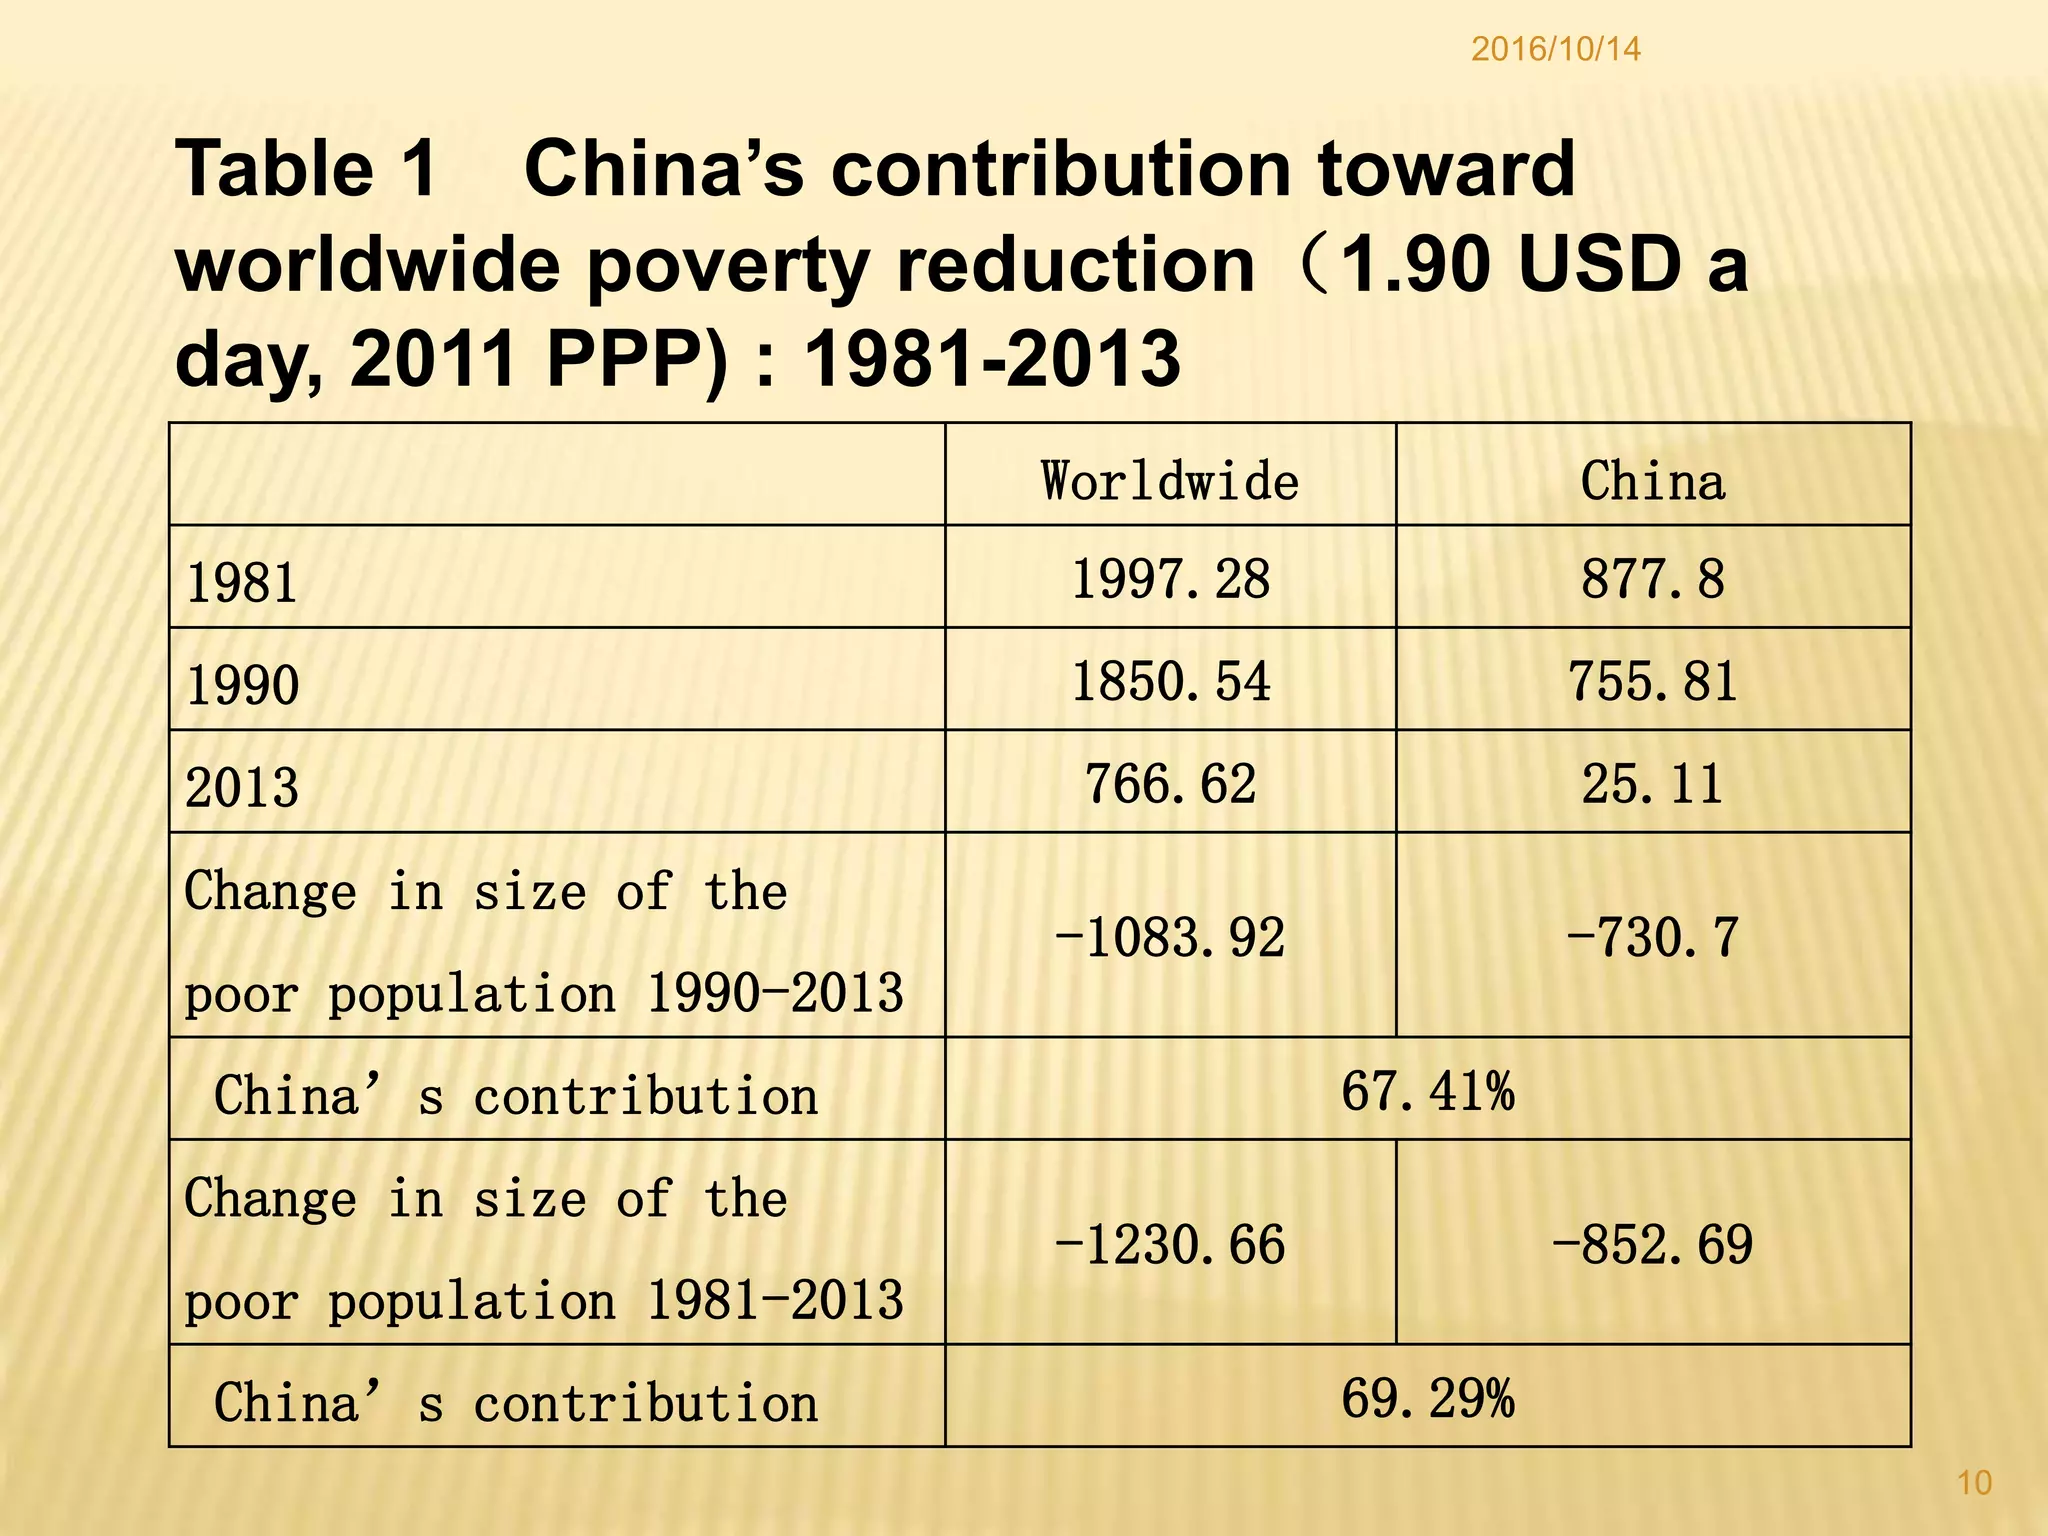
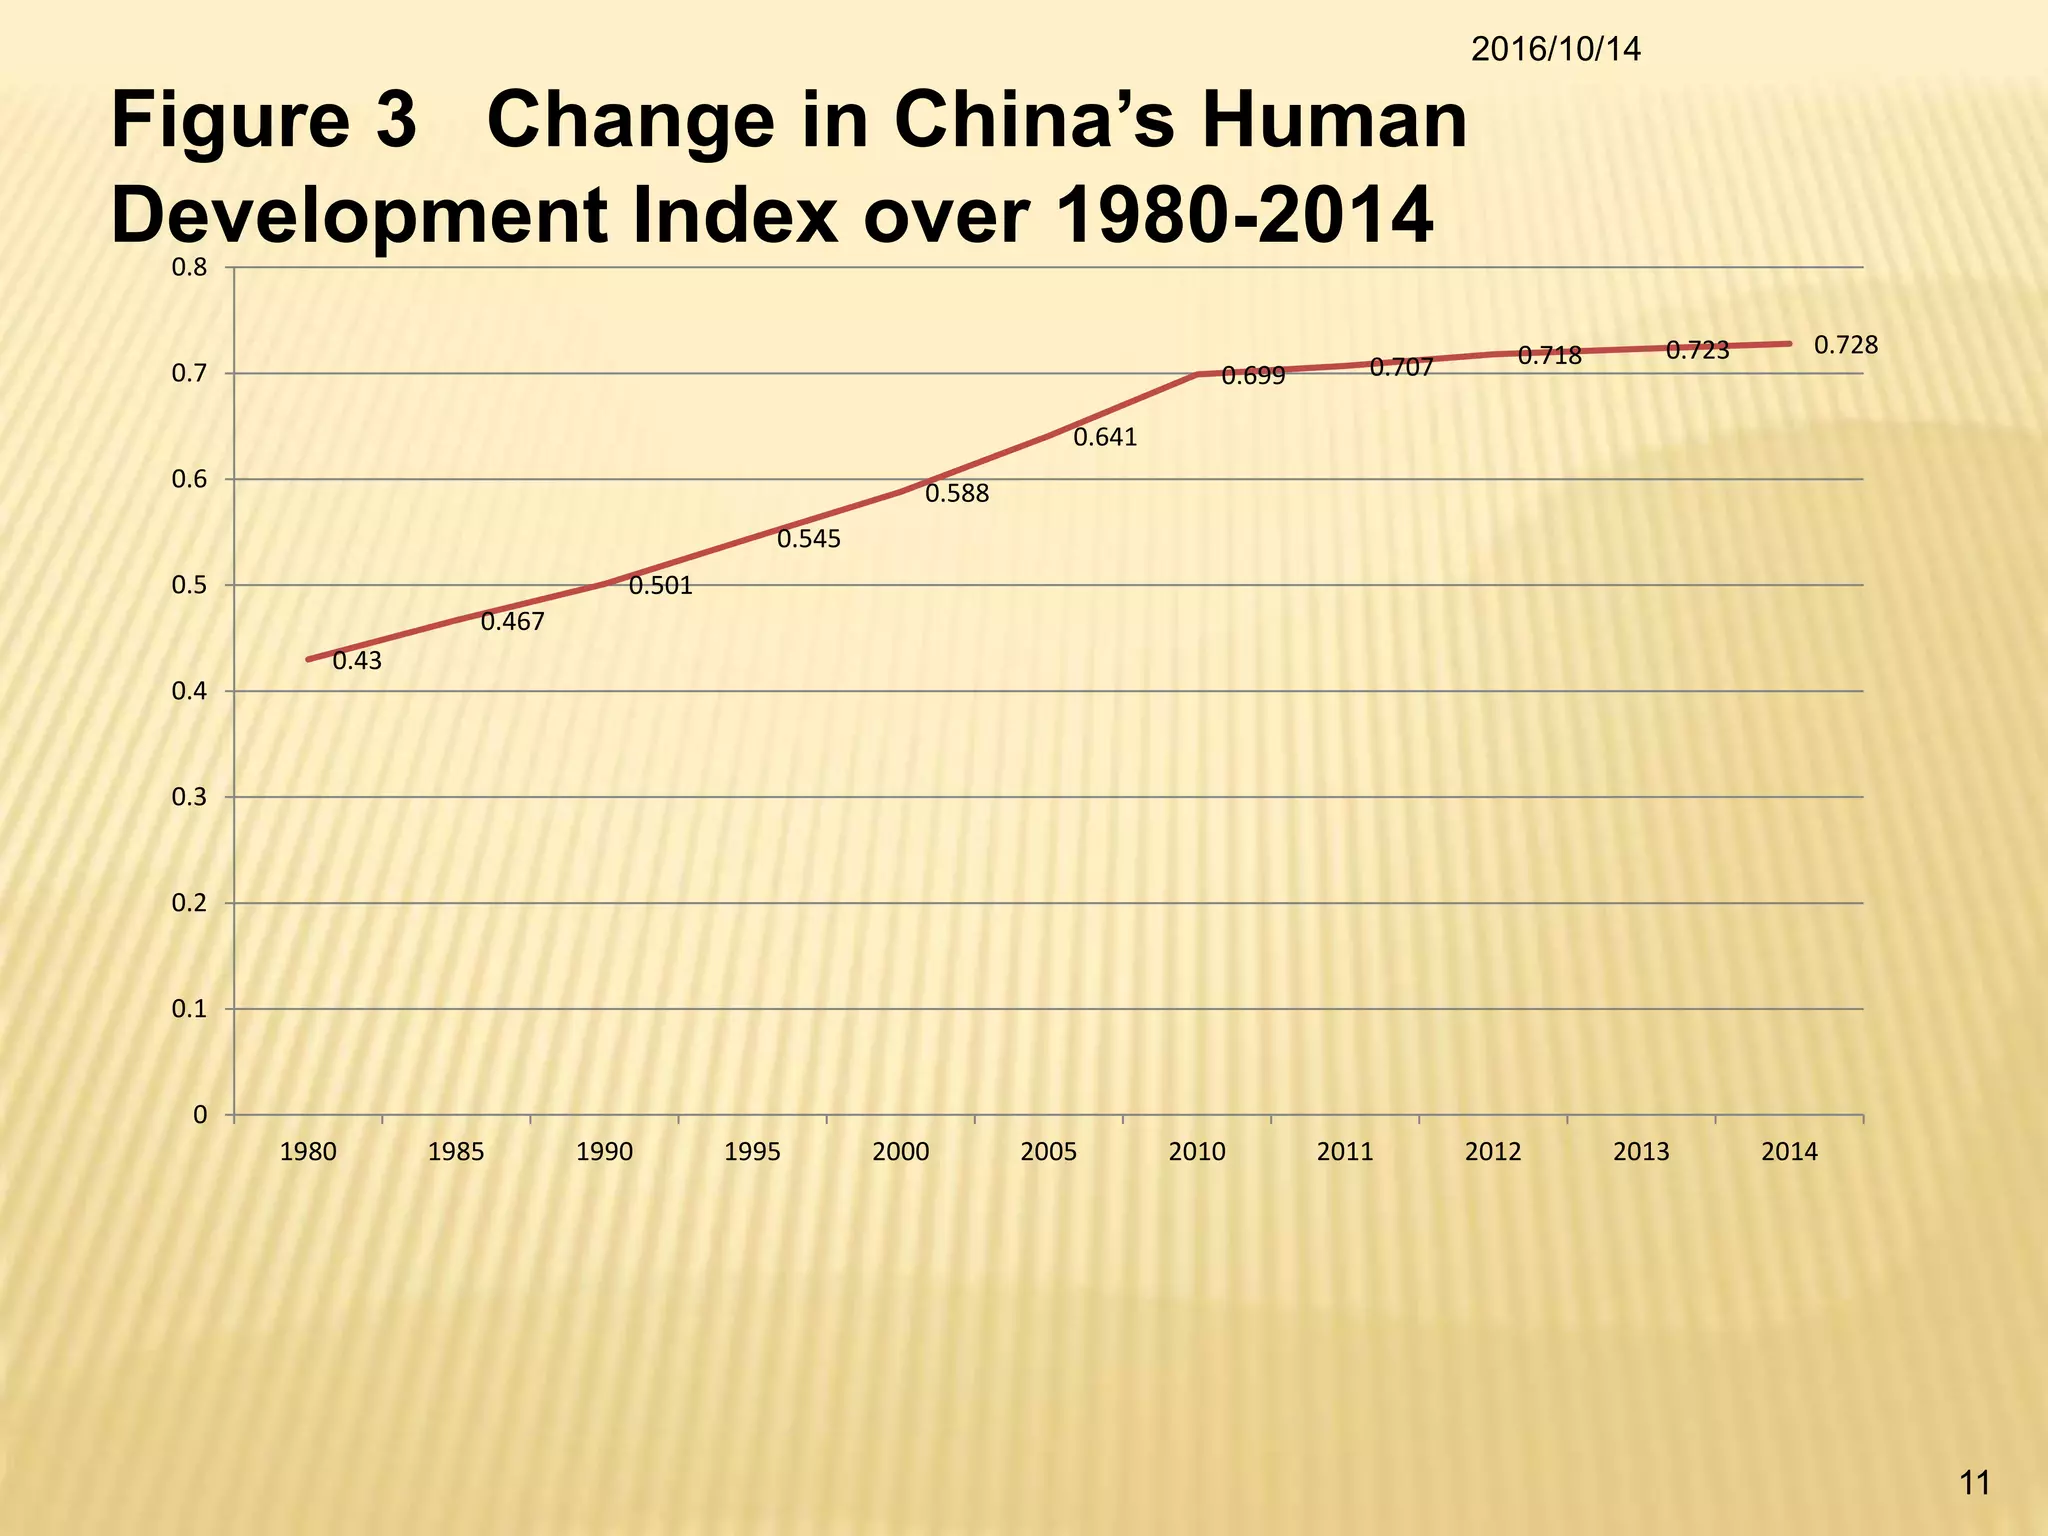
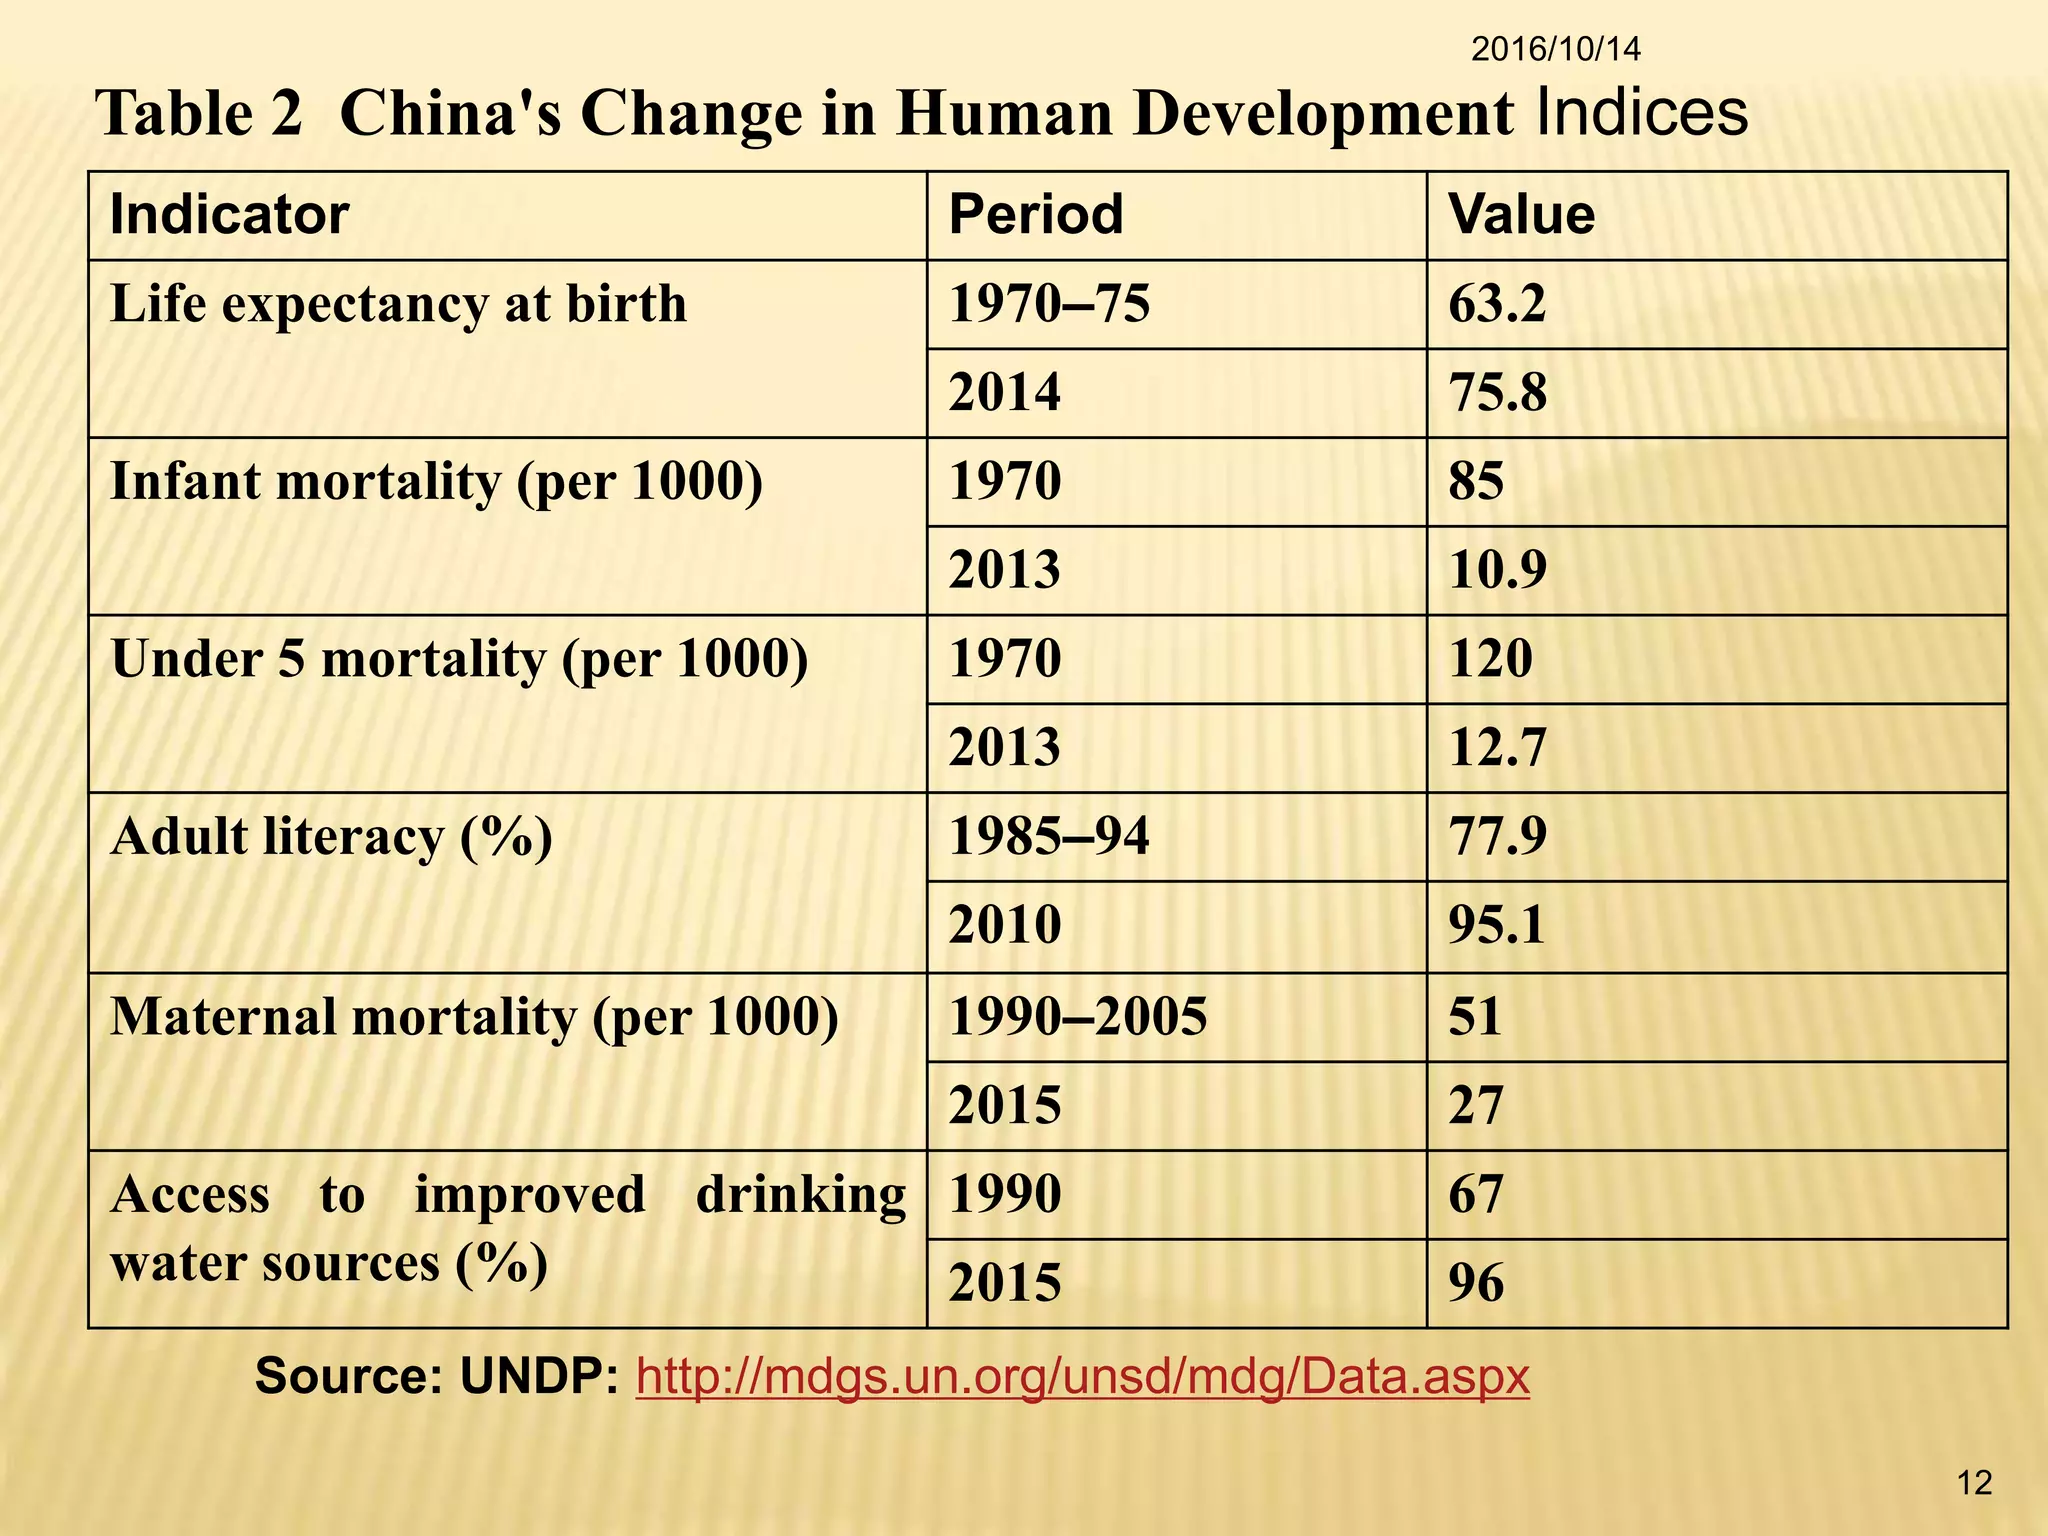
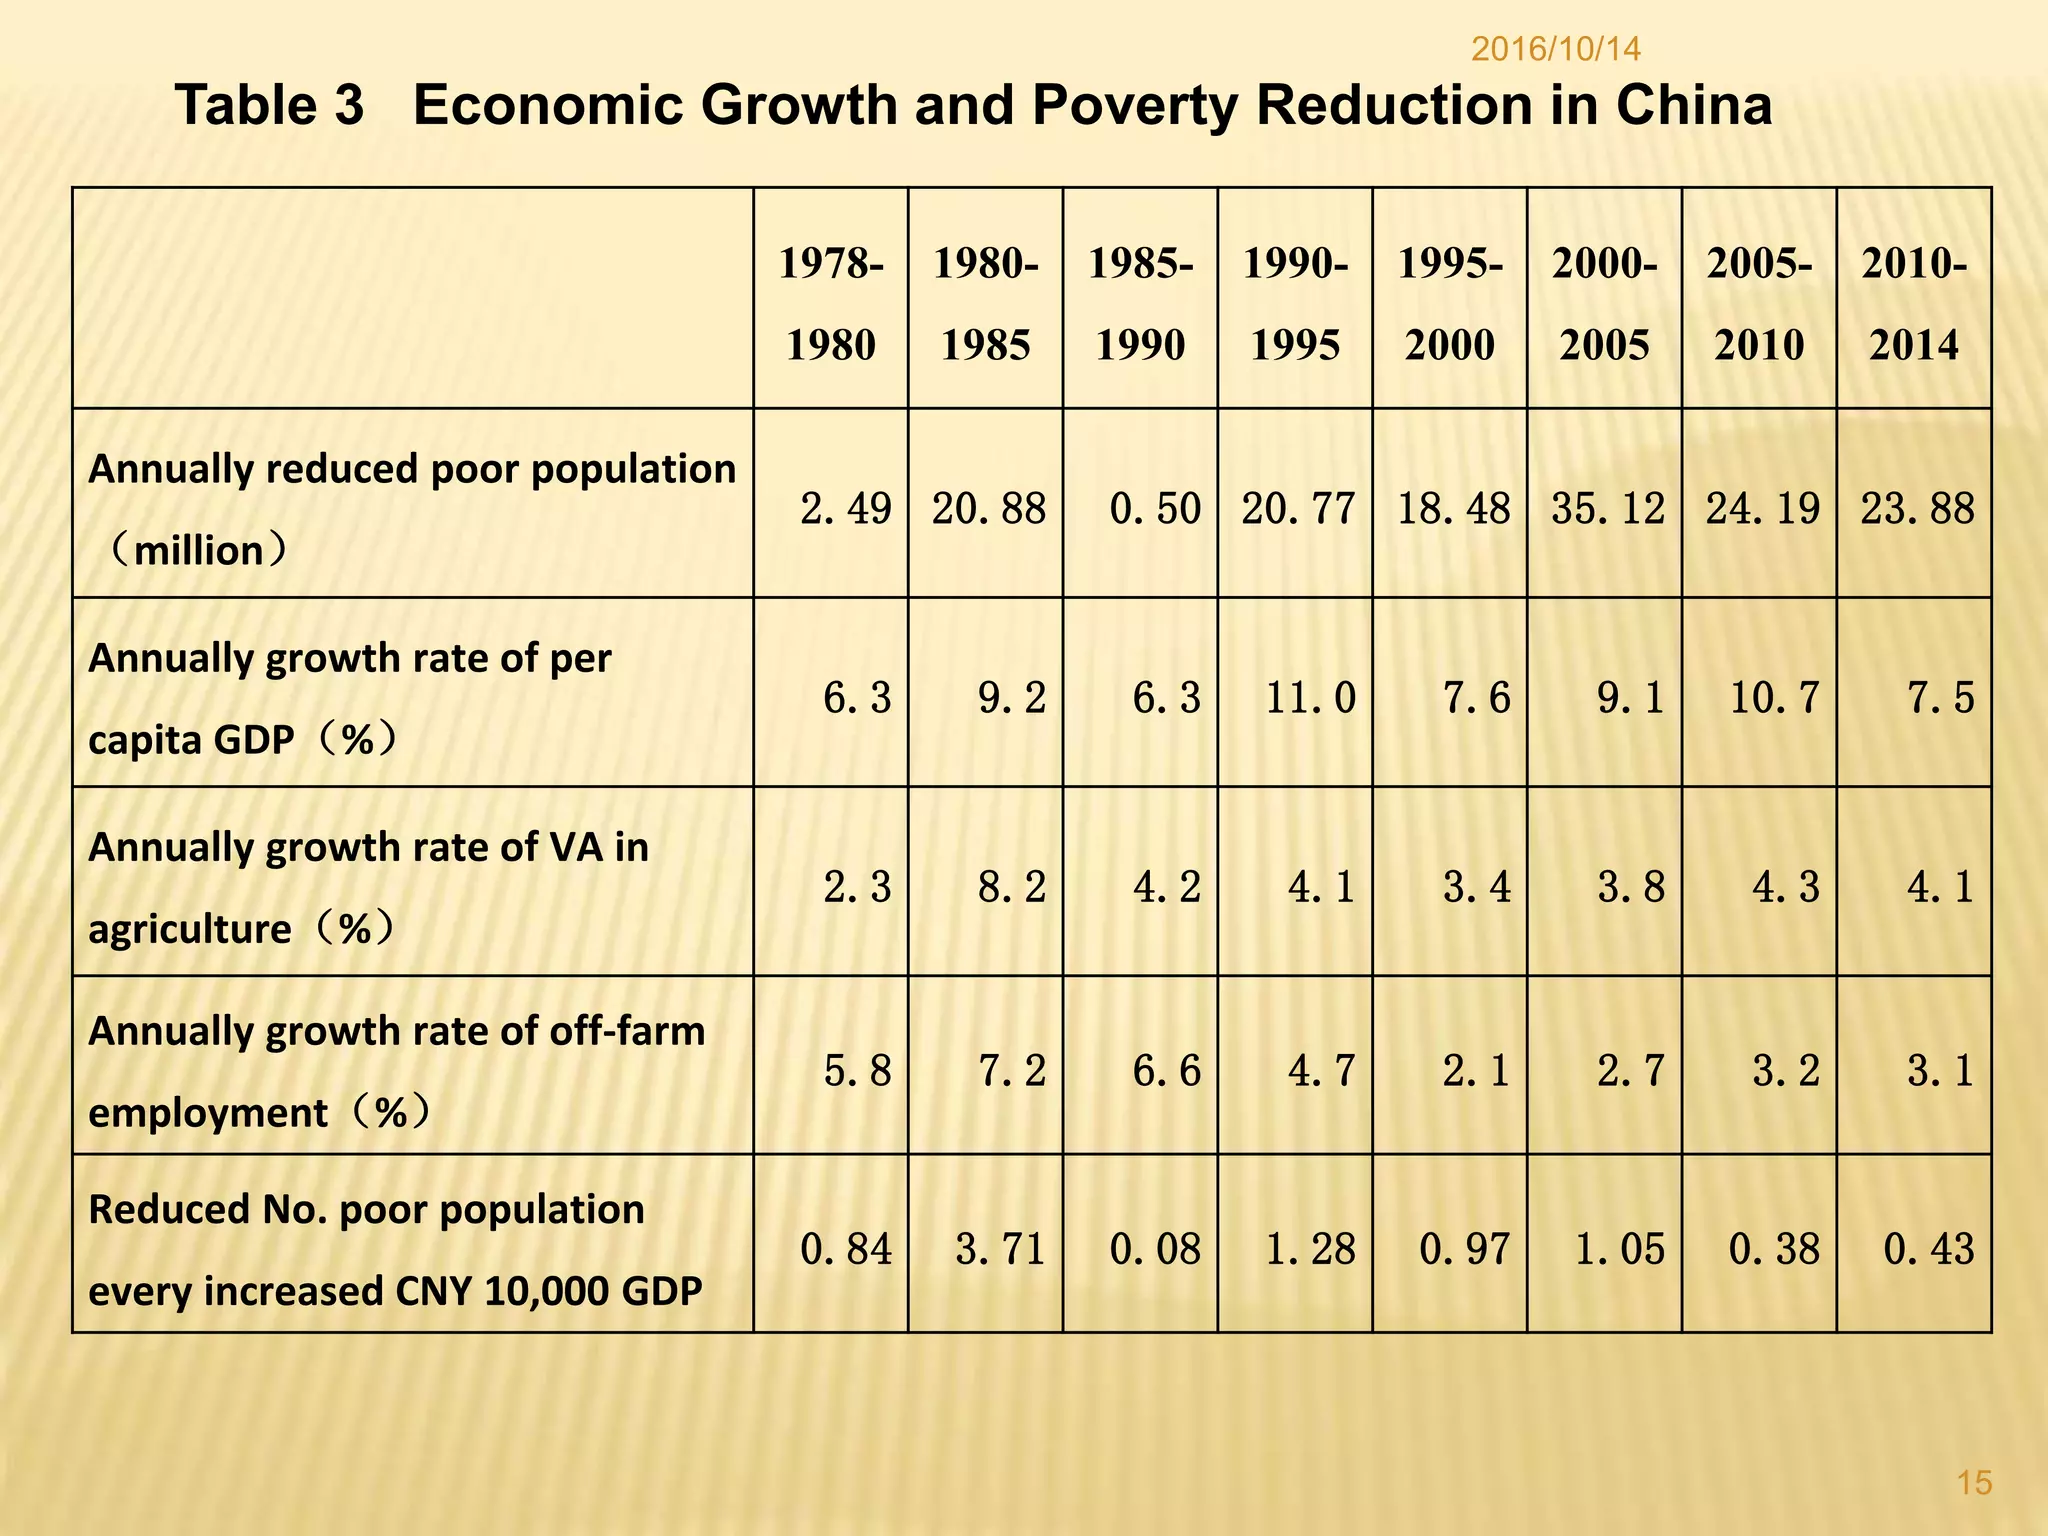
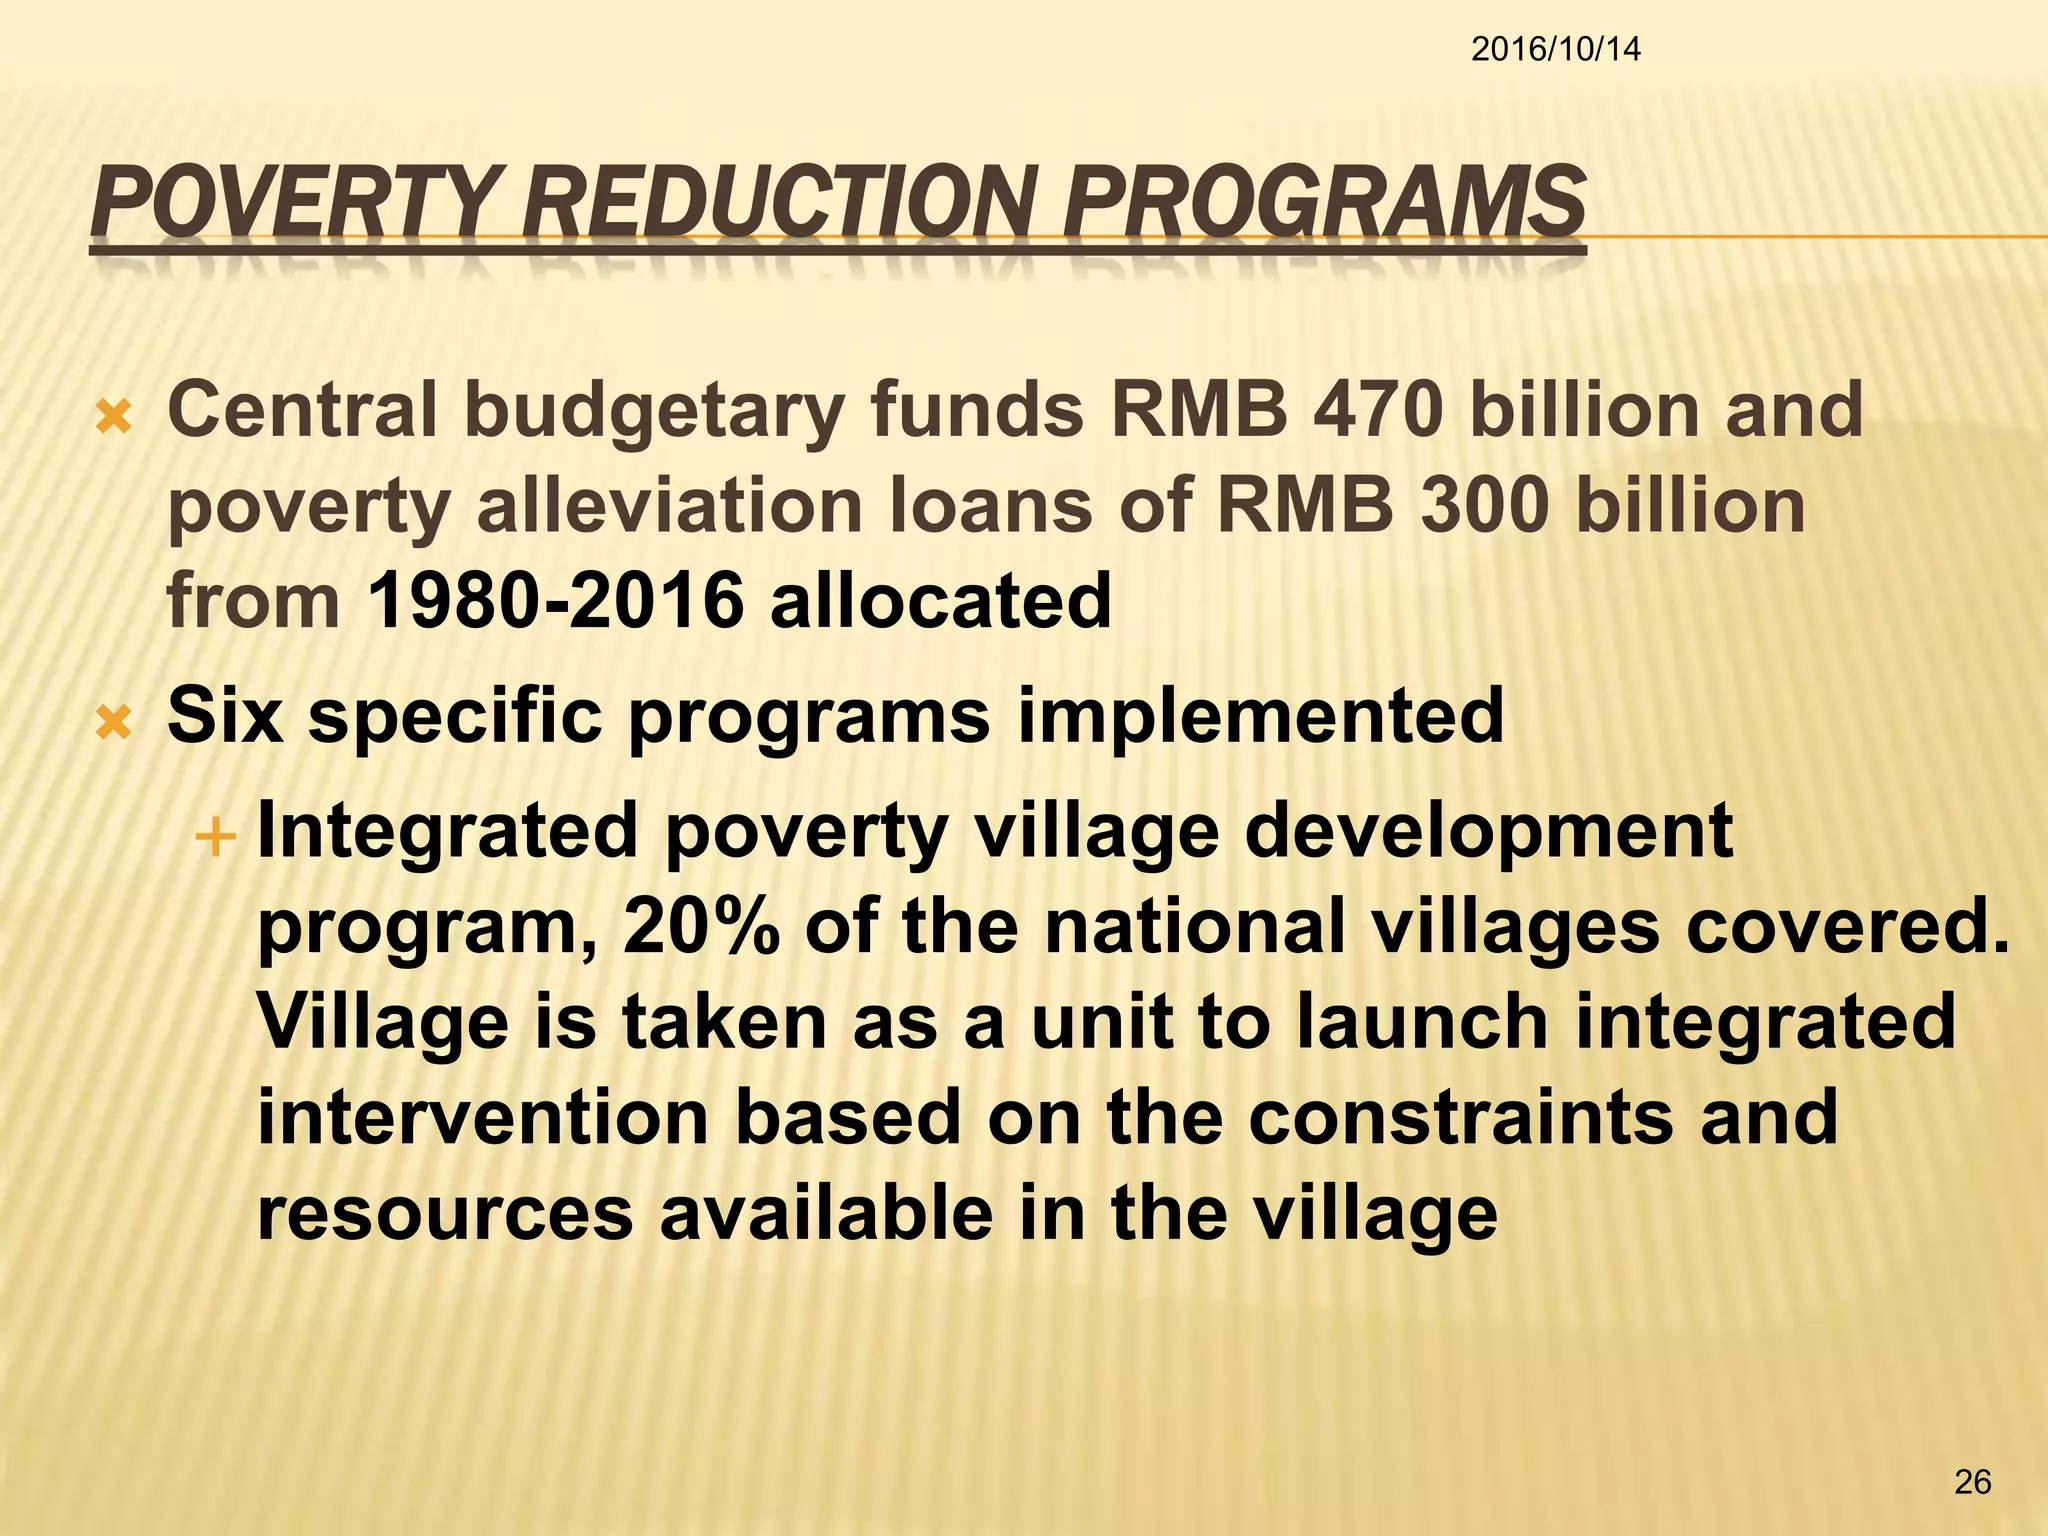
CHINA’S LESSONS IN RURAL POVERTY
REDUCTION
Guobao WU, Professor, Director
Center for Poverty Studies
Chinese Academy of Social Sciences
ISSUES DISCUSSED
 Definitions of Some Concepts Related to
China’s Poverty Reduction
 China’s Progress made in Poverty
Reduction
 Factors underling China’s success in
poverty reduction
 Lessons
2016/10/14
2
DEFINITIONS OF SOME CONCEPTS RELATED TO
CHINA’S POVERTY REDUCTION
 Poverty in China usually refers to rural poverty
 Poverty lines
 The first poverty line built in 1986 was defined as per
capita net income of RMB 200 in 1984’s price, about
56% of the national per capita income, but declined to
only 19% of the national average by 2008
 Modified in 2008 by raising the old line by 1/3, but
being only one-quarter of the national average
 Updated in 2011 with per capita net income almost
doubled (up by 92%), about 21% higher than USD 1.9
per day (2011 PPP)
2016/10/14
3
DEFINITIONS OF SOME CONCEPTS RELATED TO
CHINA’S POVERTY REDUCTION
 Poor households
 Identified by local GOV’T according to estimated
income and physically distinguished indicators
 Eligible for access to any poverty reduction projects
and resources allocated by the GOV’T
 Key villages (communities) for poverty reduction
 designated by provincial GOV’T based on the criteria
(% poor population, infrastructure access, etc.)
 Eligible for access to any poverty reduction projects
 148,000 villages designated as poverty villages in
2002 and 128,000 in 2015
2016/10/14
4
DEFINITIONS OF SOME CONCEPTS RELATED TO
CHINA’S POVERTY REDUCTION
 Poverty-stricken counties (poor counties)
 Designated by the national GOV’T since 1986 based on income and
development criteria
 Eligible for access to any poverty reduction projects and resources
allocated by central GOV’T
 Serve as the units for planning, implementation and administration of
poverty reduction project
 Poverty blocks
 Regions that encompass contiguous poverty-stricken counties
 Designated by national GOV’T, totally 14 blocks defined in 2011
 Serve as units for planning and coordination of poverty reduction
programs
2016/10/14
5
DEFINITIONS OF SOME CONCEPTS RELATED TO
CHINA’S POVERTY REDUCTION
 Poverty alleviation and development
 Development oriented poverty alleviation focusing on
improving the capacities of the poor and poor areas to escape
of poverty by themselves
 One most important way for poverty reduction of Chinese
characteristics
 Major poverty alleviation and development phases
 1st stage of poverty alleviation and development 1986-1993
 China “Lifting Eighty Million out of Poverty in Seven Years”
program (1994-2000)
 China Poverty Alleviation and Development Program (2001-
2010)
 China Poverty Alleviation and Development Program (2011-2020)
 Precision Targeting Poverty Reduction and Development (2014-)
2016/10/14
6
CHINA’S PROGRESS MADE IN POVERTY
REDUCTION
 The number of rural poor population
declined dramatically since 1978
 Marked progress made in human
development
2016/10/14
7
2016/10/14
8
Figure 1 Change of poor population in rural China
over time
770.39 765.42
661.01 658.49
554.63
462.24
286.62
165.67
122.38
98.99 82.49 70.17 55.75
877.803648
785.502408
755.809502
511.979775507.860796
244.4475
149.555978
106.18627
87.39029
25.11153
0
100
200
300
400
500
600
700
800
900
1000
1978 1980 1985 1990 1995 2000 2005 2010 2011 2012 2013 2014 2015
million
Official poverty line USD 1.9 per day
2016/10/14
9
96.2
73.5
49.8
17.2
12.7
10.2 8.5 7.2 5.7
95.6
78.95
56.4
21.3
15.44
12.98
3.38
0
10
20
30
40
50
60
70
80
90
100
1980 1990 2000 2010 2011 2012 2013 2014 2015
Head count ratio based on official poverty line Head count ratio based on USD 1.9 per day (2011 ppp)
Figure 2 Change of poverty head count ratio
in rural China over time
2016/10/14
10
Worldwide China
1981 1997.28 877.8
1990 1850.54 755.81
2013 766.62 25.11
Change in size of the
poor population 1990-2013
-1083.92 -730.7
China’s contribution 67.41%
Change in size of the
poor population 1981-2013
-1230.66 -852.69
China’s contribution 69.29%
Table 1 China’s contribution toward
worldwide poverty reduction(1.90 USD a
day, 2011 PPP) : 1981-2013
2016/10/14
11
Figure 3 Change in China’s Human
Development Index over 1980-2014
0.43
0.467
0.501
0.545
0.588
0.641
0.699 0.707 0.718 0.723 0.728
0
0.1
0.2
0.3
0.4
0.5
0.6
0.7
0.8
1980 1985 1990 1995 2000 2005 2010 2011 2012 2013 2014
2016/10/14
12
Indicator Period Value
Life expectancy at birth 1970–75 63.2
2014 75.8
Infant mortality (per 1000) 1970 85
2013 10.9
Under 5 mortality (per 1000) 1970 120
2013 12.7
Adult literacy (%) 1985–94 77.9
2010 95.1
Maternal mortality (per 1000) 1990–2005 51
2015 27
Access to improved drinking
water sources (%)
1990 67
2015 96
Table 2 China's Change in Human Development Indices
Source: UNDP: http://mdgs.un.org/unsd/mdg/Data.aspx
KEY FACTORS UNDERLINING THE
ACHIEVEMENTS MADE IN PR
 Sustained economic growth, combined with
 Pro-poor growth pattern
 Targeting poverty reduction intervention
 Improvement in access to social services
 Social security system established for
protecting the vulnerable from falling in poverty
 Participation of all concerned actors
 Improvement in management effectiveness
 Innovation in poverty reduction
2016/10/14
13
SUSTAINED ECONOMIC GROWTH
 The poverty reduction in China has been
supported by sustained economic growth,
which works by means of
 Creating jobs
 Increasing demands for agricultural products
 And increasing the fiscal capacity for
financing the poverty reduction program
2016/10/14
14
2016/10/14
15
Table 3 Economic Growth and Poverty Reduction in China
1978-
1980
1980-
1985
1985-
1990
1990-
1995
1995-
2000
2000-
2005
2005-
2010
2010-
2014
Annually reduced poor population
(million)
2.49 20.88 0.50 20.77 18.48 35.12 24.19 23.88
Annually growth rate of per
capita GDP(%)
6.3 9.2 6.3 11.0 7.6 9.1 10.7 7.5
Annually growth rate of VA in
agriculture(%)
2.3 8.2 4.2 4.1 3.4 3.8 4.3 4.1
Annually growth rate of off-farm
employment(%)
5.8 7.2 6.6 4.7 2.1 2.7 3.2 3.1
Reduced No. poor population
every increased CNY 10,000 GDP
0.84 3.71 0.08 1.28 0.97 1.05 0.38 0.43
GROWTH PATTERN BENEFITING TO THE POOR
 Agricultural development, which has been
one of the priorities of the national
development strategy, has made a large
contribution to the poverty reduction in
China
 The value added of agriculture has grown 4.5%
annually over 1978-2014
2016/10/14
16
GROWTH PATTERN BENEFITING TO THE POOR
 Example: agricultural development and poverty
reduction over 1978-1985 in China
 The farmers’ income mainly achieved through
increasing agricultural income, had increased 1.5
folds while the income distribution kept unchanged
over 1978-1984, leading to halving of the rural poor
population
 Major interventions were to increase the farmers’
access to land utilization, increasing agricultural
productivity
2016/10/14
17
GROWTH PATTERN BENEFITING TO THE POOR
 The agricultural development for poverty
reduction in China further enhanced by
Improving physical infrastructure
Improving Technical extension networks
Restructuring production organizations
Industrialization of agriculture
2016/10/14
18
GROWTH PATTERN BENEFITING TO THE POOR
 Developing labor intensive economies (e.g.
processing industry, construction and
services) through fast industrialization and
urbanization supported by increasing the
government investment and FDI
 The rural migrated labors increased to 169 million in 2015
from 1.7 million in 1980
 The incomes of rural residents earned from off-farm
employment in China had increased 134% faster than the
average income from 1983 to 2012.
 The share of off-farm income for bottom 20% HHs has
increased to 43% in 2012 from 26% in 2002
2016/10/14
19
GROWTH PATTERN BENEFITING TO THE POOR
− Sustained and extensive development in
physical infrastructure
• Improving the living conditions
• Increasing social productivities
• Creating employments
2016/10/14
20
GROWTH PATTERN BENEFITING TO THE POOR
 Supporting the development of SMEs
 81 million more jobs created by SMEs in rural
China from 1992 to 2014
 Market integration and supportive policies
 Reducing regional disparity
 Regional integration
 Special regional development programs, in
particular, the west development strategy
2016/10/14
21
A CASE: WEST DEVELOPMENT STRATEGY
 The west regions with 71% of total land areas and 26%
of population fell behind the rest of the country in
development
 Starting from 2000, total investment amounted to RMB
6.1 trillion up to 2014
 Major interventions: improving physical and
environmental infrastructure, social services, and
supporting the development of growth centers
 The gap of GDP per capita between the west and the
rest declined
 Gaps remained
2016/10/14
22
2016/10/14
23
60
70
80
90
100
110
120
130
140
150
160
170
2000 2001 2002 2003 2004 2005 2006 2007 2008 2009 2010 2011 2012 2013 2014
%ofnationalaverage
East region
Central region
West region
Figure 4 Change in the rate of GDP per capita in
three regions against national average
TARGETING POVERTY REDUCTION INTERVENTION
 Intervention of Chinese characteristics, but it
does work well for poverty reduction
 Focusing on raising the capacities of the poor and
poor areas and improving their access to assets
to reduce poverty by themselves
 Area targeting poverty intervention, 18 regions
1986, 592 counties identified 1994, 148,000
villages identified 2001,14 blocks identified in
2011
 Comprehensive interventions
 Interventions based on the contexts and causes
of poverty in the targeting areas
2016/10/14
24
TARGETING POVERTY REDUCTION INTERVENTION
 Major interventions
improving physical infrastructure, such
as road, electricity, water supply,
irrigation;
improving social services, mainly
education, health care, social assistance;
Supporting income generation by
providing technical training and access
to credit
Assisting in migrated employment
Resettlement of the poor living in the
remote and ecologically fragile areas
2016/10/14
25
POVERTY REDUCTION PROGRAMS
 Central budgetary funds RMB 470 billion and
poverty alleviation loans of RMB 300 billion
from 1980-2016 allocated
 Six specific programs implemented
 Integrated poverty village development
program, 20% of the national villages covered.
Village is taken as a unit to launch integrated
intervention based on the constraints and
resources available in the village
2016/10/14
26
POVERTY REDUCTION PROGRAMS
 Agricultural industrialization for poverty
reduction program by supporting the
leading modern agricultural production and
processing business to link the poor small
holders to market,625 dragon head
enterprises identified and 10 million poor
farmers benefitted
 Training for the poor labors to gain outside
employment program by skill training for
poor labors to earn more wage and salaries
2016/10/14
27
POVERTY REDUCTION PROGRAMS
 Resettlement for poverty reduction program by
resettling the poor in the areas lacking
necessary production and living conditions, over
four million farmers resettled
 Public works (food for work) program, RMB 102
billion allocated through the program for rural
infrastructure
 Government department participation in poverty
reduction, 320 central departments and large
state owned enterprises involved and mobilized
over RMB 80 billion funds and human resources
in last five years
2016/10/14
28
POVERTY REDUCTION PROGRAMS
 East-west partnership for poverty reduction built
at government, corporates and individual level.
The areas cover funding, human resources and
business cooperation on basis of social
responsibility and mutual benefit principles
 NGO’s involvement in poverty reduction.
Contributions by social and civil society
organizations have mostly been in the areas of
resource mobilization and the promoting of
innovation in ways for poverty reduction in addition
to donations
2016/10/14
29
2016/10/14
30
Year
% Villages
accessible to
motorable road
% Villages
accessible to
electricity
% Villages
accessible to
telephone
% Villages
accessible to TV
signals
National
Average
Poor
counties
National
Average
Poor
counties
National
Average
Poor
counties
National
Average
Poor
counties
2000 95.0 92.6 98.1 96.5 87.0 78.3 97.8 96.0
2001 96.0 92.1 98.3 96.0 90.8 72.5 98.1 95.4
2002 96.8 95.4 98.4 96.8 92.2 83.8 98.4 95.8
2003 97.6 96.6 99.0 97.7 95.5 88.4 98.8 96.2
2004 98.0 97.5 99.0 97.8 96.7 90.5 99.1 96.5
2005 97.2 97.8 99.2 98.0 97.1 93.7 98.3 96.4
2006 97.8 99.1 99.4 98.3 98.1 97.2 98.6 97.9
2007 98.6 98.7 99.7 98.3 98.7 97.4 98.9 97.8
2008 98.7 99.0 99.5 98.7 98.7 98.0 99.1 98.0
2009 98.8 99.2 99.6 98.6 99.1 98.2 99.4 98.0
2010 99.1 99.5 99.7 98.8 99.3 98.4 99.5 98.3
Change
2000-
2010
4.1 6.9 1.6 2.3 12.3 20.1 1.7 2.3
Table 4 Change in Physical Infrastructure in Poor Counties
PRECISION TARGETING POVERTY REDUCTION
AND DEVELOPMENT STRATEGY
 Starting in 2014, the strategy focusing on
targeting all the resources at the real poor to
improve the effectiveness of poverty
reduction
 Identifying all eligible poor households and
villages
 Case by case intervention and assistance
provided to each poor household
 M&E strengthened
 Responsibility system built
2016/10/14
31
IMPROVING THE ACCESS OF THE POOR TO SOCIAL
SERVICES
 Education
 Universal free compulsory education to improve the
access and affordability of the poor
 Special program on improving the education in poor
areas
 Compulsory Education Program in Poor Areas
 Incorporating education development into the poverty
alleviation and development program
 Extra educational supports for the poor
 Free tuition for the students in technical school
 Subsidies the dormitories of senior high school students
 Free lunch for all students in poverty blocks
2016/10/14
32
2016/10/14
33
Year
National Rural Average Poor Counties
Age
7—15
Of which
Age
7—15
Of which
Girl
Age
7—12
Age
13—15
Girl
Age
7—12
Age
13—15
2002 94.4 93.5 96.2 92.3 91.0 89.2 94.9 85.4
2003 95.8 95.3 97.4 93.9 92.2 91.0 95.2 88.4
2004 97.3 97.1 98.5 95.9 93.5 92.8 95.8 90.7
2005 97.2 97.1 98.5 95.5 94.6 94.1 96.9 91.7
2006 98.3 98.4 99.2 97.3 95.3 95.1 97.0 92.9
2007 97.4 96.9 98.2 96.6 96.4 96.3 97.7 94.4
2008 97.6 97.7 97.2 98.1 97.0 96.7 97.9 95.7
2009 97.9 97.9 97.8 97.9 97.4 97.2 98.2 96.2
2010 98.0 98.1 97.7 98.6 97.7 97.6 98.3 96.8
2002-
2010
3.6 4.6 1.5 6.3 6.7 8.4 3.4 11.4
Table 5 Change in Schooling rate in Poor Counties over 2002-2010
(%)
IMPROVING THE ACCESS OF THE POOR TO
SOCIAL SERVICES
 Medical care
 Improving access and affordability of the
poor by establishing rural cooperative
medical care insurance system, covering all
rural residents
 Improving clinics in poor villages, 94%
villages with clinics
 Training of the doctors in poor rural areas
2016/10/14
34
SOCIAL SECURITY SYSTEM ESTABLISHED FOR PROTECTING THE
VULNERABLE FROM FALLING IN POVERTY
 Rural Minimum living allowance scheme
 Adopted nationwide since 2007
 50 million rural residents benefitted
 Funded by central and local GOV’T,3/4 by central
GOV’T
 Lower and varied thresholds
 Leakage of real poor and spill-over of resources
2016/10/14
35
SOCIAL SECURITY SYSTEM ESTABLISHED FOR PROTECTING
THE VULNERABLE FROM FALLING IN POVERTY
 Rural social pension insurance scheme
 Piloted in 2009 and covered all counties by the
end of 2012
 Jointly funded by individuals, local and central
GOV’T
 Lower standards and full coverage
2016/10/14
36
SOCIAL SECURITY SYSTEM ESTABLISHED FOR PROTECTING
THE VULNERABLE FROM FALLING IN POVERTY
 Program for supporting the aged and
orphans without family’s supporting
 One social security of long history started in
1950’s
 Combining financial supports with income from
land utilization
 Direct assistance and relief system
 Medical assistance to those suffered serious
illness
 Assistance to the poor children for education
2016/10/14
37
PARTICIPATION OF ALL CONCERNED ACTORS
 Government plays dominated roles
 Establishing leadership for poverty reduction
 The leadership group for poverty alleviation established
from central down to townships
 Offices and staffs designated in each level of GOV’T
 Integrating poverty reduction into national
development planning
 Making strategies and policies for poverty reduction
 Allocating special funds
 Mobilizing participation of departmental and local
GOV’T
 governments Responsibility system for poverty reduction
2016/10/14
38
PARTICIPATION OF ALL CONCERNED ACTORS
 Private sector makes largest contribution by
creating jobs, taxes, and providing direct
assistance
 Civil organizations work in social mobilization,
innovation of poverty reduction ways
 International organizations brought in new
ideas and knowledge
 Empowerment to the poor
 participation of the poor in project planning,
implementation, and M&E
 Allow the poor make their own choices
2016/10/14
39
IMPROVEMENT IN MANAGEMENT
EFFECTIVENESS
 Attention drawn to improving governance,
accountability of the management of poverty
intervention projects and fund delivery,
utilization
 institutionalizing transparent and participatory
planning , implementation, and M&E
 Efforts made to improve the effectiveness and
targeting of poverty reduction projects
2016/10/14
40
PROCESS AND DYNAMICS OF INNOVATIONS IN
POVERTY REDUCTION IN CHINA
 Learning from outside and the past
 Pilot first, and upscale the effective ones
 Listening to the grassroots (incl. NGOs
and communities) . But It takes time
2016/10/14
41
LESSONS LEARNED
 Pro-poor growth pattern and strategy
 Pay more attention to the social development
of the poor
 Targeting poverty intervention, when
possible
 Participation of all actors in poverty
reduction
 Pilot first, scale up
 Management matters in poverty reduction
 Right direction is more important
2016/10/14
42
WUGUOBAO@CASS.ORG.CN
Thanks
for your attention!!

China's lessons in poverty reduction

  • 1.
    CHINA’S LESSONS INRURAL POVERTY REDUCTION Guobao WU, Professor, Director Center for Poverty Studies Chinese Academy of Social Sciences
  • 2.
    ISSUES DISCUSSED  Definitionsof Some Concepts Related to China’s Poverty Reduction  China’s Progress made in Poverty Reduction  Factors underling China’s success in poverty reduction  Lessons 2016/10/14 2
  • 3.
    DEFINITIONS OF SOMECONCEPTS RELATED TO CHINA’S POVERTY REDUCTION  Poverty in China usually refers to rural poverty  Poverty lines  The first poverty line built in 1986 was defined as per capita net income of RMB 200 in 1984’s price, about 56% of the national per capita income, but declined to only 19% of the national average by 2008  Modified in 2008 by raising the old line by 1/3, but being only one-quarter of the national average  Updated in 2011 with per capita net income almost doubled (up by 92%), about 21% higher than USD 1.9 per day (2011 PPP) 2016/10/14 3
  • 4.
    DEFINITIONS OF SOMECONCEPTS RELATED TO CHINA’S POVERTY REDUCTION  Poor households  Identified by local GOV’T according to estimated income and physically distinguished indicators  Eligible for access to any poverty reduction projects and resources allocated by the GOV’T  Key villages (communities) for poverty reduction  designated by provincial GOV’T based on the criteria (% poor population, infrastructure access, etc.)  Eligible for access to any poverty reduction projects  148,000 villages designated as poverty villages in 2002 and 128,000 in 2015 2016/10/14 4
  • 5.
    DEFINITIONS OF SOMECONCEPTS RELATED TO CHINA’S POVERTY REDUCTION  Poverty-stricken counties (poor counties)  Designated by the national GOV’T since 1986 based on income and development criteria  Eligible for access to any poverty reduction projects and resources allocated by central GOV’T  Serve as the units for planning, implementation and administration of poverty reduction project  Poverty blocks  Regions that encompass contiguous poverty-stricken counties  Designated by national GOV’T, totally 14 blocks defined in 2011  Serve as units for planning and coordination of poverty reduction programs 2016/10/14 5
  • 6.
    DEFINITIONS OF SOMECONCEPTS RELATED TO CHINA’S POVERTY REDUCTION  Poverty alleviation and development  Development oriented poverty alleviation focusing on improving the capacities of the poor and poor areas to escape of poverty by themselves  One most important way for poverty reduction of Chinese characteristics  Major poverty alleviation and development phases  1st stage of poverty alleviation and development 1986-1993  China “Lifting Eighty Million out of Poverty in Seven Years” program (1994-2000)  China Poverty Alleviation and Development Program (2001- 2010)  China Poverty Alleviation and Development Program (2011-2020)  Precision Targeting Poverty Reduction and Development (2014-) 2016/10/14 6
  • 7.
    CHINA’S PROGRESS MADEIN POVERTY REDUCTION  The number of rural poor population declined dramatically since 1978  Marked progress made in human development 2016/10/14 7
  • 8.
    2016/10/14 8 Figure 1 Changeof poor population in rural China over time 770.39 765.42 661.01 658.49 554.63 462.24 286.62 165.67 122.38 98.99 82.49 70.17 55.75 877.803648 785.502408 755.809502 511.979775507.860796 244.4475 149.555978 106.18627 87.39029 25.11153 0 100 200 300 400 500 600 700 800 900 1000 1978 1980 1985 1990 1995 2000 2005 2010 2011 2012 2013 2014 2015 million Official poverty line USD 1.9 per day
  • 9.
    2016/10/14 9 96.2 73.5 49.8 17.2 12.7 10.2 8.5 7.25.7 95.6 78.95 56.4 21.3 15.44 12.98 3.38 0 10 20 30 40 50 60 70 80 90 100 1980 1990 2000 2010 2011 2012 2013 2014 2015 Head count ratio based on official poverty line Head count ratio based on USD 1.9 per day (2011 ppp) Figure 2 Change of poverty head count ratio in rural China over time
  • 10.
    2016/10/14 10 Worldwide China 1981 1997.28877.8 1990 1850.54 755.81 2013 766.62 25.11 Change in size of the poor population 1990-2013 -1083.92 -730.7 China’s contribution 67.41% Change in size of the poor population 1981-2013 -1230.66 -852.69 China’s contribution 69.29% Table 1 China’s contribution toward worldwide poverty reduction(1.90 USD a day, 2011 PPP) : 1981-2013
  • 11.
    2016/10/14 11 Figure 3 Changein China’s Human Development Index over 1980-2014 0.43 0.467 0.501 0.545 0.588 0.641 0.699 0.707 0.718 0.723 0.728 0 0.1 0.2 0.3 0.4 0.5 0.6 0.7 0.8 1980 1985 1990 1995 2000 2005 2010 2011 2012 2013 2014
  • 12.
    2016/10/14 12 Indicator Period Value Lifeexpectancy at birth 1970–75 63.2 2014 75.8 Infant mortality (per 1000) 1970 85 2013 10.9 Under 5 mortality (per 1000) 1970 120 2013 12.7 Adult literacy (%) 1985–94 77.9 2010 95.1 Maternal mortality (per 1000) 1990–2005 51 2015 27 Access to improved drinking water sources (%) 1990 67 2015 96 Table 2 China's Change in Human Development Indices Source: UNDP: http://mdgs.un.org/unsd/mdg/Data.aspx
  • 13.
    KEY FACTORS UNDERLININGTHE ACHIEVEMENTS MADE IN PR  Sustained economic growth, combined with  Pro-poor growth pattern  Targeting poverty reduction intervention  Improvement in access to social services  Social security system established for protecting the vulnerable from falling in poverty  Participation of all concerned actors  Improvement in management effectiveness  Innovation in poverty reduction 2016/10/14 13
  • 14.
    SUSTAINED ECONOMIC GROWTH The poverty reduction in China has been supported by sustained economic growth, which works by means of  Creating jobs  Increasing demands for agricultural products  And increasing the fiscal capacity for financing the poverty reduction program 2016/10/14 14
  • 15.
    2016/10/14 15 Table 3 EconomicGrowth and Poverty Reduction in China 1978- 1980 1980- 1985 1985- 1990 1990- 1995 1995- 2000 2000- 2005 2005- 2010 2010- 2014 Annually reduced poor population (million) 2.49 20.88 0.50 20.77 18.48 35.12 24.19 23.88 Annually growth rate of per capita GDP(%) 6.3 9.2 6.3 11.0 7.6 9.1 10.7 7.5 Annually growth rate of VA in agriculture(%) 2.3 8.2 4.2 4.1 3.4 3.8 4.3 4.1 Annually growth rate of off-farm employment(%) 5.8 7.2 6.6 4.7 2.1 2.7 3.2 3.1 Reduced No. poor population every increased CNY 10,000 GDP 0.84 3.71 0.08 1.28 0.97 1.05 0.38 0.43
  • 16.
    GROWTH PATTERN BENEFITINGTO THE POOR  Agricultural development, which has been one of the priorities of the national development strategy, has made a large contribution to the poverty reduction in China  The value added of agriculture has grown 4.5% annually over 1978-2014 2016/10/14 16
  • 17.
    GROWTH PATTERN BENEFITINGTO THE POOR  Example: agricultural development and poverty reduction over 1978-1985 in China  The farmers’ income mainly achieved through increasing agricultural income, had increased 1.5 folds while the income distribution kept unchanged over 1978-1984, leading to halving of the rural poor population  Major interventions were to increase the farmers’ access to land utilization, increasing agricultural productivity 2016/10/14 17
  • 18.
    GROWTH PATTERN BENEFITINGTO THE POOR  The agricultural development for poverty reduction in China further enhanced by Improving physical infrastructure Improving Technical extension networks Restructuring production organizations Industrialization of agriculture 2016/10/14 18
  • 19.
    GROWTH PATTERN BENEFITINGTO THE POOR  Developing labor intensive economies (e.g. processing industry, construction and services) through fast industrialization and urbanization supported by increasing the government investment and FDI  The rural migrated labors increased to 169 million in 2015 from 1.7 million in 1980  The incomes of rural residents earned from off-farm employment in China had increased 134% faster than the average income from 1983 to 2012.  The share of off-farm income for bottom 20% HHs has increased to 43% in 2012 from 26% in 2002 2016/10/14 19
  • 20.
    GROWTH PATTERN BENEFITINGTO THE POOR − Sustained and extensive development in physical infrastructure • Improving the living conditions • Increasing social productivities • Creating employments 2016/10/14 20
  • 21.
    GROWTH PATTERN BENEFITINGTO THE POOR  Supporting the development of SMEs  81 million more jobs created by SMEs in rural China from 1992 to 2014  Market integration and supportive policies  Reducing regional disparity  Regional integration  Special regional development programs, in particular, the west development strategy 2016/10/14 21
  • 22.
    A CASE: WESTDEVELOPMENT STRATEGY  The west regions with 71% of total land areas and 26% of population fell behind the rest of the country in development  Starting from 2000, total investment amounted to RMB 6.1 trillion up to 2014  Major interventions: improving physical and environmental infrastructure, social services, and supporting the development of growth centers  The gap of GDP per capita between the west and the rest declined  Gaps remained 2016/10/14 22
  • 23.
    2016/10/14 23 60 70 80 90 100 110 120 130 140 150 160 170 2000 2001 20022003 2004 2005 2006 2007 2008 2009 2010 2011 2012 2013 2014 %ofnationalaverage East region Central region West region Figure 4 Change in the rate of GDP per capita in three regions against national average
  • 24.
    TARGETING POVERTY REDUCTIONINTERVENTION  Intervention of Chinese characteristics, but it does work well for poverty reduction  Focusing on raising the capacities of the poor and poor areas and improving their access to assets to reduce poverty by themselves  Area targeting poverty intervention, 18 regions 1986, 592 counties identified 1994, 148,000 villages identified 2001,14 blocks identified in 2011  Comprehensive interventions  Interventions based on the contexts and causes of poverty in the targeting areas 2016/10/14 24
  • 25.
    TARGETING POVERTY REDUCTIONINTERVENTION  Major interventions improving physical infrastructure, such as road, electricity, water supply, irrigation; improving social services, mainly education, health care, social assistance; Supporting income generation by providing technical training and access to credit Assisting in migrated employment Resettlement of the poor living in the remote and ecologically fragile areas 2016/10/14 25
  • 26.
    POVERTY REDUCTION PROGRAMS Central budgetary funds RMB 470 billion and poverty alleviation loans of RMB 300 billion from 1980-2016 allocated  Six specific programs implemented  Integrated poverty village development program, 20% of the national villages covered. Village is taken as a unit to launch integrated intervention based on the constraints and resources available in the village 2016/10/14 26
  • 27.
    POVERTY REDUCTION PROGRAMS Agricultural industrialization for poverty reduction program by supporting the leading modern agricultural production and processing business to link the poor small holders to market,625 dragon head enterprises identified and 10 million poor farmers benefitted  Training for the poor labors to gain outside employment program by skill training for poor labors to earn more wage and salaries 2016/10/14 27
  • 28.
    POVERTY REDUCTION PROGRAMS Resettlement for poverty reduction program by resettling the poor in the areas lacking necessary production and living conditions, over four million farmers resettled  Public works (food for work) program, RMB 102 billion allocated through the program for rural infrastructure  Government department participation in poverty reduction, 320 central departments and large state owned enterprises involved and mobilized over RMB 80 billion funds and human resources in last five years 2016/10/14 28
  • 29.
    POVERTY REDUCTION PROGRAMS East-west partnership for poverty reduction built at government, corporates and individual level. The areas cover funding, human resources and business cooperation on basis of social responsibility and mutual benefit principles  NGO’s involvement in poverty reduction. Contributions by social and civil society organizations have mostly been in the areas of resource mobilization and the promoting of innovation in ways for poverty reduction in addition to donations 2016/10/14 29
  • 30.
    2016/10/14 30 Year % Villages accessible to motorableroad % Villages accessible to electricity % Villages accessible to telephone % Villages accessible to TV signals National Average Poor counties National Average Poor counties National Average Poor counties National Average Poor counties 2000 95.0 92.6 98.1 96.5 87.0 78.3 97.8 96.0 2001 96.0 92.1 98.3 96.0 90.8 72.5 98.1 95.4 2002 96.8 95.4 98.4 96.8 92.2 83.8 98.4 95.8 2003 97.6 96.6 99.0 97.7 95.5 88.4 98.8 96.2 2004 98.0 97.5 99.0 97.8 96.7 90.5 99.1 96.5 2005 97.2 97.8 99.2 98.0 97.1 93.7 98.3 96.4 2006 97.8 99.1 99.4 98.3 98.1 97.2 98.6 97.9 2007 98.6 98.7 99.7 98.3 98.7 97.4 98.9 97.8 2008 98.7 99.0 99.5 98.7 98.7 98.0 99.1 98.0 2009 98.8 99.2 99.6 98.6 99.1 98.2 99.4 98.0 2010 99.1 99.5 99.7 98.8 99.3 98.4 99.5 98.3 Change 2000- 2010 4.1 6.9 1.6 2.3 12.3 20.1 1.7 2.3 Table 4 Change in Physical Infrastructure in Poor Counties
  • 31.
    PRECISION TARGETING POVERTYREDUCTION AND DEVELOPMENT STRATEGY  Starting in 2014, the strategy focusing on targeting all the resources at the real poor to improve the effectiveness of poverty reduction  Identifying all eligible poor households and villages  Case by case intervention and assistance provided to each poor household  M&E strengthened  Responsibility system built 2016/10/14 31
  • 32.
    IMPROVING THE ACCESSOF THE POOR TO SOCIAL SERVICES  Education  Universal free compulsory education to improve the access and affordability of the poor  Special program on improving the education in poor areas  Compulsory Education Program in Poor Areas  Incorporating education development into the poverty alleviation and development program  Extra educational supports for the poor  Free tuition for the students in technical school  Subsidies the dormitories of senior high school students  Free lunch for all students in poverty blocks 2016/10/14 32
  • 33.
    2016/10/14 33 Year National Rural AveragePoor Counties Age 7—15 Of which Age 7—15 Of which Girl Age 7—12 Age 13—15 Girl Age 7—12 Age 13—15 2002 94.4 93.5 96.2 92.3 91.0 89.2 94.9 85.4 2003 95.8 95.3 97.4 93.9 92.2 91.0 95.2 88.4 2004 97.3 97.1 98.5 95.9 93.5 92.8 95.8 90.7 2005 97.2 97.1 98.5 95.5 94.6 94.1 96.9 91.7 2006 98.3 98.4 99.2 97.3 95.3 95.1 97.0 92.9 2007 97.4 96.9 98.2 96.6 96.4 96.3 97.7 94.4 2008 97.6 97.7 97.2 98.1 97.0 96.7 97.9 95.7 2009 97.9 97.9 97.8 97.9 97.4 97.2 98.2 96.2 2010 98.0 98.1 97.7 98.6 97.7 97.6 98.3 96.8 2002- 2010 3.6 4.6 1.5 6.3 6.7 8.4 3.4 11.4 Table 5 Change in Schooling rate in Poor Counties over 2002-2010 (%)
  • 34.
    IMPROVING THE ACCESSOF THE POOR TO SOCIAL SERVICES  Medical care  Improving access and affordability of the poor by establishing rural cooperative medical care insurance system, covering all rural residents  Improving clinics in poor villages, 94% villages with clinics  Training of the doctors in poor rural areas 2016/10/14 34
  • 35.
    SOCIAL SECURITY SYSTEMESTABLISHED FOR PROTECTING THE VULNERABLE FROM FALLING IN POVERTY  Rural Minimum living allowance scheme  Adopted nationwide since 2007  50 million rural residents benefitted  Funded by central and local GOV’T,3/4 by central GOV’T  Lower and varied thresholds  Leakage of real poor and spill-over of resources 2016/10/14 35
  • 36.
    SOCIAL SECURITY SYSTEMESTABLISHED FOR PROTECTING THE VULNERABLE FROM FALLING IN POVERTY  Rural social pension insurance scheme  Piloted in 2009 and covered all counties by the end of 2012  Jointly funded by individuals, local and central GOV’T  Lower standards and full coverage 2016/10/14 36
  • 37.
    SOCIAL SECURITY SYSTEMESTABLISHED FOR PROTECTING THE VULNERABLE FROM FALLING IN POVERTY  Program for supporting the aged and orphans without family’s supporting  One social security of long history started in 1950’s  Combining financial supports with income from land utilization  Direct assistance and relief system  Medical assistance to those suffered serious illness  Assistance to the poor children for education 2016/10/14 37
  • 38.
    PARTICIPATION OF ALLCONCERNED ACTORS  Government plays dominated roles  Establishing leadership for poverty reduction  The leadership group for poverty alleviation established from central down to townships  Offices and staffs designated in each level of GOV’T  Integrating poverty reduction into national development planning  Making strategies and policies for poverty reduction  Allocating special funds  Mobilizing participation of departmental and local GOV’T  governments Responsibility system for poverty reduction 2016/10/14 38
  • 39.
    PARTICIPATION OF ALLCONCERNED ACTORS  Private sector makes largest contribution by creating jobs, taxes, and providing direct assistance  Civil organizations work in social mobilization, innovation of poverty reduction ways  International organizations brought in new ideas and knowledge  Empowerment to the poor  participation of the poor in project planning, implementation, and M&E  Allow the poor make their own choices 2016/10/14 39
  • 40.
    IMPROVEMENT IN MANAGEMENT EFFECTIVENESS Attention drawn to improving governance, accountability of the management of poverty intervention projects and fund delivery, utilization  institutionalizing transparent and participatory planning , implementation, and M&E  Efforts made to improve the effectiveness and targeting of poverty reduction projects 2016/10/14 40
  • 41.
    PROCESS AND DYNAMICSOF INNOVATIONS IN POVERTY REDUCTION IN CHINA  Learning from outside and the past  Pilot first, and upscale the effective ones  Listening to the grassroots (incl. NGOs and communities) . But It takes time 2016/10/14 41
  • 42.
    LESSONS LEARNED  Pro-poorgrowth pattern and strategy  Pay more attention to the social development of the poor  Targeting poverty intervention, when possible  Participation of all actors in poverty reduction  Pilot first, scale up  Management matters in poverty reduction  Right direction is more important 2016/10/14 42
  • 43.