Feb 2017 - February Bump Is Real: Toronto real estate market charts
Property-prices-double-every-decade?
1. Property prices double every decade?
It is often commented that in Australia property values double every 10 (some say 7) years. This week we
look at whether this has been the case over the past 10 years across the capital cities.
Most people who are interested in residential property would
have heard of the notion that property values double each
decade. This week we are looking at whether or not that has
been true over the past 10 years.
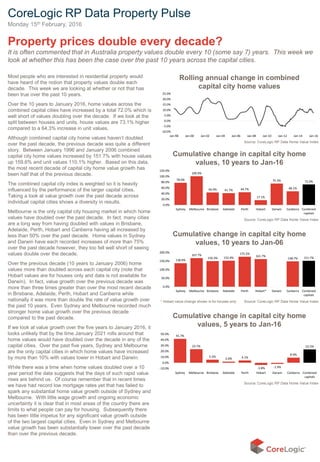
Over the 10 years to January 2016, home values across the
combined capital cities have increased by a total 72.0% which is
well short of values doubling over the decade. If we look at the
split between houses and units, house values are 73.1% higher
compared to a 64.3% increase in unit values.
Although combined capital city home values haven’t doubled
over the past decade, the previous decade was quite a different
story. Between January 1996 and January 2006 combined
capital city home values increased by 151.7% with house values
up 159.6% and unit values 110.1% higher. Based on this data,
the most recent decade of capital city home value growth has
been half that of the previous decade.
The combined capital city index is weighted so it is heavily
influenced by the performance of the larger capital cities.
Taking a look at value growth over the past decade across
individual capital cities shows a diversity in results.
Melbourne is the only capital city housing market in which home
values have doubled over the past decade. In fact, many cities
are a long way from having doubled with values in Brisbane,
Adelaide, Perth, Hobart and Canberra having all increased by
less than 50% over the past decade. Home values in Sydney
and Darwin have each recorded increases of more than 75%
over the past decade however, they too fell well short of seeing
values double over the decade.
Over the previous decade (10 years to January 2006) home
values more than doubled across each capital city (note that
Hobart values are for houses only and data is not available for
Darwin). In fact, value growth over the previous decade was
more than three times greater than over the most recent decade
in Brisbane, Adelaide, Perth, Hobart and Canberra while
nationally it was more than double the rate of value growth over
the past 10 years. Even Sydney and Melbourne recorded much
stronger home value growth over the previous decade
compared to the past decade.
If we look at value growth over the five years to January 2016, it
looks unlikely that by the time January 2021 rolls around that
home values would have doubled over the decade in any of the
capital cities. Over the past five years, Sydney and Melbourne
are the only capital cities in which home values have increased
by more than 10% with values lower in Hobart and Darwin.
While there was a time when home values doubled over a 10
year period the data suggests that the days of such rapid value
rises are behind us. Of course remember that in recent times
we have had record low mortgage rates yet that has failed to
spark any substantial home value growth outside of Sydney and
Melbourne. With little wage growth and ongoing economic
uncertainty it is clear that in most areas of the country there are
limits to what people can pay for housing. Subsequently there
has been little impetus for any significant value growth outside
of the two largest capital cities. Even in Sydney and Melbourne
value growth has been substantially lower over the past decade
than over the previous decade.
CoreLogic RP Data Property Pulse
Monday 15th February, 2016
Rolling annual change in combined
capital city home values
-10.0%
-5.0%
0.0%
5.0%
10.0%
15.0%
20.0%
25.0%
Jan-98 Jan-00 Jan-02 Jan-04 Jan-06 Jan-08 Jan-10 Jan-12 Jan-14 Jan-16
78.0%
100.9%
44.0% 41.7% 44.7%
17.1%
75.3%
48.1%
72.0%
0.0%
20.0%
40.0%
60.0%
80.0%
100.0%
120.0%
Sydney Melbourne Brisbane Adelaide Perth Hobart Darwin Canberra Combined
capitals
Cumulative change in capital city home
values, 10 years to Jan-16
138.0%
167.7%
150.3% 152.4%
175.5%
161.7%
148.7% 151.7%
0.0%
50.0%
100.0%
150.0%
200.0%
Sydney Melbourne Brisbane Adelaide Perth Hobart* Darwin Canberra Combined
capitals
Cumulative change in capital city home
values, 10 years to Jan-06
41.7%
23.7%
5.5%
2.0% 4.1%
-3.8% -1.9%
8.9%
23.2%
-10.0%
0.0%
10.0%
20.0%
30.0%
40.0%
50.0%
Sydney Melbourne Brisbane Adelaide Perth Hobart Darwin Canberra Combined
capitals
Cumulative change in capital city home
values, 5 years to Jan-16
Source: CoreLogic RP Data Home Value Index
Source: CoreLogic RP Data Home Value Index
Source: CoreLogic RP Data Home Value Index
Source: CoreLogic RP Data Home Value Index
* Hobart value change shown is for houses only