More Related Content
Similar to Stock Portfolio Analysis
Similar to Stock Portfolio Analysis (20)
Stock Portfolio Analysis
- 1. STOCK PORTFOLIO ANALYSIS
Transaction Source & Uses
Source(Initial Capital - Jun 1, 2016) Interest Rate Uses Amount % Interest Rate
Margin Loan $50,000 50.0% 7.00% Stocks $79,296 79.30%
Equity $50,000 50.0% Cash $20,704 20.70% 1.50%
Total $100,000 100.0% Total $100,000 100.0%
Summary
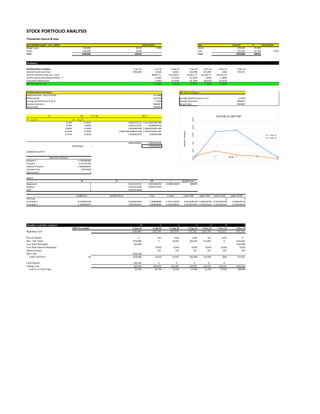
Portfolio Return Analysis 2-Jun-16 1-Jul-16 4-Aug-16 1-Sep-16 3-Oct-16 1-Nov-16 2-Dec-16
Summer Equity Cash Flow $(50,000) $(234) $4,812 $(6,499) $13,640 $(81) $70,101
Summer Portfolio Value (incl. Cash) 98,803.71 114,140.63 132,852.77 142,540.73 140,562.39
Portflio Appreciation/(Depreciation) - P -1.196% 15.523% 16.394% 7.292% -1.388%
Cumulative Appreciation -1.196% 14.326% 30.720% 38.013% 36.625%
S&P 500 (Market -M) -0.110% 2.915% 0.305% -0.445% -2.289%
Portfolio Returns/Analysis S&P Return/Analysis
HPR(Unlevered) - Risky Portfolio 52.458%
HPR(Levered) 63.475% Average Monthly Returns (n-1) 0.075%
Average Monthly Returns (N-1) 7.325% Standard Deviation #NAME?
Standard Deviation #NAME? Sharpe Ratio #NAME?
Sharpe Ratio #NAME?
P M P x M M^2
(Y - Avg Y) (X - Avg X)
-8.52% -0.185% 0.0001576112 3.4211481049E-006
8.20% 2.840% 0.0023279115 0.0008063978
9.069% 0.230% 0.0002087498 5.2982504187E-006
-0.033% -0.520% 1.69937302466851E-006 2.7063221001E-005
-8.713% -2.365% 0.0020603295 0.000559184
0.0047563014 0.0014013644
Beta(Slope) = 3.3940502877
SUMMARY OUTPUT
Regression Statistics
Multiple R 0.7360446882
R Square 0.541761783
Adjusted R Square -1.6666666667
Standard Error 0.0674644
Observations 1
ANOVA
df SS MS F Significance F
Regression 5 0.0161431261 0.0032286252 3.5468131835 #NUM!
Residual 3 0.0136543358 0.0045514453
Total 8 0.0297974619
Coefficients Standard Error t Stat P-value Lower 95% Upper 95% Lower 95.0% Upper 95.0%
Intercept 0 0
X Variable 4 0.0706955794 0.0302014504 2.340800806 0.1011479959 -0.0254189148 0.1668100736 -0.0254189148 0.1668100736
X Variable 5 3.3940502877 1.8021839421 1.883298485 0.1561849653 -2.3413033401 9.1294039156 -2.3413033401 9.1294039156
Monthly Cash Flow Analysis 0 1 2 3 4 5 6
IRR Per month 2-Jun-16 1-Jul-16 4-Aug-16 1-Sep-16 3-Oct-16 1-Nov-16 2-Dec-16
Beginning Cash $50,000 $20,704 $20,470 $25,282 $18,783 $32,422 $32,341
Plus Dividends $- $32 $138 $186 $16 $170 $-
Buy / Sell Stock $(79,296) $- $4,940 $(6,425) $13,892 $- $120,352
Less Debt (Principal) $50,000 $(50,000)
Less Debt (Interest Payments) $(292) $(292) $(292) $(292) $(292) $(292)
Interest Income $26 $26 $32 $23 $41 $40
Plus Cash $(20,704)
Total Cash Flow 9% $(50,000) $(234) $4,812 $(6,499) $13,640 $(81) $70,101
Cash Deposit $20,704 $- $- $- $- $-
Ending Cash $20,704 $20,470 $25,282 $18,783 $32,422 $32,341 $102,442
Cash % of Total Value 20.70% 20.72% 22.15% 14.14% 22.75% 23.01% 100.00%
Portfolio Vs S&P 500
Row 16
Row 18
Month
Monthlychange%
- 2. Stock Price 0 1 2 3 4 5 6
Companis Industry 2-Jun-16 1-Jul-16 4-Aug-16 1-Sep-16 3-Oct-16 1-Nov-16 2-Dec-16
1 APPL Electronic Equipment 97.72 95.89 105.87 106.73 112.52 111.49 109.90
2 BAC Money Center Banks 14.94 13.10 14.48 15.98 15.63 16.61 21.23
3 NKE Textile - Apparel Footwear & Accessories 54.53 55.61 54.79 58.54 52.67 49.62 50.46
4 F Auto Manufacturers - Major 13.21 12.72 12.08 12.44 12.10 11.61 12.24
5 REN Independent Oil & Gas 3.05 3.09 6.64 17.70 25.68 25.39 33.90
6 S Wireless Communications 3.77 4.53 6.22 6.20 6.57 6.17 7.97
7 JPM Money Center Banks 65.81 61.26 64.56 67.21 66.51 68.97 81.60
8 BABA Specialty Retail, Other 77.30 79.65 84.75 97.42 105.38 101.15 90.48
9 CATY Money Center Banks 31.12 27.49 29.76 31.25 30.39 29.54 35.46
10 GS Investment Brokerage - National 159.28 148.25 158.05 168.51 161.07 178.06 223.36
11 TWTR Internet Information Providers 15.20 17.28 18.13 19.5 24 17.49 17.93
12 MET Life Insurance 45.71 39.49 39.54 43.06 44.37 46.79 55.66
13 FB Internet Information Providers 118.93 114.19 124.36 126.17 128.77 129.50 115.40
14 FE Electric Utilities 33.31 35.13 32.93 32.45 32.30 33.47 30.57
15 CVS Life Insurance 96.40 95.00 96.97 93.37 87.09 83.45 77.62
S&P Index 2,105.26 2,102.95 2,164.25 2,170.86 2,161.20 2,111.72 2,191.95
Number of Shares Own 0 1 2 3 4 5 6
Companis Industry 2-Jun-16 1-Jul-16 4-Aug-16 1-Sep-16 3-Oct-16 1-Nov-16 2-Dec-16
1 APPL Electronic Equipment 100 100 100 50 50 50 0
2 BAC Money Center Banks 450 450 300 300 300 300 0
3 NKE Textile - Apparel Footwear & Accessories 200 200 200 200 100 100 0
4 F Auto Manufacturers - Major 600 600 600 600 600 600 0
5 REN Independent Oil & Gas 2600 2600 1300 1300 800 800 0
6 S Wireless Communications 2000 2000 1000 1000 1000 1000 0
7 JPM Money Center Banks 100 100 100 60 60 60 0
8 BABA Specialty Retail, Other 100 100 100 100 140 140 0
9 CATY Money Center Banks 200 200 200 200 200 200 0
10 GS Investment Brokerage - National 50 50 50 50 50 50 0
11 TWTR Internet Information Providers 0 160 160 160 160 0
12 MET Life Insurance 0 75 75 75 75 0
13 FB Internet Information Providers 0 50 50 50 50 0
14 FE Electric Utilities 0 0 100 100 100 0
15 CVS Life Insurance 0 0 120 120 120 0
Bought/Sold - Shares 0 1 2 3 4 5 6
Companis Industry 2-Jun-16 1-Jul-16 4-Aug-16 1-Sep-16 3-Oct-16 1-Nov-16 2-Dec-16
1 APPL Electronic Equipment 0 -50 0 0 -50
2 BAC Money Center Banks -150 0 0 0 -300
3 NKE Textile - Apparel Footwear & Accessories 0 0 -100 0 -100
4 F Auto Manufacturers - Major 0 0 0 0 -600
5 REN Independent Oil & Gas -1300 0 -500 0 -800
6 S Wireless Communications -1000 0 0 0 -1000
7 JPM Money Center Banks 0 -40 0 0 -60
8 BABA Specialty Retail, Other 0 0 40 0 -140
9 CATY Money Center Banks 0 0 0 0 -200
10 GS Investment Brokerage - National 0 0 0 0 -50
11 TWTR Internet Information Providers 160 0 0 0 -160
12 MET Life Insurance 75 0 0 0 -75
13 FB Internet Information Providers 50 0 0 0 -50
14 FE Electric Utilities 0 100 0 0 -100
15 CVS Life Insurance 0 120 0 0 -120
Bought/Sold - Shares 0 1 2 3 4 5 6
Companis Industry 2-Jun-16 1-Jul-16 4-Aug-16 1-Sep-16 3-Oct-16 1-Nov-16 2-Dec-16
1 APPL Electronic Equipment $- $- $- $5,336.50 $- $- $5,495.00
2 BAC Money Center Banks $- $- $2,172.00 $- $- $- $6,369.00
3 NKE Textile - Apparel Footwear & Accessories $- $- $- $- $5,267.00 $- $5,046.00
4 F Auto Manufacturers - Major $- $- $- $- $- $- $7,344.00
5 REN Independent Oil & Gas $- $- $8,632.00 $- $12,840.00 $- $27,120.00
6 S Wireless Communications $- $- $6,220.00 $- $- $- $7,970.00
7 JPM Money Center Banks $- $- $- $2,688.40 $- $- $4,896.00
8 BABA Specialty Retail, Other $- $- $- $- $(4,215.20) $- $12,667.20
9 CATY Money Center Banks $- $- $- $- $- $- $7,092.00
10 GS Investment Brokerage - National $- $- $- $- $- $- $11,168.00
11 TWTR Internet Information Providers $- $- $(2,900.80) $- $- $- $2,868.80
12 MET Life Insurance $- $- $(2,965.50) $- $- $- $4,174.50
13 FB Internet Information Providers $- $- $(6,218.00) $- $- $- $5,770.00
14 FE Electric Utilities $- $- $- $(3,245.00) $- $- $3,057.00
15 CVS Life Insurance $- $- $- $(11,204.40) $- $- $9,314.40
Total $- $- $4,939.70 $(6,424.50) $13,891.80 $- $120,351.90
Total Value 0 1 2 3 4 5 6
Companis Industry 2-Jun-16 1-Jul-16 4-Aug-16 1-Sep-16 3-Oct-16 1-Nov-16 2-Dec-16
1 APPL Electronic Equipment $9,772 $9,589 $10,587 $5,337 $5,626 $5,575 $-
2 BAC Money Center Banks $6,723 $5,895 $4,344 $4,794 $4,689 $4,983 $-
3 NKE Textile - Apparel Footwear & Accessories $10,906 $11,122 $10,958 $11,708 $5,267 $4,962 $-
4 F Auto Manufacturers - Major $7,926 $7,632 $7,248 $7,464 $7,260 $6,966 $-
5 REN Independent Oil & Gas $7,930 $8,034 $8,632 $23,010 $20,544 $20,312 $-
6 S Wireless Communications $7,540 $9,060 $6,220 $6,200 $6,570 $6,170 $-
7 JPM Money Center Banks $6,581 $6,126 $6,456 $4,033 $3,991 $4,138 $-
8 BABA Specialty Retail, Other $7,730 $7,965 $8,475 $9,742 $14,753 $14,161 $-
9 CATY Money Center Banks $6,224 $5,498 $5,952 $6,250 $6,078 $5,908 $-
10 GS Investment Brokerage - National $7,964 $7,413 $7,903 $8,426 $8,054 $8,903 $-
11 TWTR Internet Information Providers $- $- $2,901 $3,120 $3,840 $2,798 $-
12 MET Life Insurance $- $- $2,966 $3,230 $3,328 $3,509 $-
13 FB Internet Information Providers $- $- $6,218 $6,309 $6,439 $6,475 $-
14 FE Electric Utilities $- $- $- $3,245 $3,230 $3,347 $-
15 CVS Life Insurance $- $- $- $11,204 $10,451 $10,014 $-
Total Vaule $79,296 $78,333.50 $88,858.80 $114,070.00 $110,118.35 $108,221.35 $-
Cash $20,704 20,470.21 25,281.83 18,782.77 32,422.38 32,341.04 $102,441.70
Total Vaule $100,000 98,803.71 114,140.63 132,852.77 142,540.73 140,562.39 $102,441.70
- 3. Dividends Paid Per Share 0 1 2 3 4 5 6
Companis Industry 2-Jun-16 1-Jul-16 4-Aug-16 1-Sep-16 3-Oct-16 1-Nov-16 2-Dec-16
1 APPL Electronic Equipment $0.570 $0.570
2 BAC Money Center Banks $0.075 $0.075
3 NKE Textile - Apparel Footwear & Accessories $0.160 $0.160
4 F Auto Manufacturers - Major $0.150 $0.150
5 REN Independent Oil & Gas
6 S Wireless Communications
7 JPM Money Center Banks $0.480 $0.480
8 BABA Specialty Retail, Other
9 CATY Money Center Banks $0.180 $0.210
10 GS Investment Brokerage - National $0.650 $0.650
11 TWTR Internet Information Providers
12 MET Life Insurance $0.400 $0.400
13 FB Internet Information Providers
14 FE Electric Utilities $0.360 $0.360
15 CVS Life Insurance $0.425 $0.425
Total Cash Dividend 0 1 2 3 4 5 6
Companis Industry 2-Jun-16 1-Jul-16 4-Aug-16 1-Sep-16 3-Oct-16 1-Nov-16 2-Dec-16
1 APPL Electronic Equipment $- $- $28.50 $- $- $-
2 BAC Money Center Banks $- $- $22.50 $- $- $-
3 NKE Textile - Apparel Footwear & Accessories $32.00 $- $- $16.00 $- $-
4 F Auto Manufacturers - Major $- $90.00 $- $- $90.00 $-
5 REN Independent Oil & Gas $- $- $- $- $- $-
6 S Wireless Communications $- $- $- $- $- $-
7 JPM Money Center Banks $- $48.00 $- $- $28.80 $-
8 BABA Specialty Retail, Other $- $- $- $- $- $-
9 CATY Money Center Banks $- $- $36.00 $- $- $-
10 GS Investment Brokerage - National $- $- $32.50 $- $- $-
11 TWTR Internet Information Providers $- $- $- $- $- $-
12 MET Life Insurance $- $- $30.00 $- $- $-
13 FB Internet Information Providers $- $- $- $- $- $-
14 FE Electric Utilities $- $- $36.00 $- $- $-
15 CVS Life Insurance $- $- $- $- $51.00 $-
Total $32.00 $138.00 $185.50 $16.00 $169.80 $-
Diversification Factors
2-Jun-16 1-Jul-16 4-Aug-16 1-Sep-16 3-Oct-16 1-Nov-16
Industry Concentration
Electronic Equipment 12% 12% 12% 5% 5% 5%
Money Center Banks 25% 22% 19% 13% 13% 14%
Textile - Apparel Footwear & Accessories 14% 14% 12% 10% 5% 5%
Auto Manufacturers - Major 10% 10% 8% 7% 7% 6%
Independent Oil & Gas 10% 10% 10% 20% 19% 19%
Wireless Communications 10% 12% 7% 5% 6% 6%
Specialty Retail, Other 10% 10% 10% 9% 13% 13%
Investment Brokerage - National 10% 9% 9% 7% 7% 8%
Internet Information Providers 0% 0% 10% 8% 9% 9%
Life Insurance 0% 0% 3% 13% 13% 12%
Electric Utilities 0% 0% 0% 3% 3% 3%
Total 100% 100% 100% 100% 100% 100%
Total
$79,296 $78,334 $88,859 $114,070 $110,118 $108,221
Company Concentration 2-Jun-16 1-Jul-16 4-Aug-16 1-Sep-16 3-Oct-16 1-Nov-16
APPL 12% 12% 12% 5% 5% 5%
BAC 8% 8% 5% 4% 4% 5%
NKE 14% 14% 12% 10% 5% 5%
F 10% 10% 8% 7% 7% 6%
REN 10% 10% 10% 20% 19% 19%
S 10% 12% 7% 5% 6% 6%
JPM 8% 8% 7% 4% 4% 4%
BABA 10% 10% 10% 9% 13% 13%
CATY 8% 7% 7% 5% 6% 5%
GS 10% 9% 9% 7% 7% 8%
TWTR 0% 0% 3% 3% 3% 3%
MET 0% 0% 3% 3% 3% 3%
FB 0% 0% 7% 6% 6% 6%
FE 0% 0% 0% 3% 3% 3%
CVS 0% 0% 0% 10% 9% 9%
100% 100% 100% 100% 100% 100%