This extended essay examines whether a deficiency in the AWB olfactory neuron affects the ability of C. elegans worms to differentiate between pathogenic and non-pathogenic bacteria. The author conducted a chemotaxis assay comparing the behavior of wild-type N2 worms and AWB-deficient PY2223 worms when exposed to the non-pathogenic bacteria E. coli OP50 and the pathogenic bacteria S. marcescens. Results showed N2 worms were able to differentiate between the bacteria, while PY2223 worms were not. This suggests the AWB neuron is important for C. elegans to distinguish between harmful and harmless bacteria.
1. Candidate ID 002904-0127
1
Olfactory Aspects of Pathogenic Response in C.elegans: Comparison of Chemotactic
Responses in Wild-type and AWB Olfactory Mutant Worms
Connor J. O’Leary
IB Candidate Number: 002904-0127
May, 2015 Exam Session
Diploma Programme, Group 4
IB Extended Essay
Supervisor: Dr. Julie Nowicki
Word Count: 3690
2. Candidate ID 002904-0127
2
Table Of Contents
Title Page Pg. 1
Table of Contents Pg. 2
Abstract Pg.3
Introduction Pg. 4-7
Materials Pg. 8
Methods Pg. 8-13
Results Pg. 14-18
Conclusion Pg. 19-22
Literature Citied Pg. 23
Appendix Pg. 24-33
3. Candidate ID 002904-0127
3
Abstract
The purpose of this study was to determine if the AWB olfactory system plays a role in a
Caenorhabditis elegans (C. elegans) worm’s ability to differentiate between pathogenic and non-
pathogenic bacteria. The bacterium E. Coli OP50 is a non-pathogenic food source, found in the
soil and used as laboratory food for C. elegans. The bacterium S. marcescens, also found in the
soil, is pathogenic to C. elegans after consumption. In order to study this, two worm strains were
used. N2 wild type worms were used as a control compared to PY2223 AWB deficient worms.
The PY2223 have reduced expression of the str-1 promoter gene. Previous research linked the
AWB chemosensory neuron with the ability to detect chemo-repellants. “It was predicted that
a deficiency in the AWB olfactory neuron would decrease a C. elegans worm’s ability to
differentiate between pathogenic and non-pathogenic bacteria.” A chemotaxis assay was
preformed in order to observe differences in the N2 and PY2223 worms’ ability to differentiate
between pathogenic and non-pathogenic bacteria then statistical analysis was completed. The
results observed suggested that C. elegans N2 worms were able to differentiate between food
sources while PY2223 worms were not. There was a statistically significant difference in the N2
worm’s ability to differentiate between food sources compared to the PY2223 worm’s ability.
This difference suggests that a decreased expression of the AWB olfactory neuron impairs a
C.elegans worm’s ability to differentiate between pathogenic and non-pathogenic food sources.
Abstract Word Count: 239 words
4. Candidate ID 002904-0127
4
Introduction
Research Question: Does a mutated AWB olfactory system have an effect on a
Caenorhabditis elegans (C.elegans) worm’s ability to differentiate between pathogenic
and non-pathogenic bacteria?
Hypothesis: I predict that a deficiency in the AWB olfactory neuron will decrease a
C.elegans worm’s ability to differentiate between pathogenic and non-pathogenic
bacteria.
The purpose of this study was to determine if the AWB olfactory system plays a role in a
Caenorhabditis elegans (C. elegans) worm’s ability to differentiate between pathogenic and
non-pathogenic bacteria.
C. elegans is a free-living, transparent nematode, about 1 mm in length, that lives in
temperate soil environments (Brenner). The entire genome of C.elegans is mapped out, making
them a go-to model organism in laboratory studies. The small size and quick reproduction rate of
C.elegans make them a favorable organism for scientific studies. Although only about 1mm in
length, C.elegans share many of the same features of complex animals. One similarity between
C.elegans and other animals is that C.elegans have a primitive olfactory (sense of smell) system
that attributes to many of their behaviors. “C. elegans has a highly developed chemosensory
system that enables it to detect a wide variety of volatile (olfactory) and water-soluble
(gustatory) cues associated with food, danger, or other animals” (Bargmann, 2006, p.1).
C.elegans are naturally found in soil and usually feed on the bacteria found there. The
bacterium Escherichia coli OP50 (E. Coli OP50) is a non-pathogenic food source, found in the
soil and used as laboratory food for C. elegans. The bacterium Serratia marcescens
5. Candidate ID 002904-0127
5
(S.marcescens), also found in the soil, is pathogenic to C. elegans after consumption. But how do
C.elegans find these bacteria? “C. elegans chemotaxes to bacteria, its natural food source, by
following both water-soluble and volatile cues (Grewal and Wright, 1992). The olfactory
receptors in C.elegans are directly related to their locomotion systems. When the C.elegans sense
a chemo-attractant, the olfactory system signals for a positive locomotion response. C.elegans
can not only detect positive stimuli, chemo-attractants but also negative stimuli, chemo-
repellants. The AWA and AWC sensory neurons are primarily used to detect positive chemo-
attractants and the AWB sensory neurons are used to detect chemo-repellants and elicit a
negative response (Bargmann, 2006, p.6). More specifically, the ability to detect volatile
substances is broken down to a few specific, highly volatile substances. One of the most
important substances is diacetyl. In wild type worms, “the G protein-coupled receptor for the
attractive odor diacetyl, ODR-10, is normally expressed exclusively in AWA neurons” (Troemel
et al., 1997). When the AWB neuron misexpresses this ODR-10 receptor, diacetyl becomes a
chemo-repellent to animals therefore confusing the animal. The PY2223 worms chosen for this
experiment have a reduced display in the str-1 promoter in the AWB neuron. Because of this
reduced expression, the AWB does not properly regulate the ODR-10 receptor. (Troemel et al.,
1997). Therefore, the AWB olfactory system in the PY2223 worms does not propery function.
With this information, I developed an experiment in order to oberve if this AWB deficentcy
effects a worm’s ability to differntiate between baceterial food sources.
A diagram of the C.elegans chemosensory system can be seen below in “Figure A”
(Bargmann, 2006, p.2). The ability to detect both chemo-attractants and chemo-repellants in
order to find food can be paralleled to the chemosensory system in mammals, “suggesting that
6. Candidate ID 002904-0127
6
hard-wired sensory maps define intrinsic chemosensory preferences in many animals” (Mueller
et al., 2005).
[www.wormbook.org (Bargmann, 2006, p.2)]
The close relation between the chemosensory system of C.elegans and their locomotion
is a very interesting adaption key to their survival. The above studies show that C.elegans can
differentiate between chemo-attractants and chemo-repellants in order to find food. But what
classifies a food source as a chemo-attractant or chemo-repellant? Worms are certainly attracted
to bacteria, their main food source, but can they differentiate between bacteria that nourish them
and bacteria that kill the? In their natural environment, C.elegans are exposed to both beneficial
bacteria such as E.coli OP50 (non-pathogenic) and harmful bacteria such as S.marcescens
(pathogenic). A study was done in in order to determine whether C.elegans could differentiate
Figure 1- Chemosensory System of C.elegans
7. Candidate ID 002904-0127
7
between different bacterial species (Pradel et al., 2007). The study showed that there were certain
substances present in many pathogenic bacteria that were not present in non-pathogenic bacteria,
however most substances present in non-pathogenic bacteria were present in pathogenic bacteria
(Pradel et al., 2007). This statement highlights the important of the AWB sensory neurons
because although the AWA and AWC sensory neurons may be able to detect bacteria as a food
source, they cannot aid in the detection of the chemo-repellants present in pathogenic bacteria.
The question addressed in this study is, does a mutated AWB olfactory neuron have
an effect on a C. elegans worm’s ability to differentiate between pathogenic and non-
pathogenic bacteria? In order to address this question, a chemotaxis assay was performed in
order to see if the AWB olfactory neuron played a role in the differentiation between pathogenic
and non-pathogenic bacteria. An additional goal of this assay was to provide further evidence
that the olfactory chemosensory system of C.elegens is directly connected to the locomotion of
the organism. In this test, N2, wild type worms were used because they have a standard
chemosensory system. The N2 worms were compared to PY2223 worms which are AWB
olfactory deficient. These worms have mutations (mef-2(oy65) I; kin-29(oy39) kyIs104 X)
which display a reduced expression of the str-1 chemoreceptor in the AWB olfactory neurons
(Pradel et al., 2007). The N2 and PY2223 worms were tested for their chemotaxis towards non-
pathogenic E.coli OP50 and pathogenic S.marcescens. Because of the available research cited
above, the hypothesis deduced was, “I predict that a deficiency in the AWB olfactory neuron
will decrease a C.elegeans worm’s ability to differentiate between pathogenic and non-
pathogenic bacteria.”
8. Candidate ID 002904-0127
8
Materials
The materials used in this experiment were: pre-prepared Nematode Growth Medium
(NGM) agar, sterile petri dishes, microwave, Parafilm, refrigerator, C.elegans strains (N2 and
PY2223), Escherichia coli OP50, Serratia marcescens, pre-prepared Luria broth, inoculating
loop, incubator, P1000 micropipette with tips, P200 micropipette with tips, P20 micropipette
with tips, L-spreader, flame stick, scalpel, stereotypical microscope, 70% ethanol, forceps, sterile
filter paper disks, lab marker, S-buffer, microcentrifuge tubes, disposable pipette, scissors, Kim
wipes, worm pick (platinum wire, disposable pipette, modeling clay), pliers, Biohazard bin,
computer, calculator, Microsoft Excel, and Microsoft Word. Safety equipment included goggles
and gloves.
Methods
Worm samples were provided by the Caenorhabditis Genetics Center (CGC), which is
funded by the National Institute of Health (NIH) Office of Research Infrastructure Programs
(P40 OD010440). Two worm strains were purchased: wild-type N2 worms and AWB olfactory
deficient PY2223 worms.
Some preliminary testing was done in order to better the experimental procedure. First a
test was done to see if N2 and PY2223 worms were attracted to both E.coli OP50 and
S.marcescens. The results of this test showed that the worms were attracted to both bacteria.
Another preliminary test was done to see the best possible way to introduce the bacteria in the
chemotaxis assay. Pipetting the bacteria directly onto the lawn was compared with using soaked
filter paper disks. The filter paper disks proved to yield more consistent results with less
contamination.
9. Candidate ID 002904-0127
9
Prior to experimentation, premade Nematode Growth Medium (NGM) agar plates had to
be melted. Bottles were cooled to the touch and poured into sterilized petri dishes, then
solidified, before being sealed with Parafilm and stored at 4°C. Originally, 70 NGM agar plates
were poured however more were needed to be prepared throughout the experiment.
In order to prepare stock plates, NGM plates needed to be seeded with E.coli OP50. 5 mL
of pre-prepared Luria broth was inoculated with E.coli OP50. An inoculating loop was scraped
against a bacteria colony of E.coli OP50 on a stock plate then swirled in the Luria broth in order
to dislodge cells. The bacterial culture was incubated at 20°C for 48 hours before seeding. After
the incubation period, 4 NGM plates were seeded with 50 µL each of the E.coli OP50 bacterial
broth using a P200 pipet with sterile tips. Originally 100 µL was used but that appeared to be too
much; all subsequent plates used 50 µL. The broth solution was spread using a sterile L-spreader
and the seeded NGM plates were incubated at 20°C for 24 hours. After the 24 hours incubation
period, two stock plates for each worm strain (N2 and PY2223) were prepared by using the
chunking technique. Following the chunking technique, a sterilized scalpel was used to make a
square incision into the stock plates of each worm strain. This square chunk was then moved on
to the newly seeded NGM plates. Following chunking of all worm strains, the transfer was
verified using a stereomicroscope. Stock plates were labeled with their worm strain and date
prepared. N2 and PY2223 plates were stored at room temperature until use. New stock plates
were prepared every one to two weeks in order to ensure worm strains were kept alive. In
addition, 10 stock plates each of N2 and PY2223 worms were created 1 week before the
chemotaxis assay. (Stock plate preparation procedure adapted from Carolina Biology Company.)
For the chemotactic assay, sterile filter paper disks were soaked in bacterial broth. 15
filter paper disks were added to 5µL of each E.coli OP50 broth and S.marcescens broth using
10. Candidate ID 002904-0127
10
ethanol-sterilized forceps. 20 filter paper disks were added to 5µL plain, un-inoculated Luria
broth using ethanol-sterilized forceps. All cultures were set over night before the chemotaxis
assay. Un-inoculated NGM plates were prepared by drawing a line down the middle. Ten plates
each were labeled “E vs. L” for E.coli OP50 vs. LB broth, “S vs. L” for S.marcescens vs. LB
Broth, and “E vs. S” for E.coli OP50 vs. S.marcescens. Each plate was also labeled with a
number 1-10 for each trial and “N2” signifying the worm strain. These plates were also stored at
room temperature until the assay.
On the day of the chemotaxis assay, filter paper disks were transferred from the cultures
onto the NGM plates using ethanol-sterilized forceps. For the “E vs. L” plates, one E.coli OP50
disk was placed on the “E” side and one Luria broth disk was placed on the “L” side. For the “S
vs. L” plates, one S.marcescens disk was placed on the “S” side and one Luria broth disk was
placed on the “L” side. For the “E vs. S” plates, one E.coli OP50 disk was placed on the “E” side
and one S.marcescens disk was placed on the “S” side. This was repeated for all 10 replicates.
All plates were left to sit for 30 minutes. Meanwhile, worms were collected for stock plates using
the “S-buffer” technique (procedure found at www.wormbook.com/strainmaintain). 1mL of S-
buffer was added to each of the 10 stock plates using a P-1000 micropipette. Plates were tilted at
a 45° angle in order to ensure the S-buffer properly coated the entire plate. The plates sat for
approximately one minute before a P-1000 pipet was used to remove the S-buffer off the plate
and transfer it into a microcentrifuge tube labeled “N2”. The S-buffer sat in the centrifuge tubes
for 5 minutes then a disposable pipette was used to remove the supernatant and add fresh S-
buffer. This wash process was repeated one more time. During preliminary testing 3 washes were
used however it appeared that worms were lost in the process so only 2 washes were used. After
the 30-minute incubation period of the disks on the NGM plates, the disks were removed with
11. Candidate ID 002904-0127
11
ethanol-sterilized forceps. A p-20 micropipette was used to transfer 5µL of the S-buffer, N2
worm containing solution onto the center of each NGM plate (on the line). Then a Kimwipe was
used to soak up excess S-buffer. The tip of the P-20 pipette had to be trimmed off using flame-
sterilized scissors to ensure that worms didn’t get caught in the narrow part of the tip. After the
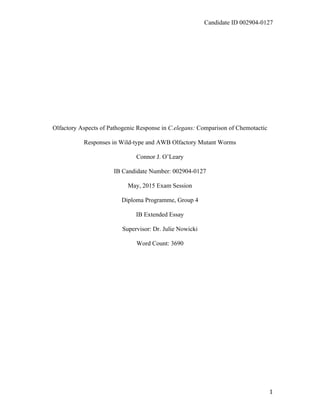
worms were transferred, the plates were left to sit for 30 minutes.
Figure 2- Diagram of C. elegans Chemotaxis Assay
Following the 30-minute wait period, chemotaxis plates were observed and results were
recorded. Each plate was observed under a stereomicroscope. The number of worms on each side
was counted and recorded in a lab notebook. This data can be seen in tables A.1.1-A.1.3 in the
Appendix. Worms in the center of the plate were not counted as many were likely dead or
injured. Regardless, these worms did not definitely move to one side of the plate and therefore
were not accounted for. The entire chemotaxis procedure was repeated for the PY2223, AWB
olfactory deficient, worms. One slight alteration was that 7µL of S-buffer worms were used
instead of 5µL due to the limited number of PY2223 worms. Raw data for the PY2223 worms
can be found in the Appendix in tables A.2.1-A.2.3. Following the collection of raw data, a
chemotaxis index was calculated for all replicates using the formula:
C.
elegans
worm
Side
2
Side
1
Substance
2
Substance
1
Line
of
starting
point
for
all
worms
12. Candidate ID 002904-0127
12
Chemotaxis Index(Side 1) =
(# 𝐶. 𝑒𝑙𝑒𝑔𝑎𝑛𝑠 𝑜𝑛 𝑆𝑖𝑑𝑒 1 − # 𝐶. 𝑒𝑙𝑒𝑔𝑎𝑛𝑠 𝑜𝑛 𝑆𝑖𝑑𝑒 2)
(# 𝐶. 𝑒𝑙𝑒𝑔𝑎𝑛𝑠 𝑜𝑛 𝑆𝑖𝑑𝑒 1 + # 𝐶. 𝑒𝑙𝑒𝑔𝑎𝑛𝑠 𝑜𝑛 𝑆𝑖𝑑𝑒 2)
The processed data for the chemotactic study can be seen in the Appendix in Tables B.1.1-B.1.3.
The mean values along with standard deviation can be seen in figures 3.1, 4.1, and 5.2 in the
results section of this paper. Additionally, qualitative data can be seen in the Results section. A
sample calculation for chemotaxis index can be seen in the Appendix. (Chemotaxis assay
procedure adopted from Bio-Rad Chemotaxis Manual.)
The independent variable was the worm strain used: PY2223 or N2. The dependent
variable was the worms’ movement towards a substance: E.coli OP50, S.marcescens, or Luria
broth. This movement was quantified using a chemotaxis index, which was measured by
counting the number of worms on each side of the plate and processing the data using the above
Chemotaxis index formula. A positive control of wild type N2 worms was used because N2
worms are known to de able to detect and move towards E.coli OP50 because this is their typical
laboratory food. There were many constants in this experiment, including: the temperature
conducted at, the amount of bacteria on plate (measured by 1 disk), the amount of worm solution
placed on each plate, the time allotted for worms to migrate towards chemo-attractant, and the
distance from the starting point of the worms and the chemo-attractant source. Following the
collection of raw data and the processing of the chemotaxis index, various methods of statistical
analysis were implemented. The average chemotaxis index was found for each test along with
the standard deviation. Additionally, several t-tests were preformed to determine statistical
significance. In order to determine whether the worms were attracted to E.coli OP50 and not the
Luria broth, a t-test was done between the chemotaxis index of the E.coli OP50 side and the
Luria broth side on the “E.coli OP50 vs. Luria broth” plates. This test was done separately for
both worm strains. A t-test was also done between the chemotaxis index of S.marcescens and
13. Candidate ID 002904-0127
13
Luria broth on the “S.marcescens vs. Luria broth” plates for each worm strain separately. On the
“E.coli OP50 vs. S.marcescens” plates, a t-test was done between the chemotaxis indices of each
side in order to determine if the worms traveled significantly more to one side or the other. This
test was done for each worm strain separately. A t-test was done between the N2 chemotaxis
index of E.coli OP50 on the “E.coli OP50 vs. Luria broth” plate and the PY2223 chemotaxis
index of E.coli OP50 on the “E.coli OP50 vs. Luria broth” plate in order to determine whether
there was a statistical difference between the wild-type and olfactory mutant chemotaxis towards
E.coli OP50. A t-test was done between the N2 chemotaxis index of S.marcescens on the
“S.marcescens vs. Luria broth” plate and the PY2223 chemotaxis index of S.marcescens on the
“S.marcescens vs. Luria broth” plate in order to determine whether there was a statistical
difference between the wild-type and olfactory mutant chemotaxis towards S.marcescens. Finally
a t-test was done between the chemotaxis indices of N2 worms and PY2223 worms on the
“E.coli OP50 vs. S.marcescens” plate in order to determine whether one worm strain could
differentiate between the two bacteria over the other worm strain. All t-tests were done using
Microsoft Excel.
*Note: Safety equipment was used throughout the experiment. Gloves were worn at all
times. Goggles were worm at all times except when observing worms under a stereotypical
microscope. All laboratory equipment was sterilized with either a flame stick or ethanol before
coming in contact with experimental subjects. Upon the completion of research, any item that
came into contact with living organism was bleached and disposed of in the trash. All necessary
procedures were implemented to ensure that the laboratory environment was not contaminated
by living agents.
14. Candidate ID 002904-0127
14
Results
The following section contains a summary of all of the data collected during the study.
Figures 3.1 and 4.1 serve as summaries for the chemotaxis indices of the N2 and PY2223 worms.
Both of these tables are accompanied by graphical representations of the data (Figures 3.2 and
4.2. Figure 5.1 shows a comparison between the chemotaxis of N2 and PY2223 worms. This
comparison was displayed visually in Figure 5.2. All means were calculated from the chemotaxis
indices of 10 replicates for each plate type. All raw data can be found in the Appendix section.
Figure 3.1- Mean Chemotactic Indices of N2 (Wild type) Worms
Plate E. Coli OP50 vs. Luria
Broth
S.marcescens vs. Luria
Broth
E.coli OP50 vs.
S.marcescens
Chemotaxis E.coli
OP50
LB Broth S.marcescens LB Broth E.coli
OP50
S.marcescens
Mean
± St. Dev.
0.61±0.07 -0.61±0.07 0.34±0.12 -0.34±0.12 0.63±0.06 -0.63±0.06
P-value 1.4 x 10⁻¹⁸
2.1 x 10⁻¹⁰
3.3 x 10⁻²⁰
Description of Figure: The above table shows the mean chemotaxis indices for N2 worms on three plate
types. A t-test was conducted between the two chemotaxis indices on each plate in order to determine the
level of significance. The null hypothesis states that the two values are not statistically different. A P-
value of less than 0.05 rejects the null hypothesis, and signifies that the two values are statistically
different. A P-value of greater than 0.05 accepts the null hypothesis, and signifies that the two values are
statistically the same.
15. Candidate ID 002904-0127
15
Description of Figure: The above figure graphically represents the data presented in Table 3.1 in order to
demonstrate the statistical significance. The bars in this graph represent the mean chemotaxis towards the
substance. For the E. Coli OP50 vs. Luria Broth plate, Side 1 is E. coli OP50 and Side 2 is Luria Broth.
For the S. marcescens vs. Luria Broth, Side 1 is S. marcescens and Side 2 is Luria Broth. For the E. Coli
OP50 vs. S. marcescens plate, Side 1 is E. coli OP50 and Side 2 is S. marcescens. Error bars represent ±
one standard deviation from the mean. An asterisk (*) shows a statistical significance as per t-test. This
significance indicates the worms were able to differentiate between the two compounds on the plate. As
per t-tests, N2 worms showed differentiation abilities on all three plates.
-‐0.3
-‐0.2
-‐0.1
0
0.1
0.2
0.3
0.4
0.5
0.6
0.7
0.8
E.
Coli
OP50
vs.
Luria
Broth
S.marcescens
vs.
Luria
Broth
E.coli
OP50
vs.
S.marcescens
Chemotaxis
Index
Plate
FIGURE
3.2-‐
Mean
Chemotaxis
Indices
of
N2
Worms
N2
PY2223
*
*
*
16. Candidate ID 002904-0127
16
Figure 4.1- Mean Chemotactic Indices of PY2223 (AWB Olfactory Mutant) Worms
Plate E. Coli OP50 vs. Luria
Broth
S.marcescens vs. Luria
Broth
E.coli OP50 vs.
S.marcescens
Chemotaxis E.coli
OP50
LB Broth S.marcescens LB Broth E.coli
OP50
S.marcescens
Mean
± St. Dev.
0.02±0.19 -0.02±0.19 -0.05±0.12 0.05±0.12 0.01±0.21 0.01±0.21
P-value 7.3 x 10⁻¹
9.7 x 10⁻²
7.7 x 10⁻¹
Description of Figure: The above table shows the mean chemotaxis indices for PY2223 worms on three
plate types. A t-test was conducted between the two chemotaxis indices on each plate in order to
determine the level of significance. The null hypothesis states that the two values are not statistically
different. A P-value of less than 0.05 rejects the null hypothesis, and signifies that the two values are
statistically different. A P-value of greater than 0.05 accepts the null hypothesis, and signifies that the two
values are statistically the same.
Description of Figure: The above figure graphically represents the data presented in Table 4.1 in order to
demonstrate the statistical significance. The bars in this graph represent the mean chemotaxis towards the
substance. For the E. Coli OP50 vs. Luria Broth plate, Side 1 is E. coli OP50 and Side 2 is Luria Broth.
For the S. marcescens vs. Luria Broth, Side 1 is S. marcescens and Side 2 is Luria Broth. For the E. Coli
OP50 vs. S. marcescens plate, Side 1 is E. coli OP50 and Side 2 is S. marcescens. Error bars represent ±
one standard deviation from the mean. An asterisk (*) shows a statistical significance as per t-test. This
significance indicates the worms were able to differentiate between the two compounds on the plate. As
per t-tests, PY2223 worms showed unable to differentiate between substances on all three plates. It is also
-‐0.3
-‐0.2
-‐0.1
0
0.1
0.2
0.3
0.4
0.5
0.6
0.7
0.8
E.
Coli
OP50
vs.
Luria
Broth
S.marcescens
vs.
Luria
Broth
E.coli
OP50
vs.
S.marcescens
Chemotaxis
Index
Plate
FIGURE
4.2-‐
Mean
Chemotaxis
Indices
of
PY2223
Worms
N2
PY2223
17. Candidate ID 002904-0127
17
important to note the high standard deviation in the PY2223 worms, showing that the data is more spread
and less precise as compared to the N2 worms (as seen in Figure 3.2).
Figure 5.1- Mean Chemotactic Indices of N2 (Wild type) and PY2223 (Olfactory Mutant)
Worms
Plate E. Coli OP50 vs. Luria
Broth
S.marcescens vs. Luria
Broth
E.coli OP50 vs.
S.marcescens
Chemotaxis N2 PY2223 N2 PY2223 N2 PY2223
Mean
± St. Dev.
0.61±0.07 0.02±0.19 0.34±0.12 -0.05±0.12 0.63±0.06 0.01±0.21
P-value 1.0 x 10⁻⁶
9.2 x 10⁻⁷
3.1 x 10⁻⁶
Description of Figure: The above table compares the mean chemotaxis indices of N2 worms to the
chemotaxis indices of PY2223 worms on three plate types. A t-test was conducted between the N2
worms’ chemotaxis index and the PY2223 worms’ chemotaxis index plate in order to determine the level
of significance. The null hypothesis states that the two values are not statistically different. A P-value of
less than 0.05 rejects the null hypothesis, and signifies that the two values are statistically different. A P-
value of greater than 0.05 accepts the null hypothesis, and signifies that the two values are statistically the
same.
18. Candidate ID 002904-0127
18
Description of Figure: The above figure graphically represents the data presented in Table 5.1 in order to
demonstrate the statistical significance. The bars in this graph represent the mean chemotaxis towards the
substance. Error bars represent ± one standard deviation from the mean. An asterisk (*) shows a statistical
significance as per t-test. This significance indicates a difference in the two worm type’s differentiation
abilities. As per t-tests, N2 and PY2223 worms showed a significant difference I differentiation abilities
between substances on all three plates. Because all three t-tests yielded statistical significance, the overall
differentiation ability of the N2 and PY2223 worms is also statistically significant. It is also important to
note the high standard deviation in the PY2223 worms, showing that the data is more spread and less
precise as compared to the N2 worms.
Figure 6.1- Qualitative Observations
On the “E.coli OP50 vs. Luria broth” and “S.marcescens vs. Luria broth” plates containing N2 worms,
larger worms were observed on the bacterial side while smaller worms were observed on the Luria broth
side.
On the “E.coli OP50 vs. S.marcescens” plates with N2 worms, many worms were see at the center of the
plate.
On all PY2223 worms, many worms were found at the center of the plate. This may account for the
decreased number of worms counted for the chemotaxis index.
-‐0.3
-‐0.2
-‐0.1
0
0.1
0.2
0.3
0.4
0.5
0.6
0.7
0.8
E.
Coli
OP50
vs.
Luria
Broth
S.marcescens
vs.
Luria
Broth
E.coli
OP50
vs.
S.marcescens
Chemotaxis
Index
Plate
FIGURE
5.2-‐
Mean
Chemotaxis
Indices
of
N2
and
PY2223
Worms
N2
PY2223
*
*
*
19. Candidate ID 002904-0127
19
Conclusion
The purpose of this study was to determine if the AWB olfactory system plays a role in a
Caenorhabditis elegans (C. elegans) worm’s ability to differentiate between pathogenic and non-
pathogenic bacteria. The results obtained partially supports the hypothesis, “I predict that a
deficiency in the AWB olfactory neuron will decrease a C.elegans worm’s ability to
differentiate between pathogenic and non-pathogenic bacteria.” The N2 wild type worms
were observed to be proficient in detecting and moving towards the E.coli OP50 (non-pathogenic
bacteria) as compared to the control of Luria Broth. The chemotaxis index of this movement
compared to the chemotaxis index of Luria Broth was statistically significant as per a t-test. This
means that the test supported the idea that worms can detect and move towards a bacterial food
source. A similar result was seen on the plate containing S.marcescens and Luria broth. There
was a statistically significant difference between the chemotaxis index towards S.marcescens and
the chemotaxis index of Luria broth. This supports the idea that N2, wild-type worms can detect
and move towards bacteria. When a t-test was used to compare the chemotaxis index of N2
worms to E.coli OP50 and S.marcescens there was a statistical difference between the indices.
This means that worms can differentiate between pathogenic and non-pathogenic bacterial and
prefer non-pathogenic E.coli OP50. It is important to note that the observations seen in the N2
worms do not yet show a connection between the AWB olfactory system and the ability to
differentiate between pathogenic and non-pathogenic bacteria. In order to make the connection
between this olfactory neuron and the ability to differentiate between pathogenic and non-
pathogenic bacteria, PY2223 worms were used. If the PY2223 worms could differentiate
between E.coli OP50, S. marcescens, and Luria broth, then it can be said that there is a
connection between the AWB olfactory neuron and the ability for a C.elegans worm to
20. Candidate ID 002904-0127
20
differentiate between food sources. All t-tests among PY2223 worms proved to be not
statistically significant. This means that the PY2223, AWB olfactory deficient worms cannot
differentiate between E.coli OP50, S.marcescens, and Luria broth. This supports the
hypothesized idea that there is a connection between the AWB olfactory neuron and a worm’s
ability to differentiate between pathogenic and non-pathogenic bacteria. According to the data,
worms with reduced AWB olfactory expression were unable to differentiate between the three
substances. However, according to the research, the ABW olfactory reception is only supposed
to affect the avoidance of pathogenic bacteria. The results showed that the PY2223 worms
couldn’t differentiate between bacteria and Luria broth. This trend suggests that a reduced
expression of the ODR-10 receptor in the AWB olfactory neuron impairs not only the
nematode’s ability to detect chemo-repellants (pathogenic bacteria), but also its ability to
differentiate between chemo-attractants (non-pathogenic bacteria). Further testing is required in
order to determine if this trend is legitimate or if it was an anomaly in the data.
The idea that a C.elegans’ AWB olfactory chemosensory system plays a key role in the
detection of pathogenic and non-pathogenic bacteria was supported using t-tests in order to show
that the N2 worm’s detection of bacteria was statistically significant over the PY2223 worm’s
detection. The t-tests supporting this were done by comparing the chemotaxis indices of N2
worms to PY2223 worms on the “E.coli OP50 vs. Luria broth”, “S.marcescens vs. Luria broth”,
and “E.coli OP50 vs. S.marcescens” plates. All three t-tests yielded values less than p=0.05,
indicating that there was statistical difference between wild-type and AWB olfactory deficient
mutant worms. This statistical analysis shows that the AWB olfactory deficient mutant worms
were observed to be significantly less able to differentiate between the three volatile substances.
21. Candidate ID 002904-0127
21
To summarize, two aspects were observed in this study. The first aspect was the ability of
C.elegans worms to detect different food sources. This aspect was addressed by comparing the
chemotaxis indices of N2 worms, showing that the worms preferred both E.coli OP50 and
S.marcescens to Luria broth. Additionally, it was observed that these N2 worms preferred E.coli
OP50 (non-pathogenic bacteria) compared to S.marcesecns (pathogenic bacteria). The second
aspect of this study was to attempt to make a connection between this differentiation of food
sources and the olfactory system of C.elegans. This was addressed by using mutant worms that
displayed reduced str-1 activity in the AWB neuron. The str-1 is a promoter for the ODR-10
diacetyl receptor. The reduced ODR-10 receptor was hypothesized to decrease a worm’s ability
to differentiate between pathogenic and non-pathogenic bacteria. The results for these worms
showed that they could not differentiate between any of the three substances. Additionally, t-tests
suggested a statistically significant difference in the differentiation ability between N2 worms
and PY2223, AWB olfactory deficient worms. Overall, it was observed that the reduced ODR-10
expression in the AWB neuron decreased a worms ability to differentiate. This suggests that the
olfactory system of C.elegans plays a role in the detection and differentiation of pathogenic and
non-pathogenic food substances.
Many uncertainties and errors may have occurred in this experimentation. These include:
contamination of bacteria and contamination of worms. Contamination was minimized by using
proper sterile technique throughout the entire experimentation. Additionally, human error may
have occurred when calculating the frequency of worms on each side of the plate during the
chemotaxis assay. If errors occurred they may have affected the data. This can be reduced by
following proper procedure and increasing replicates in order to decrease the affect of an outlier.
Another experimental flaw was the fact that all stock plates were cultured on E.coli OP50.
22. Candidate ID 002904-0127
22
Studies have shown that worms can detect this bacterial food source and later recognize it was
“good”. This may have influenced worms to move towards the E.coli OP50 in the chemotaxis
assay. This outside influence may be eliminated by only using worms that were freshly hatched
and never introduced to bacteria or another food source.
Future experimentation could be conducted by looking at other aspects of the olfactory
sensory system in C.elegans. For example the AWA and AWC neurons could be analyzed for
their affect by using a chemotaxis assay and mutant worms. Additionally, further studies could
look at other aspects of the AWB neuron, not just the ODR-10 diacetyl receptor.
Word Count: 3690
23. Candidate ID 002904-0127
23
References
Bargmann, C. I. (2006). Chemosensation in C. elegans.
Beanan, M. J., & Strome, S. U. S. A. N. (1992). Characterization of a germ-line proliferation
mutation in C. elegans. Development, 116(3), 755-766.
Brenner, D. S. (n.d.). A short history of c. elegans research. Retrieved from
http://wormclassroom.org/short-history-c-elegans-research
Grewal, P.S., and Wright, D.J. (1992). Migration of Caenorhabditis elegans larvae towards
bacteria and the nature of the bacterial stimulus. Fundam. Appl. Nematol. 15, 159–166.
Mueller, K.L., Hoon, M.A., Erlenbach, I., Chandrashekar, J., Zuker, C.S., and Ryba, N.J. (2005).
The receptors and coding logic for bitter taste. Nature 434, 225–229. Abstract Article
Pradel, E., Zhang, Y., Pujol, N., Matsuyama, T., Bargmann, C. I., & Ewbank, J. J. (2007).
Detection and avoidance of a natural product from the pathogenic bacterium Serratia
marcescens by Caenorhabditis elegans. Proceedings of the National Academy of
Sciences, 104(7), 2295-2300.
Troemel, E.R., Kimmel, B.E., and Bargmann, C.I. (1997). Reprogramming chemotaxis
responses: sensory neurons define olfactory preferences in C. elegans. Cell 91, 161–169.
Abstract Article
Nathoo, A.N., Moeller, R.A., Westlund, B.A., and Hart, A.C. (2001). Identification of
neuropeptide-like protein gene families in Caenorhabditis elegans and other species.
Proc. Natl. Acad. Sci. U.S.A. 98, 14000–14005. Abstract Article
24. Candidate ID 002904-0127
24
Appendix
Table A.1.1- Chemotactic Assay of N2 (Wild type) Worms Towards E.coli OP50 and
LB Broth (Raw Data)
Plate Worms on E.coli OP50 Side (# of
worms)
Worms on LB Broth Side (# of
worms)
1 36 6
2 12 4
3 19 5
4 27 9
5 32 7
6 17 5
7 19 4
8 26 6
9 15 3
10 19 4
25. Candidate ID 002904-0127
25
Table A.1.2- Chemotactic Assay of N2 Worms Towards S. marcescens and LB Broth
(Raw Data)
Plate Worms on S. marcescens Side (# of
worms)
Worms on LB Broth Side (# of
worms)
1 20 12
2 34 18
3 12 6
4 15 9
5 22 13
6 17 10
7 22 12
8 16 5
9 12 3
10 17 8
26. Candidate ID 002904-0127
26
Table A.1.3- Chemotactic Assay of N2 Worms Towards E.coli OP50 and S.
marcescens (Raw Data)
Plate Worms on E.coli OP50 Side (# of
worms)
Worms on S. marcescens Side (# of
worms)
1 15 3
2 12 2
3 27 6
4 38 11
5 22 7
6 15 4
7 26 5
8 33 7
9 22 5
10 29 6
27. Candidate ID 002904-0127
27
Table A.2.1- Chemotactic Assay of PY2223 Worms Towards E.coli OP50 and LB
Broth (Raw Data)
Plate Worms on E.coli OP50 Side (# of
worms)
Worms on LB Broth Side (# of
worms)
1 12 16
2 32 24
3 27 31
4 7 9
5 11 11
6 17 12
7 9 13
8 20 17
9 9 6
10 13 19
28. Candidate ID 002904-0127
28
Table A.2.2- Chemotactic Assay of PY2223 Worms Towards S. marcescens and LB
Broth (Raw Data)
Plate Worms on S. marcescens Side (# of
worms)
Worms on LB Broth Side (# of
worms)
1 5 7
2 11 9
3 20 16
4 2 3
5 12 15
6 12 17
7 16 15
8 9 11
9 12 12
10 11 10
29. Candidate ID 002904-0127
29
Table A.2.3- Chemotactic Assay of PY2223 Worms Towards E.coli OP50 and S.
marcescens (Raw Data)
Plate Worms on E.coli OP50Side (# of worms) Worms on S. marcescens Side (# of
worms)
1 5 4
2 8 11
3 9 5
4 2 5
5 6 6
6 12 7
7 11 9
8 6 7
9 11 13
10 5 5
30. Candidate ID 002904-0127
30
Processed Data
Table B.1.1- Chemotactic Indices of N2 (Wild type) and PY2223 (Olfactory Mutant)
Worms Towards E.coli OP50 and LB Broth
Plate N2 worms PY2223 worms
Worms on
E.coli OP50
Side (# of
worms)
Worms on LB
Broth Side (#
of worms)
Worms on
E.coli OP50
Side (# of
worms)
Worms on LB
Broth Side (#
of worms)
1 0.71 -‐0.71 -‐0.14 0.14
2 0.50 -‐0.50 0.14 -‐0.14
3 0.58 -‐0.58 -‐0.07 0.07
4 0.50 -‐0.50 -‐0.13 0.13
5 0.64 -‐0.64 0.00 0.00
6 0.55 -‐0.55 0.17 -‐0.17
7 0.65 -‐0.65 -‐0.18 0.18
8 0.63 -‐0.63 0.35 -‐0.35
9 0.67 -‐0.67 0.20 -‐0.20
10 0.65 -‐0.65 -‐0.19 0.19
Mean (±
St.Dev.) 0.61 -‐0.61 0.02 -‐0.02
Standard
Deviation (±)
0.07 0.07 0.19 0.19
31. Candidate ID 002904-0127
31
Table B.1.2- Chemotactic Indices of N2 (Wild type) and PY2223 (Olfactory Mutant)
Worms Towards S.marcescens and LB Broth
Plate N2 worms PY2223 worms
Worms on
S.marcescens
Side (# of
worms)
Worms on LB
Broth Side (#
of worms)
Worms on
S.marcescens
Side (# of
worms)
Worms on LB
Broth Side (#
of worms)
1 0.25 -‐0.25 -‐0.17 0.17
2 0.31 -‐0.31 0.10 -‐0.10
3 0.33 -‐0.33 0.11 -‐0.11
4 0.25 -‐0.25 -‐0.20 0.20
5 0.26 -‐0.26 -‐0.11 0.11
6 0.26 -‐0.26 -‐0.17 0.17
7 0.29 -‐0.29 0.03 -‐0.03
8 0.52 -‐0.52 -‐0.10 0.10
9 0.60 -‐0.60 0.00 0.00
10 0.36 -‐0.36 0.05 -‐0.05
Mean 0.34 -‐0.34 -‐0.05 0.05
Standard
Deviation (±)
0.12 0.12 0.12 0.12
32. Candidate ID 002904-0127
32
Table B.1.3- Chemotactic Indices of N2 (Wild type) and PY2223 (Olfactory Mutant)
Worms Towards E.coli OP50 and S.marcescens
Plate N2 worms PY2223 worms
Worms on
E.coli OP50
Side (# of
worms)
Worms on
S.marcescens
Side (# of
worms)
Worms on
E.coli OP50
Side (# of
worms)
Worms on
S.marcescens
Side (# of
worms)
1 0.67 -‐0.67 0.11 -‐0.11
2 0.71 -‐0.71 -‐0.16 0.16
3 0.64 -‐0.64 0.29 -‐0.29
4 0.55 -‐0.55 -‐0.43 0.43
5 0.52 -‐0.52 0.00 0.00
6 0.58 -‐0.58 0.26 -‐0.26
7 0.68 -‐0.68 0.10 -‐0.10
8 0.65 -‐0.65 -‐0.08 0.08
9 0.63 -‐0.63 0.05 -‐0.05
10 0.66 -‐0.66 0.00 0.00
Mean 0.63 -‐0.63 0.01 -‐0.01
Standard
Deviation (±)
0.06 0.06 0.21 0.21
33. Candidate ID 002904-0127
33
Sample Calculations
Mean:
𝑀𝑒𝑎𝑛 =
Σ 𝑋1, 𝑋2, 𝑋3, …
𝑛
X1, X2…= Data point
N= number of data points
Standard Deviation:
𝜎 =
Σ(𝑥 − 𝑥)!
𝑛 − 1
x=data point
x(bar)= mean of all data points
n= number of data points
Chemotaxis Index:
Chemotaxis Index(Side 1) =
(# 𝐶. 𝑒𝑙𝑒𝑔𝑎𝑛𝑠 𝑜𝑛 𝑆𝑖𝑑𝑒 1 − # 𝐶. 𝑒𝑙𝑒𝑔𝑎𝑛𝑠 𝑜𝑛 𝑆𝑖𝑑𝑒 2)
(# 𝐶. 𝑒𝑙𝑒𝑔𝑎𝑛𝑠 𝑜𝑛 𝑆𝑖𝑑𝑒 1 + # 𝐶. 𝑒𝑙𝑒𝑔𝑎𝑛𝑠 𝑜𝑛 𝑆𝑖𝑑𝑒 2)
T-Test:
Microsoft Excel was used for all calculations