Download to read offline

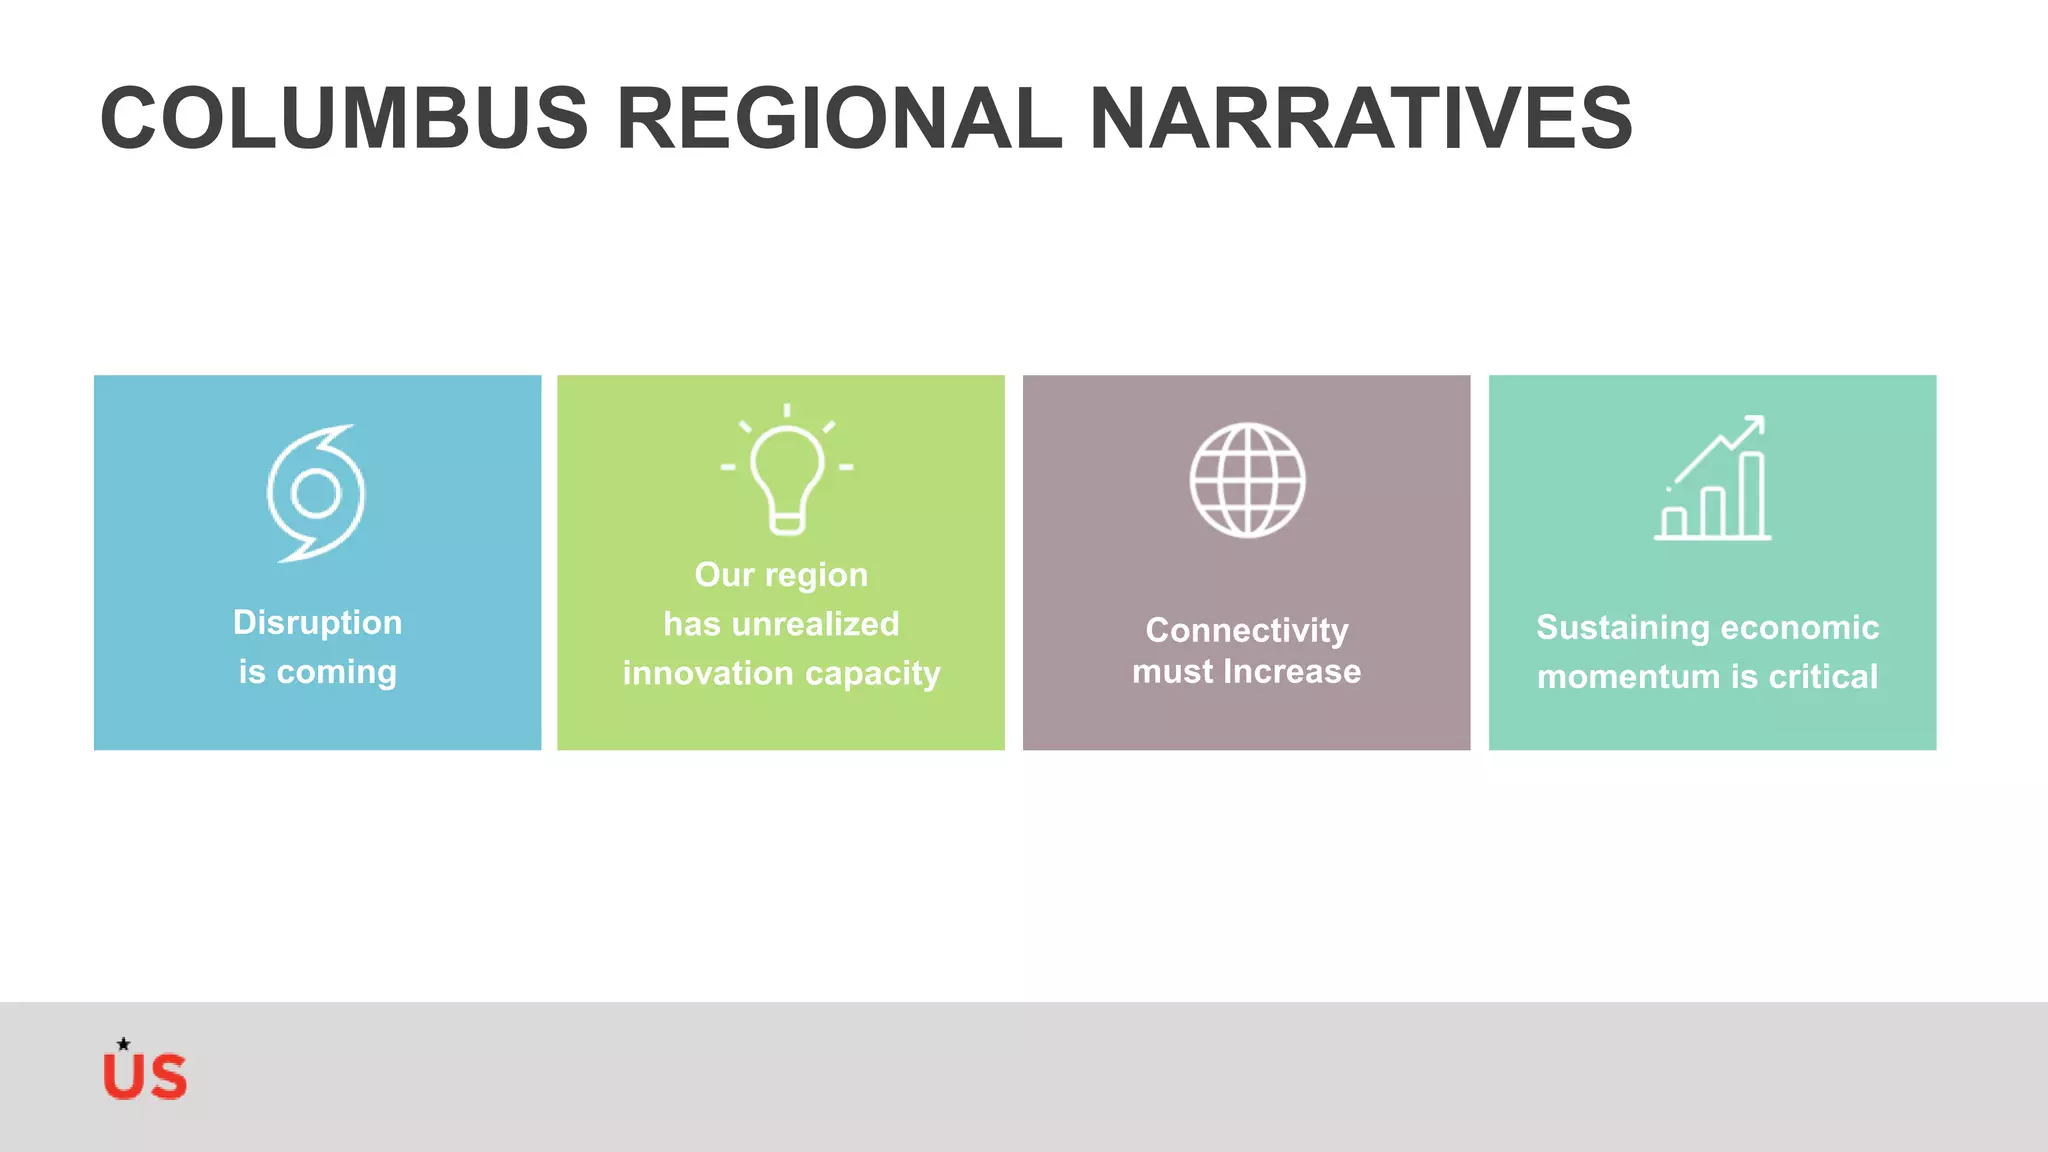

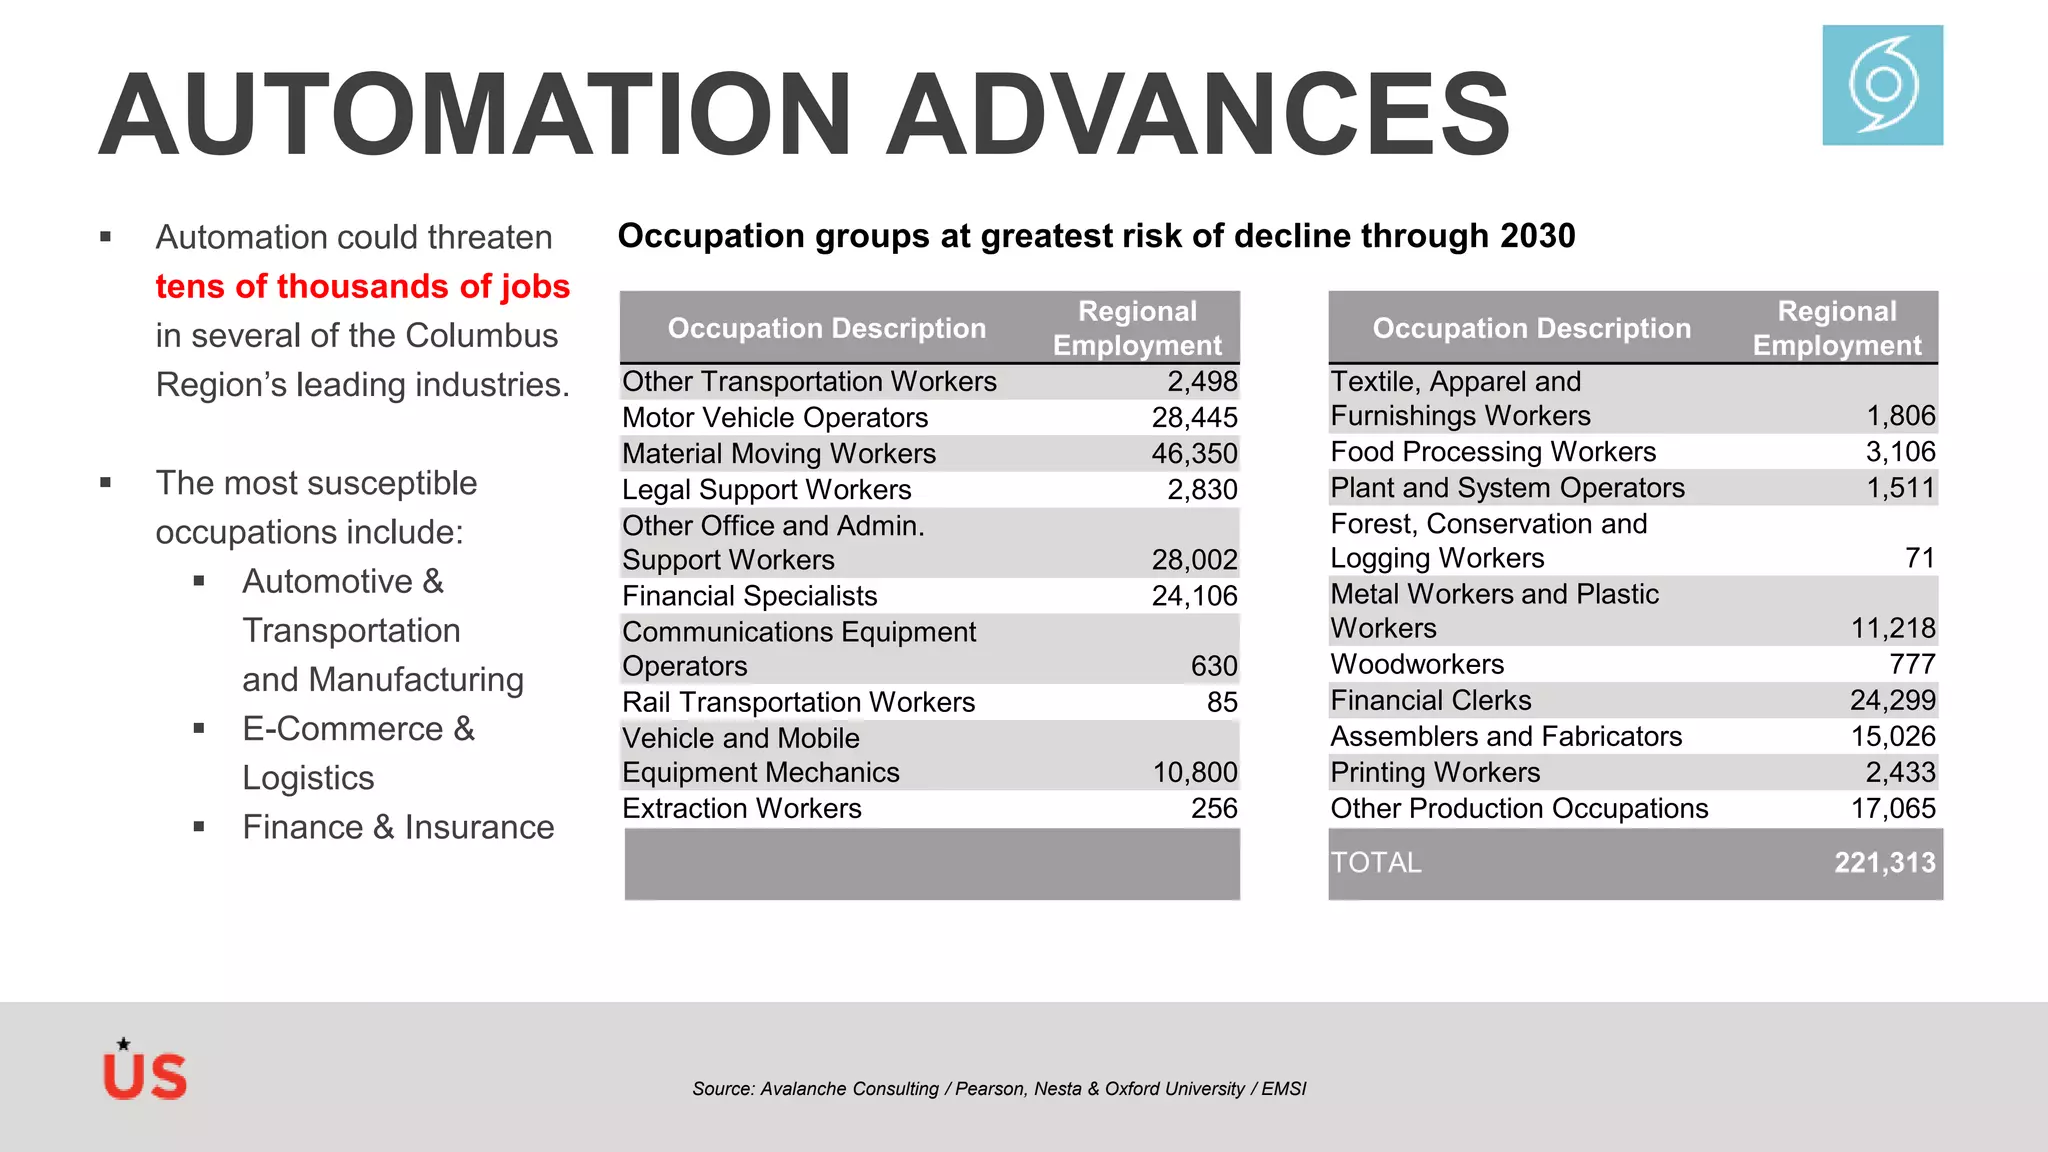


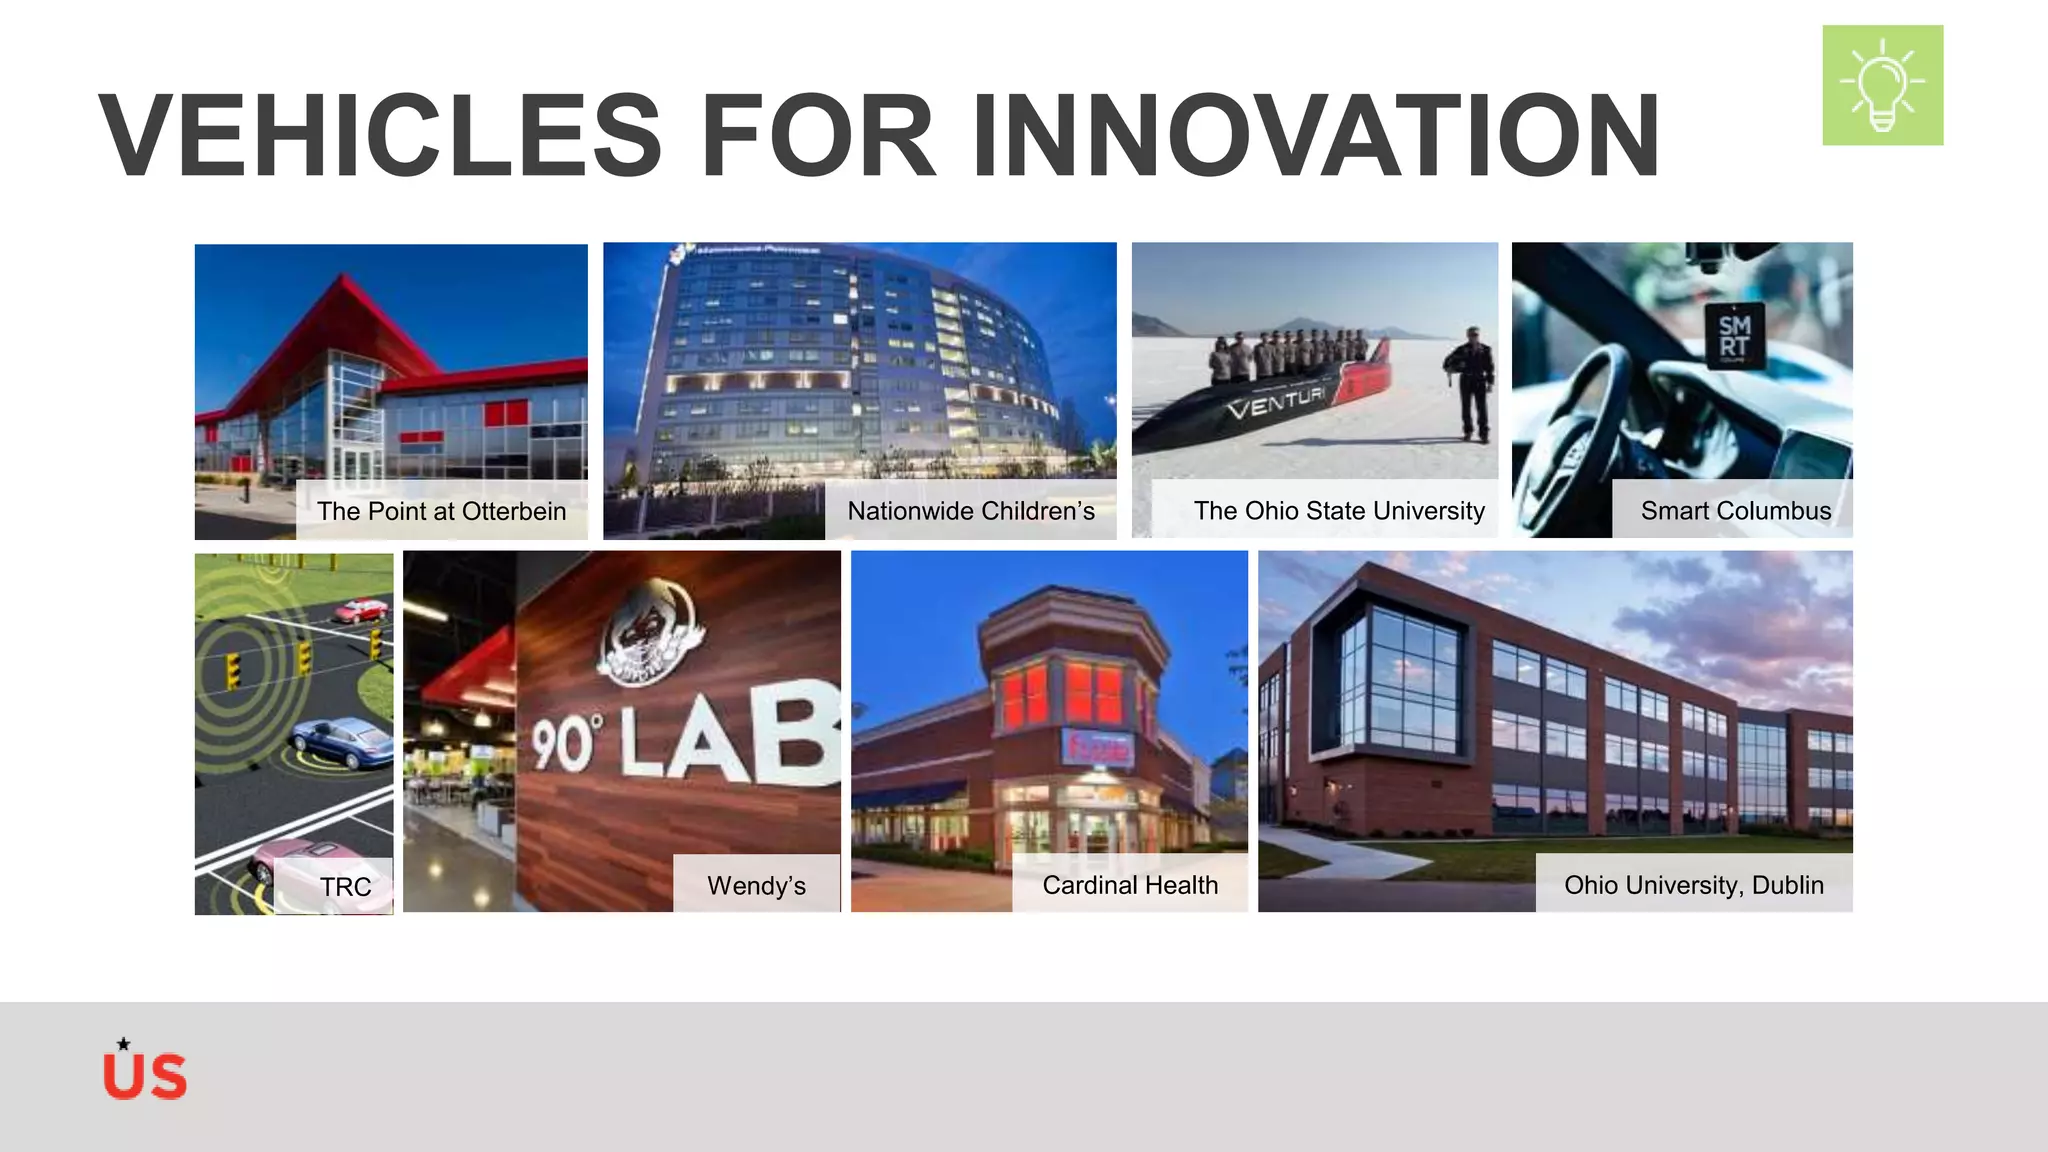


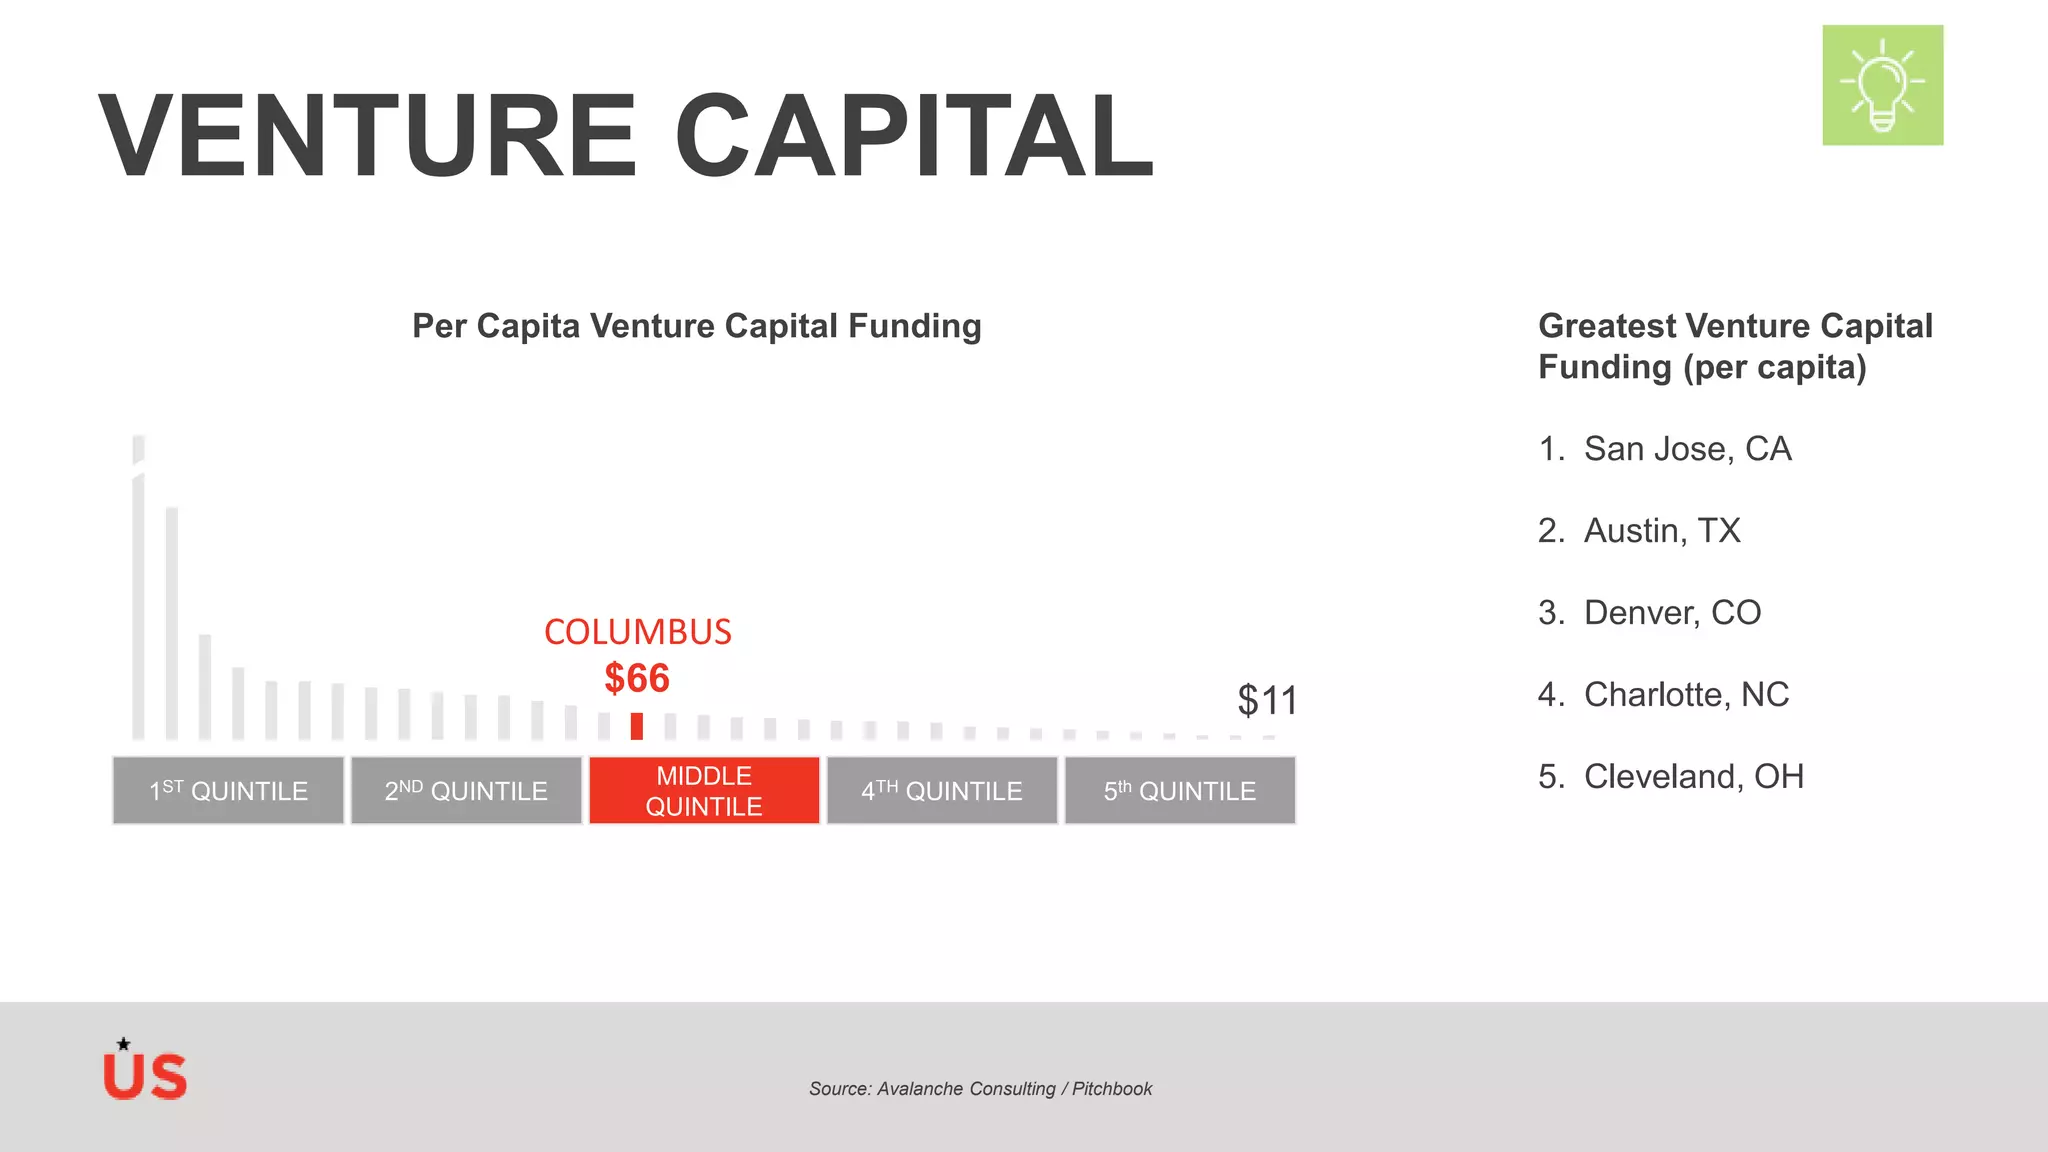


The document discusses disruption in the Columbus region from automation and outlines strategies to sustain economic momentum. Key points include: - Automation could threaten tens of thousands of jobs in industries like automotive, manufacturing, e-commerce, finance and insurance. - The Columbus region has unrealized innovation capacity as seen in strong entrepreneurial performance, vehicles for innovation like universities and research institutions, but room for growth in areas like R&D expenditures, patent production, and venture capital funding. - Connectivity must increase through more direct international flights, growing export activity, and attracting more foreign direct investment to integrate the region globally.


