Wave Characterization for Diagnosing Semi-Submerged Structures
1. Wave Characterization for the Diagnosis of Semi-Submerged Structures
INTRODUCTION
Rubble-mound breakwaters are designed under the proviso
that maintenance and repair works are going to be needed
during the structure's life. However, the continuous monitoring
of any given stretch of this kind of structures in not feasible yet.
This implies that the most common monitoring procedure so far
is the periodic inspection, which, in most cases, has been limited
to the inspection of the emerged part only, due to the cost of
underwaterinspection.
In Portugal, the National Civil Engineering Laboratory
(LNEC) is responsible for the inspection on the rubble mound
breakwaters that protect the ports controlled by the Portuguese
Port Directorate (which leaves out the major independent ports:
Leixões,Aveiro,Lisboa,SetúbalandSines).
This work started in 1985 and has been limited to the periodic
inspection of the above water part of those breakwaters. The
information gathered in these inspections is stored in a database
that can be queried to produce reports on both the structure's
status at the time of any inspection and the evolution of the
structure's damages between inspections. Based on this
information it is possible to give some hints on the expected
evolution of the structure, thus helping in the decision process
related to maintenance or repair works to be carried out on the
structure.
In spite of the availability of sea wave data collected at wave
buoys deployed at some points of the Portuguese coast, those
prognostics on the structure's evolution are seldom based on the
waveregimemeasuredorestimatedatthestructure's location.
Another point deserving improvement is the quantification of
the changes in the armour layer geometry, something that can be
accomplished by means of the survey of the armour layer
envelope. LNEC is involved, together with the Institute for
Systems and Robotics of Lisbon's Technical University (ISR)
and the Port of SinesAuthority (APS) in a joint research project,
code named MEDIRES, which aims at developing a device able
to produce efficient and accurate surveys of both the emerged
and submerged parts of the armor layer of rubble-mound
breakwaters.
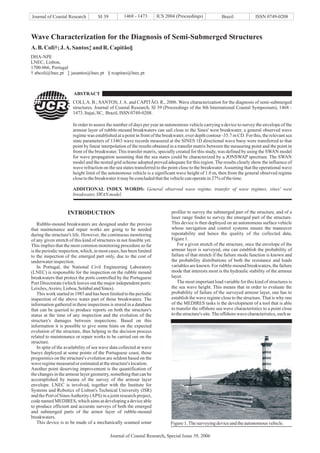
This device is to be made of a mechanically scanned sonar
profiler to survey the submerged part of the structure, and of a
laser range finder to survey the emerged part of the structure.
This device is then deployed on an autonomous surface vehicle
whose navigation and control systems ensure the maneuver
repeatability and hence the quality of the collected data,
Figure1.
For a given stretch of the structure, once the envelope of the
armour layer is surveyed, one can establish the probability of
failure of that stretch if the failure mode function is known and
the probability distributions of both the resistance and loads
variables are known. For rubble-mound breakwaters, the failure
mode that interests most is the hydraulic stability of the armour
layer.
The most important load variable for this kind of structures is
the sea wave height. This means that in order to evaluate the
probability of failure of the surveyed armour layer, one has to
establish the wave regime close to the structure.That is why one
of the MEDIRES tasks is the development of a tool that is able
to transfer the offshore sea wave characteristics to a point close
tothestructure's site.Theoffshorewavecharacteristics,suchas
Journal of Coastal Research SI 39 1468 - 1473 ICS 2004 (Proceedings) Brazil ISSN 0749-0208
A. B.Coli†;J.A. Santos‡ and R. Capitão§
DHA-NPE
LNEC, Lisbon,
1700-066, Portugal
† abcoli@lnec.pt ‡ jasantos@lnec.pt § rcapitao@lnec.pt
COLI,A. B.; SANTOS, J.A. and CAPITÃO, R., 2006. Wave characterization for the diagnosis of semi-submerged
structures. Journal of Coastal Research, SI 39 (Proceedings of the 8th International Coastal Symposium), 1468 -
1473. Itajaí,SC, Brazil,ISSN 0749-0208.
In order to assess the number of days per year an autonomous vehicle carrying a device to survey the envelope of the
armour layer of rubble-mound breakwaters can sail close to the Sines' west breakwater, a general observed wave
regime was established at a point in front of the breakwater, over depth contour -35.7 m CD. For this, the relevant sea
state parameters of 13463 wave records measured at the SINES 1D directional wave buoy were transferred to that
point by linear interpolation of the results obtained in a transfer matrix between the measuring point and the point in
front of the breakwater. This transfer matrix, specially created for this study, was defined by using the SWAN model
for wave propagation assuming that the sea states could be characterized by a JONSWAP spectrum. The SWAN
model and the nested grid scheme adopted proved adequate for this region. The results clearly show the influence of
wave refraction on the sea states transferred to the point close to the breakwater.Assuming that the operational wave
height limit of the autonomous vehicle is a significant wave height of 1.0 m, then from the general observed regime
closetothebreakwateritmaybeconcludedthatthevehiclecanoperatein27%ofthetime.
ADDITIONAL INDEX WORDS: General observed wave regime, transfer of wave regimes, sines' west
breakwater,SWANmodel.
ABSTRACT
Figure1.Thesurveyingdeviceandtheautonomousvehicle.
Journal of Coastal Research Special Issue 39, 2006,
2. the significant wave height, peak period and direction, can be
obtained from a pitch-and-roll buoy or from the results in a node
of a large scale numeric wave model. The transfer of these
parameterstothevicinityofthestructurecanbeusefulfor
1) issuing warnings related to the safety of the breakwater,
theportfacilitiesandtheterminaloperations;
2) together with the armor layer surveys, establishing the
structure's response tostormepisodes;
3) characterizing the general and extreme wave regimes that
willenablethepredictiononthestructure's evolution;
4) establishing the timing for the structure's maintenance and
repairworks, aswellasfor theinspectionsthemselves.
The methodology and the tools to be developed within the
scope of the MEDIRES project are to be tested at the west
breakwater of the Sines port. This port is located in the south-
western part of Portugal, about 100 km south of Lisbon (Figure
2). It is an open coast port and it is one of the few deep water
European ports. It is mainly a port for bulk products, namely,
oil, oil products and coal. The oil and the oil products terminals
are protected by the west breakwater, which has a length of 2200
m and whose armour layer is made of Antifer cubes weighting
90ton.
This paper presents the characterization of the sea wave
regimes at both the wave buoy deployed close to Sines, the so-
called SINES 1D buoy, and the region in front of the west
breakwater. Since there are no wave data collected close to the
breakwater, there is the need to transfer to that region the wave
regimedefinedatthelocationoftheSINES 1D buoy.
The work focuses on the general observed wave regime
whose definition enables the evaluation of the annual number of
days the surveys can be carried out for the given operational
constraints of the autonomous surface vehicle where the
surveying device is to be deployed. The procedures for the
transfer of the general observed wave regime can be easily
extended to transfer the extreme wave regime, if this is
available. Based on this regime one can perform the diagnosis
ofthesurveyedstructure.
After this introduction, the paper presents the basic concepts
of sea wave regimes definition and of the procedures available
for the transfer between two locations, which is a topic of
paramount importance for this kind of study, as well as the role
of the SWAN model ( 1996) on this transfer. Then,
the general observed wave regime at the location of the
SINES1D buoy is defined and transferred to a point in front of
the west breakwater. The spatial grids used with the SWAN
model as well as its control parameters are also presented.After
the discussion on the results obtained at the several grids
employed and on the possible applications for the transfer
matrix created to solve this problem, the conclusions are
presented.
In sea wave studies, two different statistical methods can be
applied to the sea wave parameters: the so-called short term and
long term statistics. In the short term statistics, the free-surface
elevation, periods and directions of a sea wave record are
described having in mind the characterization of the sea state in
the time interval of a typical wave record, usually 20 minutes.
Long term statistics use a characterization of sea states, along
several years, to evaluate the sea wave climate. The sea wave
climate, at a given point of the ocean, is defined by the long term
statistical behavior of the basic parameters that can be derived
from a wave record, such as significant wave height (HS), mean
zero up-crossing period (TZ), peak direction ( the mean
BOOIJ et al.,
BASIC CONCEPTS
SeaWaveRegimes
Q
Figure2.LocationofPortugalandSines.
Figure 3. The maritime region close to Sines' west breakwater
andthespatialgridsemployedinthisstudy.
Figure 4. General observed wave regime at the Sines 1D buoy in
termsofnumberofoccurrences.
Journal of Coastal Research Special Issue 39, 2006,
Wave Characterization for the Diagnosis of Semi-Submerged Structures 1469
3. direction of the spectrum peak frequency) and directional
spectrum [ ( , )]. The wave climate is composed by a set of
sub-climates,calledseawaveregimes.
A sea wave regime is then basically a statistical treatment of
the basic parameters of sea wave records, aiming to describe
statistical characteristics of the sea wave climate that are
appropriate for some specific engineering study. Thus, one can
have, among others, the general observed wave regime, the
averageregimeortheextremewaveregime.
The general observed wave regime consists in histograms,
single and joint histograms of the basic wave parameters (HS,
TZ, ), and possibly in time series charts of the same
parameters. These may be accompanied, when possible
statistically, by linear regressions which attempt to establish
relationships between the parameters. The extreme wave
regime consists of the extrapolated values of the annual
maximum significant wave height and maximum wave height,
for a set of return periods, together with associated wave periods
and directions to those extrapolated values. In the design of
maritimestructuresthetworegimesareuseful.
This paper aims to characterize the general wave regime
close to Sines' west breakwater. This is done by transferring,
using a numerical model, the offshore general observed wave
regimetothevicinityofthebreakwater.
,
,
geographic and
spectral spaces, is carried out by using implicit numerical
schemes.
For the significant wave heights, the mean is 1.66 m, the
standard deviation is 0.91 m and the most frequent value lies
between 1.0 and 1.5 m. For the peak period, the mean and
standard deviation are 9.0 s and 2.29 s, respectively, and the
most frequent values lie between 7 and 8 s. For the peak
direction at the location of the SINES 1D the most frequent
valuesarecontainedintheinterval305º-310º.
In order to choose the most adequate spatial grid, some tests
were conducted to assess the accuracy of the grid and the CPU-
time needed.The solution adopted consists of two quadrangular
grids, one covering the Sines region, with a coarse grid, and a
nested,finer,gridthatcoverstheareaclosetothebreakwater.
E s q
Q
s q
s q
TheTransferofSeaWaveRegimes
RESULTS
GeneralObservedWaveRegimeatSINES1D
SWAN ModelRun
For the definition of a sea wave regime plenty of sea wave
data should be available at the desired point. These data should
ideally be measured by wave buoys deployed close to that point.
When no data are available, a possible solution is to use data
collected at points not too far from the desired location and to
transfer those data offshore and then to the desired point.
. (2002) present a methodology to perform such transfer of
seawaveregimes.
For the Sines' west breakwater there are no wave buoy data
collected in the vicinity of the structure but there are data
collected by a pitch and roll buoy (Wavec/Direc) deployed at a
point located a couple of kilometers to the west of that structure
over the -97 m (CD) depth contour, Figure 3, the so-called
SINES 1D buoy, for which there were 8 years of directional
measurementsavailable.
The transfer of the sea wave data was made by means of the
SWAN numerical model ( ., 1996). This is a phase
averaging wave model, able to characterize the sea waves in
nearshoreregions,uptothebreakingzone.
Conceptually, the SWAN can be considered a third
generation model and it is based on the equation for the
conservationofwaveaction:
(1)
in which is the wave action (the quotient of the
directional spectrum to the intrinsic frequency, ), and are
the horizontal coordinates, is the mean wave direction per
frequency, and , and are propagation velocities in the
corresponding spaces. The term = ( ), at the right hand
side of the action balance equation, is the energy source / sink
term and represents the effects of wave generation and
dissipationandthenon-linearwave-waveinteractions.
The SWAN model has implemented the physical processes
of propagation through geographic space, refraction and
shoaling due to bottom and current variations, blocking and
reflections by opposing currents, transmission through or
blockage by obstacles and dissipation effects due to
whitecapping, bottom friction and wave breaking. The
propagation in the SWAN model, in both
At Sines, the directional wave data have been collected by a
Wavec buoy, called SINES 1D, since May 1988. This buoy was
deployed at a point whose coordinates are 37° 55' 16” N, 8° 55'
44”W,wherethewaterdepthis97m(CD).
The data sources for this study are the monthly and quarterly
reports of processed wave data published by the Portuguese
Hydrographic Institute (IH), (1988-1995). From these
reports, the three-hourly values (i.e., records of twenty minutes
taken every three hours) of HS, TZ and were collected and
considered in this study. These parameters, from 13463 wave
records ranging from May 1988 to December 1995, although
with some measurement gaps, were used to produce the general
wave regime at SINES 1D. Only the values taken every 3 hours
were considered in this general wave regime. This means that
intermediate values measured during storms (when the buoy
broadcasts wave measurements continuously) were not
considered and so the highest significant wave height in the
built sample may not be the highest HS that occurred in that time
interval.
A summary of the general observed wave regime at the
SINES1D buoy is presented in Figure 4, where the bivariate
histogramofHS and arepresented.
The wave directions of the sea states observed at SINES 1D
buoy range from 180º to 330º. The most frequent waves
(occurrences above 10% in each interval) have a wave direction
in the interval 295º to 315º. Significant wave heights range
between 0.25 m and 7.5 m, the most frequent waves having HS
values between 0.5 m and 2.5 m. Significant wave heights
above 5 m are found in the direction range 250º to 320º. The
observed wave peak periods (TP) at the SINES1D buoy are in
the range 4 to 20 s, while the most frequent range is from 6 to 10
s.Table1presentsthepeakperiods' rangeperdirectionsectors.
The maritime region in the neighbourhood of the Sines' west
breakwater presents no special features: the bottom depth
contours are more or less parallel to the breakwater alignment.
Close to the breakwater the sea bottom has a high slope. The
spatial grid employed to characterize the sea bottom at the study
region encompasses the port structures, the coastline and the
location of the SINES 1D wave buoy, Figure 3. Bottom data was
collected from the Portuguese nautical chart
(PT 324205) and from some bathymetric surveys in the
vicinity of the west breakwater commissioned by the APS in
1998 and2000.
Both grids are presented in Figure 3. The coarse grid covers
the whole area presented in that figure whose boundaries are the
COLI
BOOIJ
COSTA
et al
et al
N( ,x,y,t)
x y
c c , c c
S S
Cabo de Sines a
Lagos
s
q
Q
Q
x y ? ?
sqs
qs
S
NcNc
Nc
y
Nc
xt
N
yx
=
¶
¶
+
¶
¶
+
¶
¶
+
¶
¶
+
¶
¶
)()(
)()(
Journal of Coastal Research Special Issue 39, 2006,
Table1.SINES1D buoyTPranges bydirectionalsectors.
SSW 4 13 1.05
SW 5 14 1.60
WSW 4 13 1.40
W 4 20 6.5
WNW 4 20 43.26
NW 4 18 46.02
Sector TP min (s) TP max (s) Occurrence (%)
Coli .et al1470
4. meridians 8º 51' 15.4” W and 8º 55' 52.6” W and the parallels
37º 54' 18.2” N and 37º 57' 58.9” N.The width of this coarse grid
is 6875 m and the height is 6750 m, the size of the side of the
quadrangular grid units being 125 m. The location of the SINES
1D buoy is close to the western domain boundary. The fine grid
has a resolution of 5 m, a width of 450 m and a height of 500 m.
Point P, near the Sines' west breakwater, has the coordinates 8º
53' 31.57” W and 37º 56' 36.98” N, and is over a water depth of
35.7 m (CD). In all the computations, the tide level considered
was themeanannualvalueof3.3m.
The wave parameters needed to run the SWAN model were
introduced at the coarse grid boundary. Since the number of sea
wave data records available is quite high (13463), it was
decided that, instead of running the SWAN model for each of
those records individually, the transfer function between the
wave buoy location and a point in front of the west breakwater
should be evaluated for a 3-D matrix covering the range of
possible values for the wave height, period and direction at the
buoy. This procedure reduces substantially the number of
computations and enables also the transfer, in real time, to a
point close to the breakwater of the characteristics of the sea
wavesmeasuredatthebuoy.
Since there were no spectral data available at the time of
performing this study, the wave data supplied to the model were
the result of a parameterisation of the spectrum measured at the
buoy location. Thus, for each set of HS, TP and values a
directional wave spectrum was defined at the boundary of the
coarse grid as the product of a JONSWAPspectrum, with a peak
enhancement factor of 3.3, by a directional spreading function
of cosine-type to an even power (2s), s being equal to 10. The
frequency discretization used 31 frequencies ranging from 0.02
to 0.4 Hz, with a logarithmic distribution. The directional
discretizationcoveredarangeof180ºwitha2ºresolution.
All the computations, with SWAN version 40.11, cycle III,
were carried out in stationary mode, with no tidal currents or
wind blowing over the study region. In the operation of the
SWAN model the following phenomena were included:
refraction, shoaling and dissipation by whitecapping, bottom
friction and depth-induced wave breaking. Each run of the
SWAN model was made of two steps. In the first step the model
was run with the JONSWAP spectrum parameterisation at the
boundary of the coarse grid. The JONSWAP spectra were
defined at the same boundary of the peak direction, if it is N, S or
W, and at two boundaries if the peak direction is from the other
octants; for example, to = SW, the spectra are defined at S and
W boundaries. These runs produced the wave spectra along the
boundary of the fine nested grid, which were the boundary
conditions needed for running the second step, now at the nested
grid.
Q
Q
The results of the SWAN model, in every point of the
domain, consisted in the significant wave height (HS), the mean
and the peak period (TZ, TP), the mean and the peak wave
direction ( m, ), a directional spreading (dspr) and a water
level( ).
Figure 5 shows the SWAN results obtained for a sea state
withHS =9.0 m,TP=18s and =315º (SW).
To carry out the transfer to point P of the 13463 three-hourly
values of parameters measured at SINES 1D, the transfer matrix
created for this task had to be interpolated to those values. In
order to make the interpolations easier, it was decided to have
constant intervals in the three parameters of the transfer matrix.
Thus, the HS input values had 1 m resolution, TP had 1 s and
had 22.5º. The range of the offshore parameters of this transfer
matrix were defined having in mind both the ranges of those
parameters observed in the data measured at the SINES 1D
buoy available for this study and the physically sound
combinations of those parameters. For example, it would be
useless to combine large significant wave heights with small
peak periods, for instance HS = 4 m and TP = 4 s. For each set
(HS, TP and ) at the buoy, a similar set was evaluated at the
point close to the breakwater. Given the measured values at the
SINES 1D buoy, the corresponding values close to the
breakwater were evaluated by linear interpolation. This implied
the selection of the eight points in the (HS, TP and ) space
closesttothemeasuredpoint.
The general wave regime resulting from these calculations
has pea
Q Q
h
Q
Q
Q
Q
General Wave Regime Close to the West
Breakwater
k directions ranging from 180º to 325º, significant wave
Figure 5. Example of a SWAN run for a sea state with HS = 9 m,
TP=18s and =315º.Q
Figure 6. General wave regime at a point P near Sines' west
breakwaterintermsofnumberofoccurrences.
Journal of Coastal Research Special Issue 39, 2006,
Table2.TPranges bydirectionalsectors atpointP.
Sector TP min (s) TP max (s) Occurrence (%)
SSW 4 11 0.94
SW 5 14 1.74
WSW 4 12 1.43
W 4 20 12.23
WNW 4 17 53.98
NW 4 11 29.61
Wave Characterization for the Diagnosis of Semi-Submerged Structures 1471
5. heights from 0.25 to 7.0 m and peak periods from 4 to 20 s, see
Figure 6 and Table 2. The most frequent HS (occurrences above
10% in each interval) are between 0.5 and 2.0 m while the most
frequent are within 285º to 310º interval and TP between 6
and 11 s. The highest HS values (above 5 m) are found in the
270-295º direction intervals, plus the 250-255º interval, where
these highest waves have TP above 11.5 s. Table 2 indicates the
rangeofthepeakperiodsdistributedbydirectionsectors.
It should be noted that all the computations were made
assuming that the sea states at the buoy location could be
modeled by a JONSWAP spectrum whose peak period and
significant wave height are given by the corresponding
parameters taken from the measured wave records. In what
concerns the directional spreading of the wave spectrum, it was
assumed that the mean direction of the peak period obtained
from the wave records is valid for all the frequencies considered
in the spectrum discretization. In addition, the same directional
spreading function, cosine to an even power, is used for all
frequencies. These assumptions may be questionable since
(1992) found that 24% of the spectra measured at
Sines were bimodal, although 63% were one-peaked spectra.
Moreover, it should be pointed out that all SWAN runs were
performed for a constant tide level without considering the
effectsofwind.
Despite these limitations, the results are an important step
towards the knowledge of the general observed wave regime
close to the Sines' west breakwater. By comparing the general
observed wave regime measured at the SINES 1D, Figure 4, and
the regime transferred to point P (close to Sines' west
breakwater), Figure 6, it may be concluded that there are no
major differences between the corresponding bivariate (HS, )
histograms for less than 270º (waves coming from the south
to west sector). The same does not apply for greater than 270º
(waves from the west to north sector) since in this case the
bivariate histogram is strongly modified from the buoy location
to point P. This is an interesting result because the west
breakwater has an almost north-south alignment, (Figure 3),
and there are no obstacles between the domain boundaries and
point P. This means that the waves that reach the wave buoy
should certainly reach point P. However, only waves coming
from the west to north sector experience noticeable
modifications.This is due to the refraction caused by the bottom
configuration, which changes the wave directions in spite of the
point Pbeing located over a water depth that is often considered
not so shallow. This conclusion is confirmed with the results of
Table 1 and Table 2, which show a concentration in point P of
the large period waves around the west octant. In fact, the
maximum value of TP=20 s observed at the buoy in the NW
octantwas replacedbyasmallervalue,TP=11s, atpointP.
For this, the sea state parameters of the 13463 wave records
measured at the SINES 1D directional wave buoy were
transferred to that point by linear interpolation of the results
obtained in a transfer matrix between those two points. This
transfer matrix was defined by using the SWAN model for wave
propagation assuming that the sea states at the buoy location
could be modeled by a JONSWAP spectrum and a directional
spreading function. All the SWAN runs were performed for a
constanttidelevelandwithoutconsideringwind effects.
The results clearly show the influence of wave refraction on
the sea states transferred to the point close to the breakwater. In
fact, for sea states coming from south to west, which are more
orthogonal to the bottom depth contours, there are no major
differences between the general observed wave regime
bivariate histograms obtained at the SINES 1D buoy and at
point P. The same does not apply for sea states coming from the
west to north sector, which are more oblique to the bottom depth
contours. The distribution of the period ranges per wave
direction at the point close to the breakwater shows a
concentrationofthelargeperiodsaroundthewest octant.
Assuming that the operational wave height limit of the
autonomous vehicle is a significant wave height of 1.0 m, then
from the general observed regime close to the breakwater it may
beconcludedthatthevehiclecanoperatein27%ofthetime.
Despite the limitations mentioned previously, the
implementation of the SWAN model for the maritime region
close to Sines constituted an important step towards the
definition of the general observed wave regime in this region.
Q
Q
Q
Q
The mean and standard deviation for HS are 1.46 m and 0.69
m and, for TP, are 8.9 s and 1.71 s, respectively. The mode for
HS is the 0.5-1.0 m interval, forTPis the 7-8 s interval and for
isboththe295-300ºand300-305ºintervals.
The results of the SWAN model for the transfer matrix
showed no major differences in the parameters HS, TP and at
the point P calculated using either the coarse grid only or the
finer grid nested on the coarse grid. The only exceptions are the
sea states whose direction at the SINES 1D buoy is 180º (waves
coming from south). In fact, for all the wave directions at the
buoy, the TP values obtained at the point P with the coarse grid
docoincidewiththevaluesobtainedwiththefinegrid.
Apart from the south sea states, something similar happens
with the HS and results, although in these cases some
differences can be found between the results from the coarse
and the fine grids: a maximum difference of 10% in the HS
results and a maximum difference of 6º in the results can be
observed.
Sea states coming from south were those where the largest
differences between the results from the coarse and the fine grid
were found.This fact can be seen in Figure 7, which presents the
evolution of HS and at point P, for several values ofTPand for
sea states from south and significant wave height equal to 1 m at
the buoy location. Apparently, for the coarse grid, the SWAN
model was insensitive to the bathymetry close to the
breakwater. For the fine grid, the bottom depth was discretized
with more detail and so the depth variations could be felt by the
propagatingseastatesandrefractionthatoccurred.
Figure 7 shows that the difference between values
obtained both with the coarse grid and the fine grid reaches the
maximum of 18º at TP=11 s. In what concerns HS, the
maximum difference occurs for TP=9 s and is equal to 30% of
theHS valueobtainedwiththefinegrid.
This paper focused on one of the several roles that the
characterization of wave regimes may play in the diagnosis of
semi-submerged structures: the assessment of the number of
days per year the inspection activities can be carried out due to
the operational constraints of the vessel that carries the
instrument to survey the envelope of the armour layer of rubble-
mound breakwaters. This implied the establishment of the
general observed wave regime at point P, in front of the
breakwater,overdepthcontour-35.7mCD.
Q
Q
Q
Q
Q
Q
DISCUSSIONS
SWAN ModelingandWaveDataTransfer
GeneralWaveRegime
CONCLUSIONS
SOARES et al.
Figure 7. Differences in HS and between the two SWAN grid
runs. SeastatesatSINES 1D withHS =1mand =180º.
Q
Q
Journal of Coastal Research Special Issue 39, 2006,
Coli .et al1472
6. In fact, this type of model operation and the use of two nested
grids and of the transfer matrix provided some insight on the
most adequate methodology to process future wave data that
may be received from the SINES 1D wave buoy. This way,
whenever the wave buoy broadcasts new measurements, a
quick processing of these data to estimate the sea state at P may
consist of using the parameters defined for that sea state in the
interpolation matrix built for this study. This kind of
information close to the breakwater can be used to issue
warnings on the safety of both the structure and the port
operations. A more elaborate, and time consuming, procedure
will include the input of the data from the wave buoy into the
SWAN model with the spatial grids the coarse and the nested
grid - used for this study. Ideally the characterization of the
energy distribution of frequency and direction ranges should be
available. Then, instead of the JONSWAP model for the
definition of the sea state at the buoy location one could use a
more accurate description of that sea state and this would
produce a better prediction of the sea state in front of the west
breakwater. With this prediction one may update the wave
regimes, the observed and, eventually, the extreme wave
regimes, in front of that structure and this will be of use to
evaluate the actions on the structure and hence to the structure's
diagnosis,whichthemajoraimoftheMEDIRES project.
N.R.; L.H. and R.C., 1996. The
SWAN wave model for shallow water. , Orlando,
668-676.
A.B.; J.A.; C.J.; R. and
M.M., 2002. Metodologia de propagação de
regimes de agitação marítima do largo para a costa: análises
dos modelos BACKTRACK-REFSPEC e SWAN.
,Oporto,Portugal.
M.S., 1988-1995. Tratamento de dados de agitação
marítima. Sines.
.InstitutoHidrográfico,Lisbon,Portugal.
J.A. and N., 1998. Progression and
variability of damage on rubble-mound breakwaters.
ASCE,
124(6),286-294.
C.G.; M.C. and P., 1992.
Probabilidade de ocorrência de estados de mar combinados
na Costa Portuguesa. : SOARES, C.G. (ed.),
, vol. IX, Lisbon, Portugal, pp.13.1-
13.32.
ACKNOWLEDGEMENTS
LITERATURE CITED
The authors would like to acknowledge the financial support
of the study “Stochastic Modeling of Sea Waves” of the project
“Modeling of Sea waves and Currents” from LNEC's own
research plan for 2001-2004. The MEDIRES project has the
financial support of Portuguese government funds and the
EuropeanFund for RegionalDevelopment.
BOOIJ, HOLTHUIJSEN, RIS,
COLI, SANTOS, FORTES,
CARVALHO,
COSTA,
MELBY, KOBAYASHI,
SOARES, NOLASCO, MENDES,
ICCE´96
6º
Congresso daÁgua
Series of technical reports from May 1988
toDecember1995
J.
Waterway, Port, Coast and Ocean Engineering,
In A engenharia
naval em Portugal
CAPITÃ O,
Journal of Coastal Research Special Issue 39, 2006,
Wave Characterization for the Diagnosis of Semi-Submerged Structures 1473