1. Experimental Observation of the Evanescent Wave in a
Smith-Purcell Free-Electron Laser
H. L. Andrews, C. A. Brau, J. D. Jarvis, Department of Physics and Astronomy, Vanderbilt University, Nashville, TN, USA
C. F. Guertin, A. O’Donnell, B. Durant, T. H. Lowell, and M. R. Mross, Vermont Photonics, Bellows Falls, VT, USA
Theory and Simulation Results
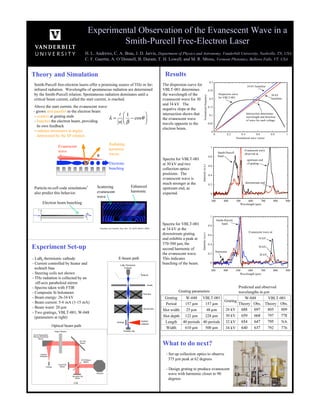
0.3
0.25
0.2
0.15
0.1
0.05
1
0.8
Spectra for VBLT-001
at 30 kV and two
collection optics
positions. The
evanescent wave is
much stronger at the
upstream end, as
expected. 0
Spectra for VBLT-001
at 34 kV at the
downstream grating
end exhibits a peak at
370-380 μm, the
second harmonic of
the evanescent wave.
This indicates
bunching of the beam.
Smith-Purcell free-electron lasers offer a promising source of THz or far-infrared
radiation. Wavelengths of spontaneous radiation are determined
by the Smith-Purcell relation. Spontaneous radiation dominates until a
critical beam current, called the start current, is reached.
Above the start current, the evanescent wave:
λ =
n
1
β
− cosθ
⎛
⎝ ⎜
*Donohue and Gardelle, Phys. Rev. ST-AB 9, 060701 (2006)
Particle-in-cell code simulations*
also predict this behavior.
34 kV beamline
Evanescent wave
observed at:
downstream end
Dispersion curve
for VBLT-001
300 400 500 600 700 800 900
W-048 VBLT-001
Theory Obs. Theory Obs.
809
778
NA
776
26 kV 688 697
805
30 kV 659 668
797
32 kV 654 647
795
34 kV 640 637
792
Grating
Predicted and observed
wavelengths in μm
0.6
0.4
0.2
Intensity (a.u.)
1
0.8
0.6
0.4
0.2
Grating parameters
Grating W-048 VBLT-001
Period 157 μm 157 μm
Slot width 25 μm 48 μm
Slot depth 122 μm 228 μm
Length 40 periods 40 periods
Width 610 μm 500 μm
What to do next?
Electron beam bunching
Experiment Set-up
- LaB6 thermionic cathode
- Current controlled by heater and
wehnelt bias
- Steering coils not shown
- THz radiation is collected by an
off-axis paraboloid mirror
- Spectra taken with FTIR
- Composite Si bolometer
- Beam energy: 26-34 kV
- Beam current: 5-6 mA (1-15 mA)
- Beam waist: 20 μm
- Two gratings, VBLT-001, W-048
(parameters at right)
Scattering
evanescent
wave
Enhanced
harmonic
- Set up collection optics to observe
375 μm peak at 62 degrees
- Design grating to produce evanescent
wave with harmonic closer to 90
degrees
Wavelength (μm)
Smith-Purcell
band
upstream end
of grating
0
300 400 500 600 700 800 900
Intensity (a.u.)
Wavelength (μm)
Smith-Purcell
band
Evanescent wave at:
Harmonic
34 kV
30 kV
26 kV
Optical beam path
E-beam path
⎞
⎠ ⎟
The dispersion curve for
VBLT-001 determines
the wavelength of the
evanescent wave for 30
and 34 kV. The
negative slope at the
intersection shows that
the evanescent wave
travels opposite to the
electron beam.
0
0 0.2 0.4 0.6 0.8 1
Normalized frequency
Normalized wave vector
30 kV
beamline
Intersection determines
wavelength and direction
of wave for each voltage
- grows anti-parallel to the electron beam
- scatters at grating ends
- bunches the electron beam, providing
its own feedback
- radiates harmonics at angles
determined by the SP relation
Electrons
bunching
Evanescent
wave
Radiating
harmonic
θ waves