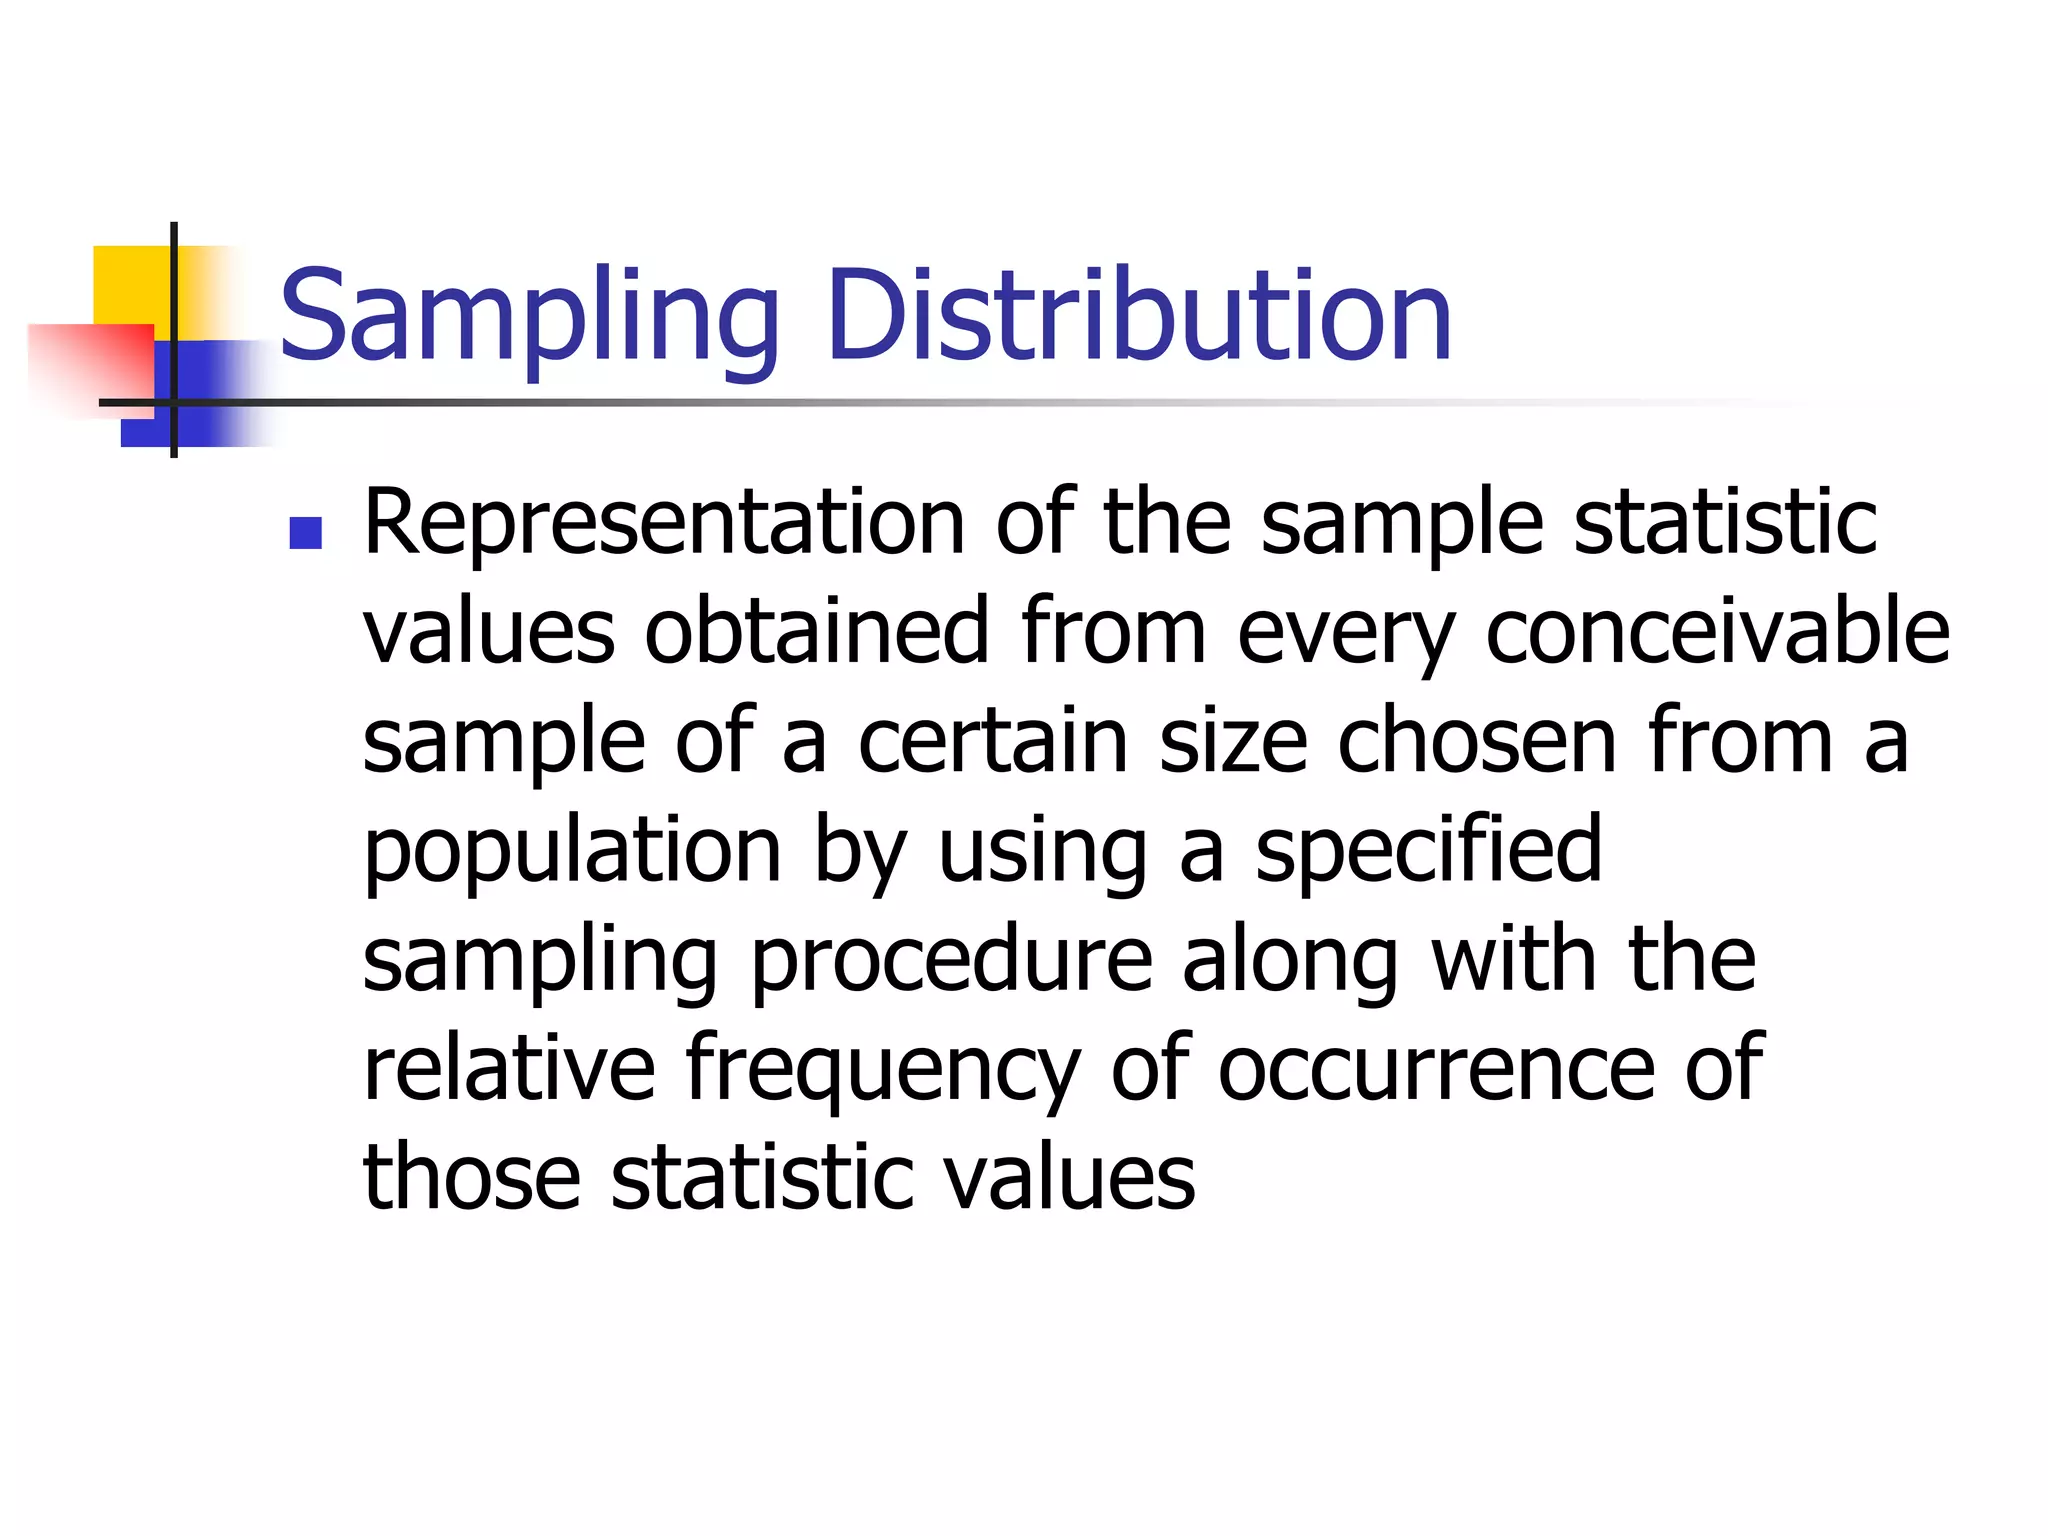
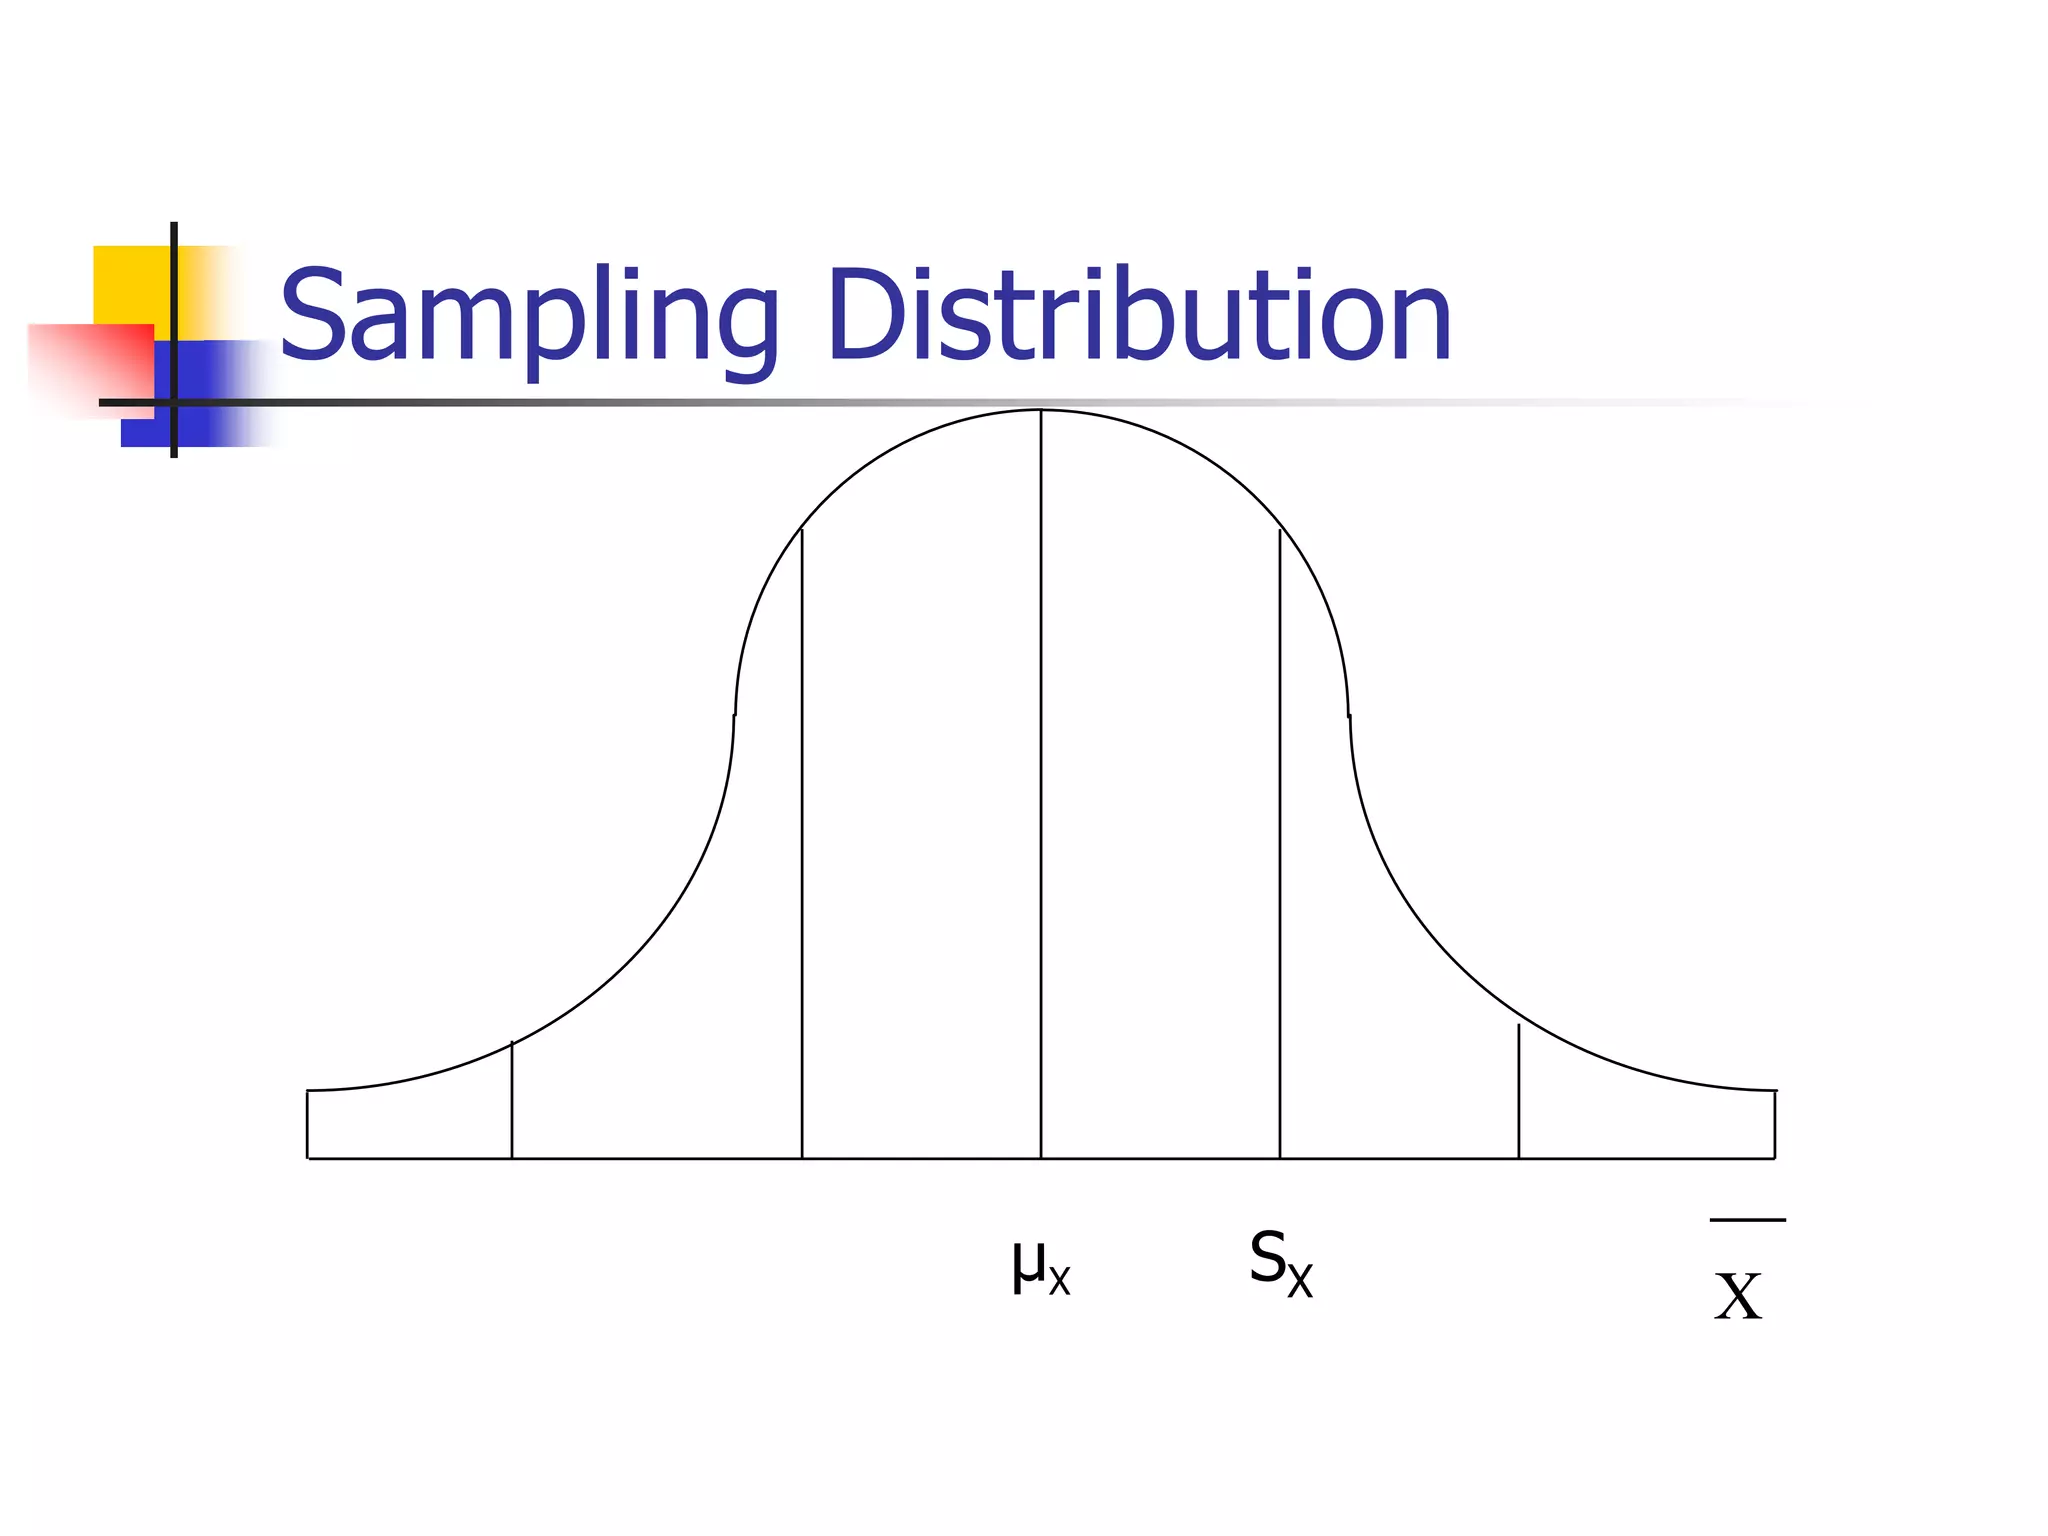
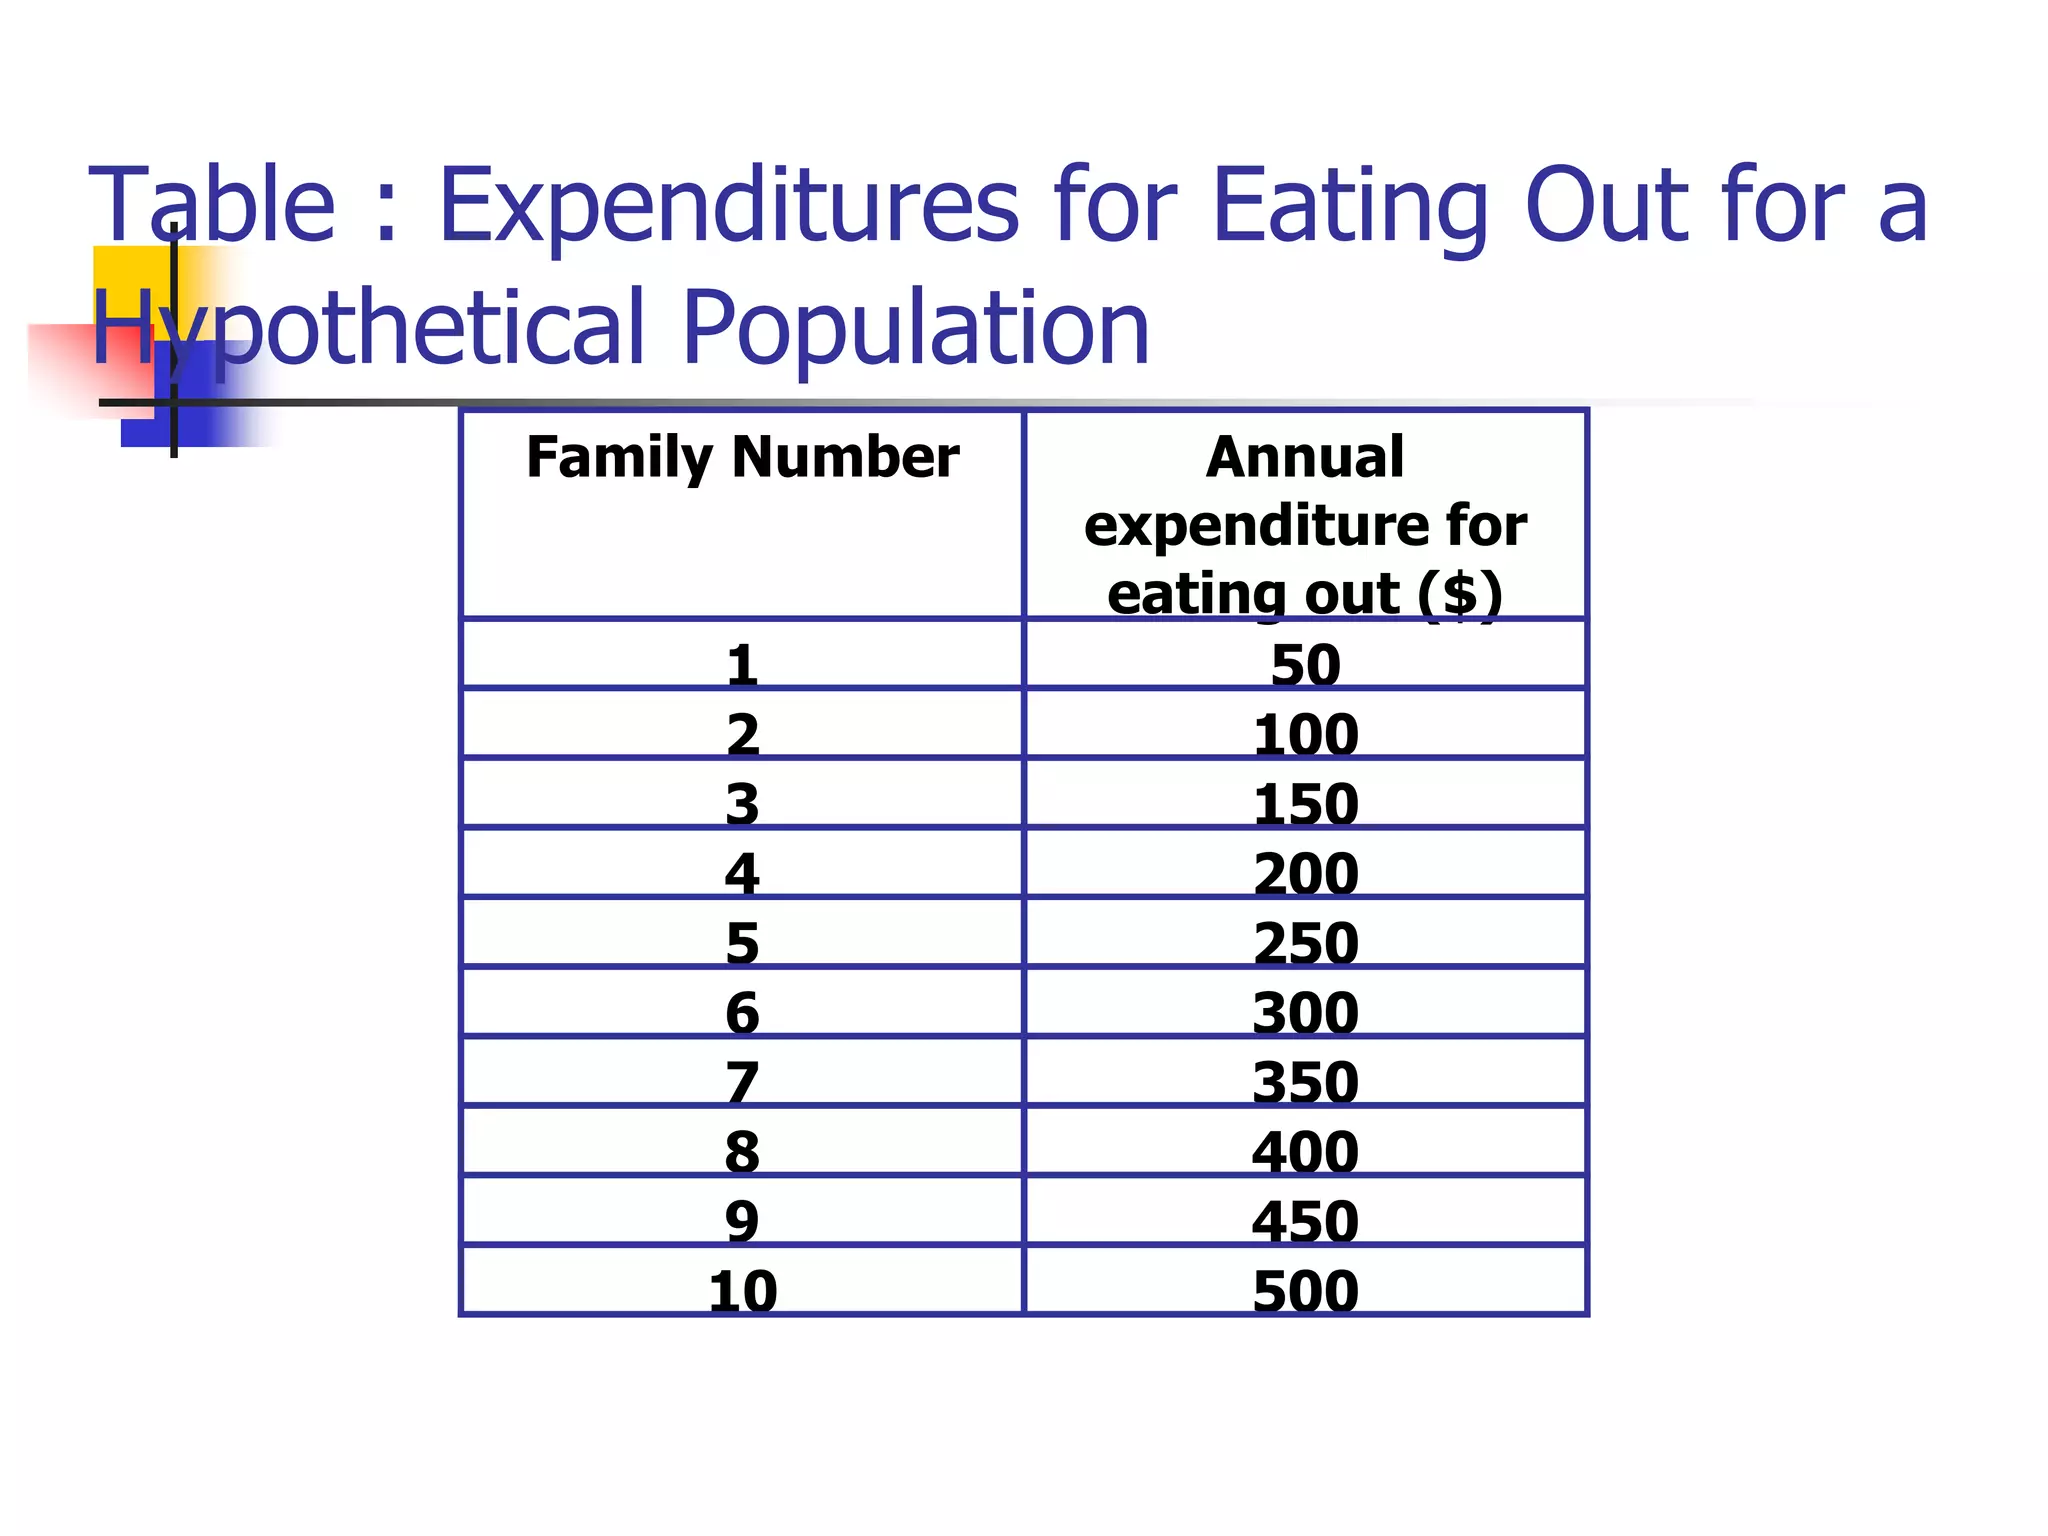
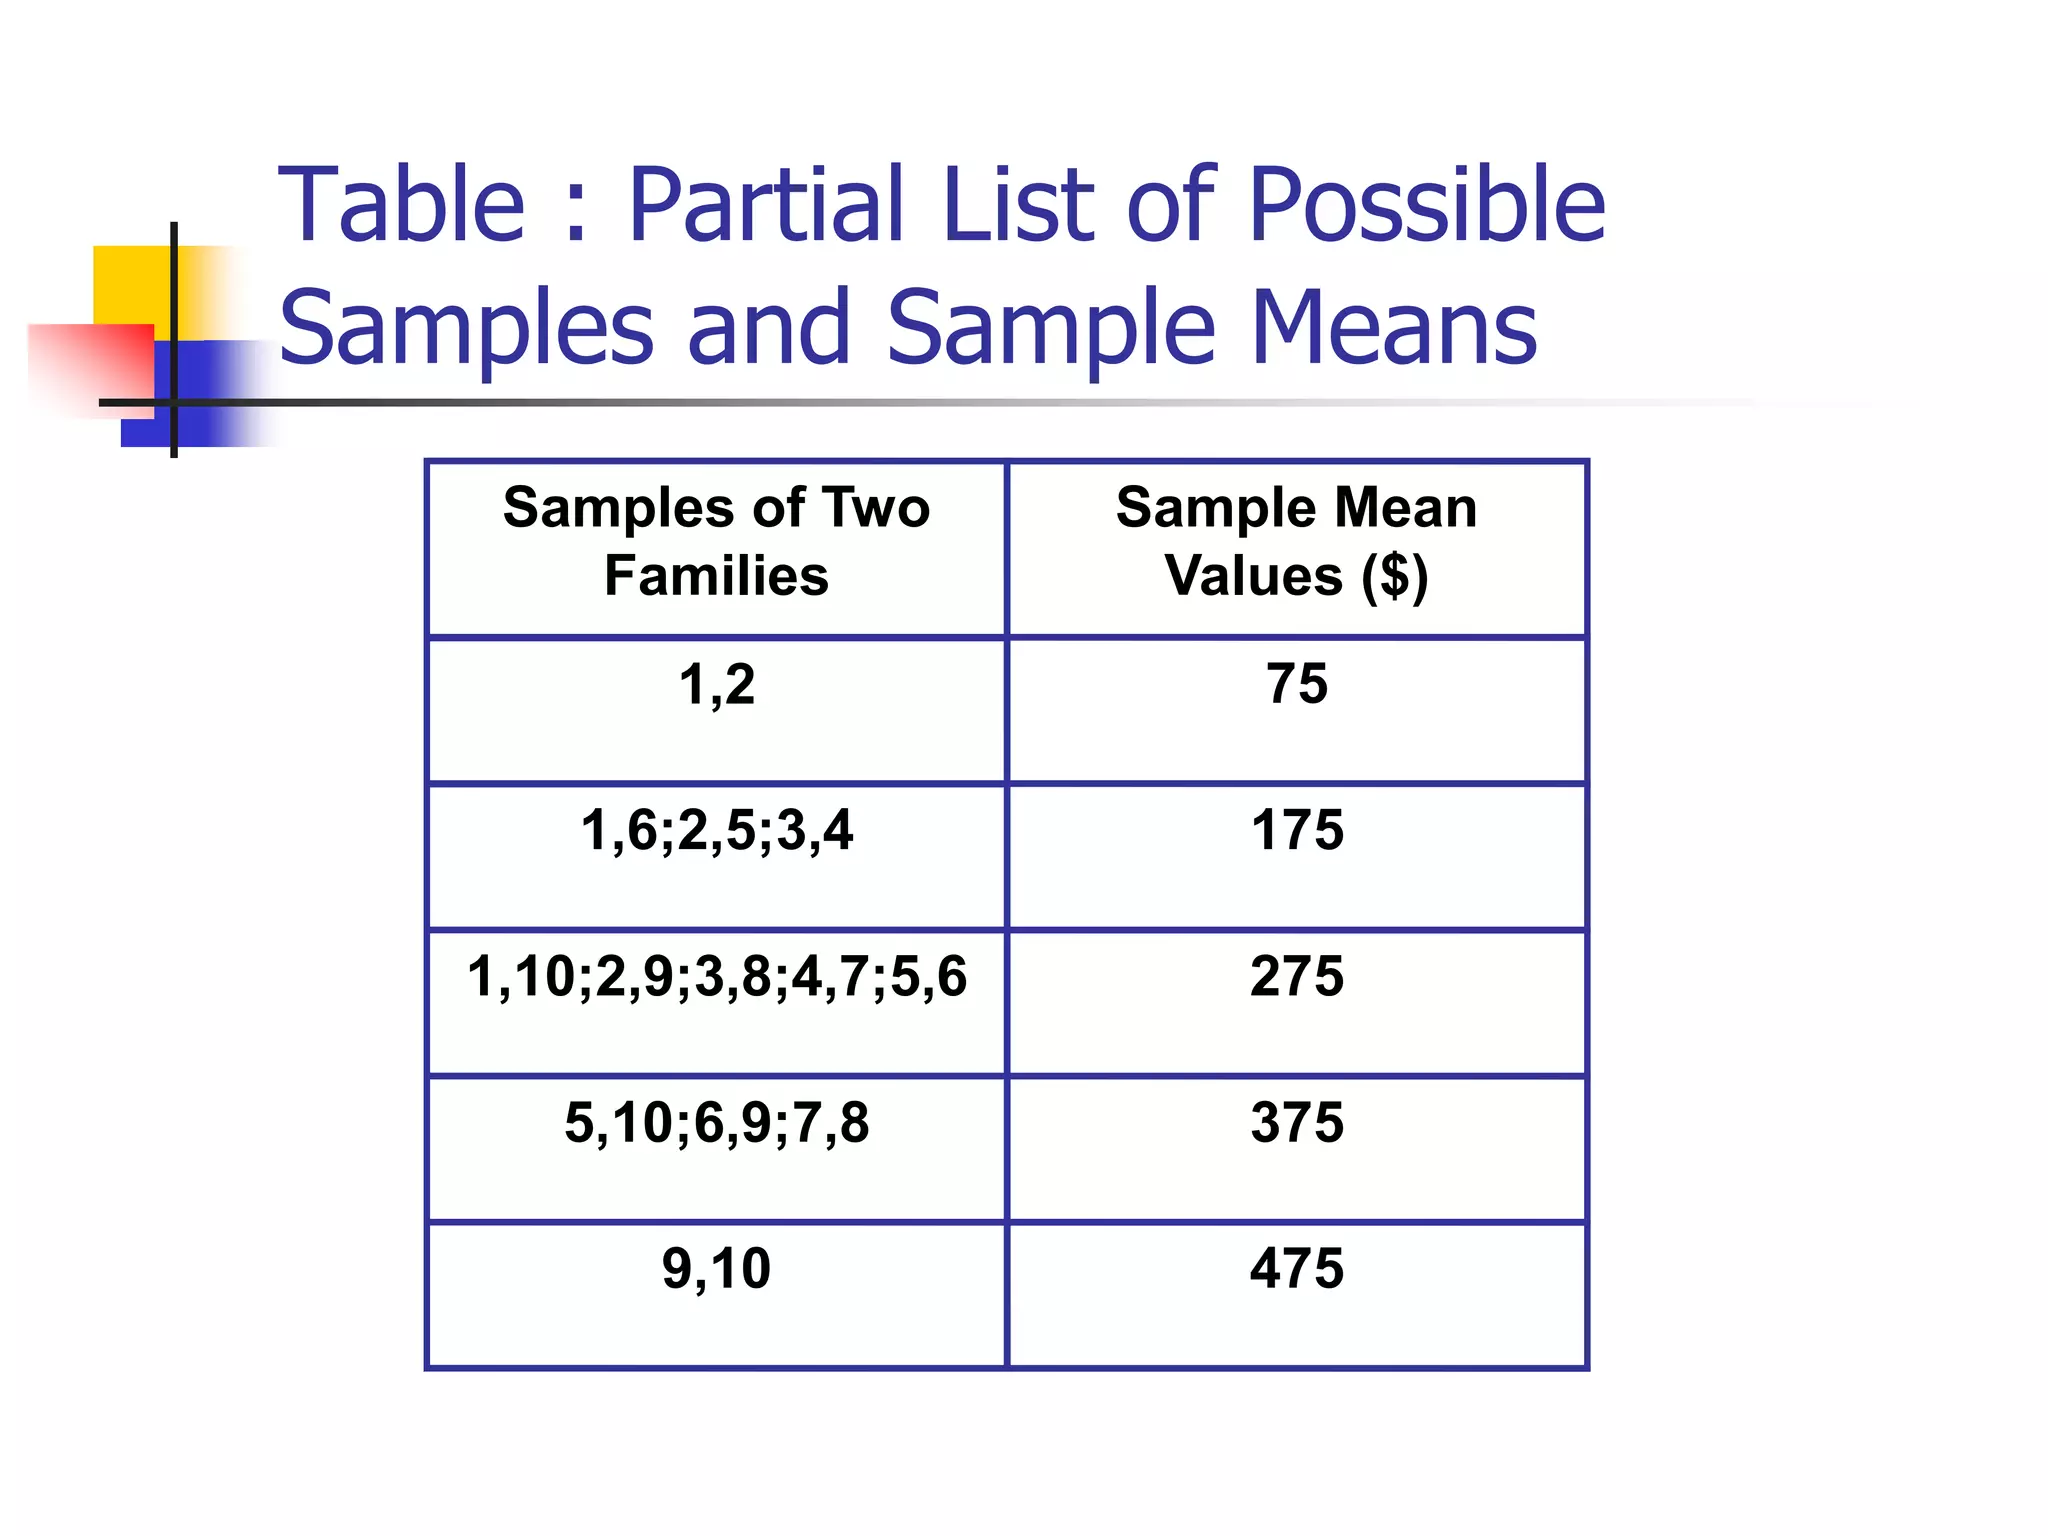
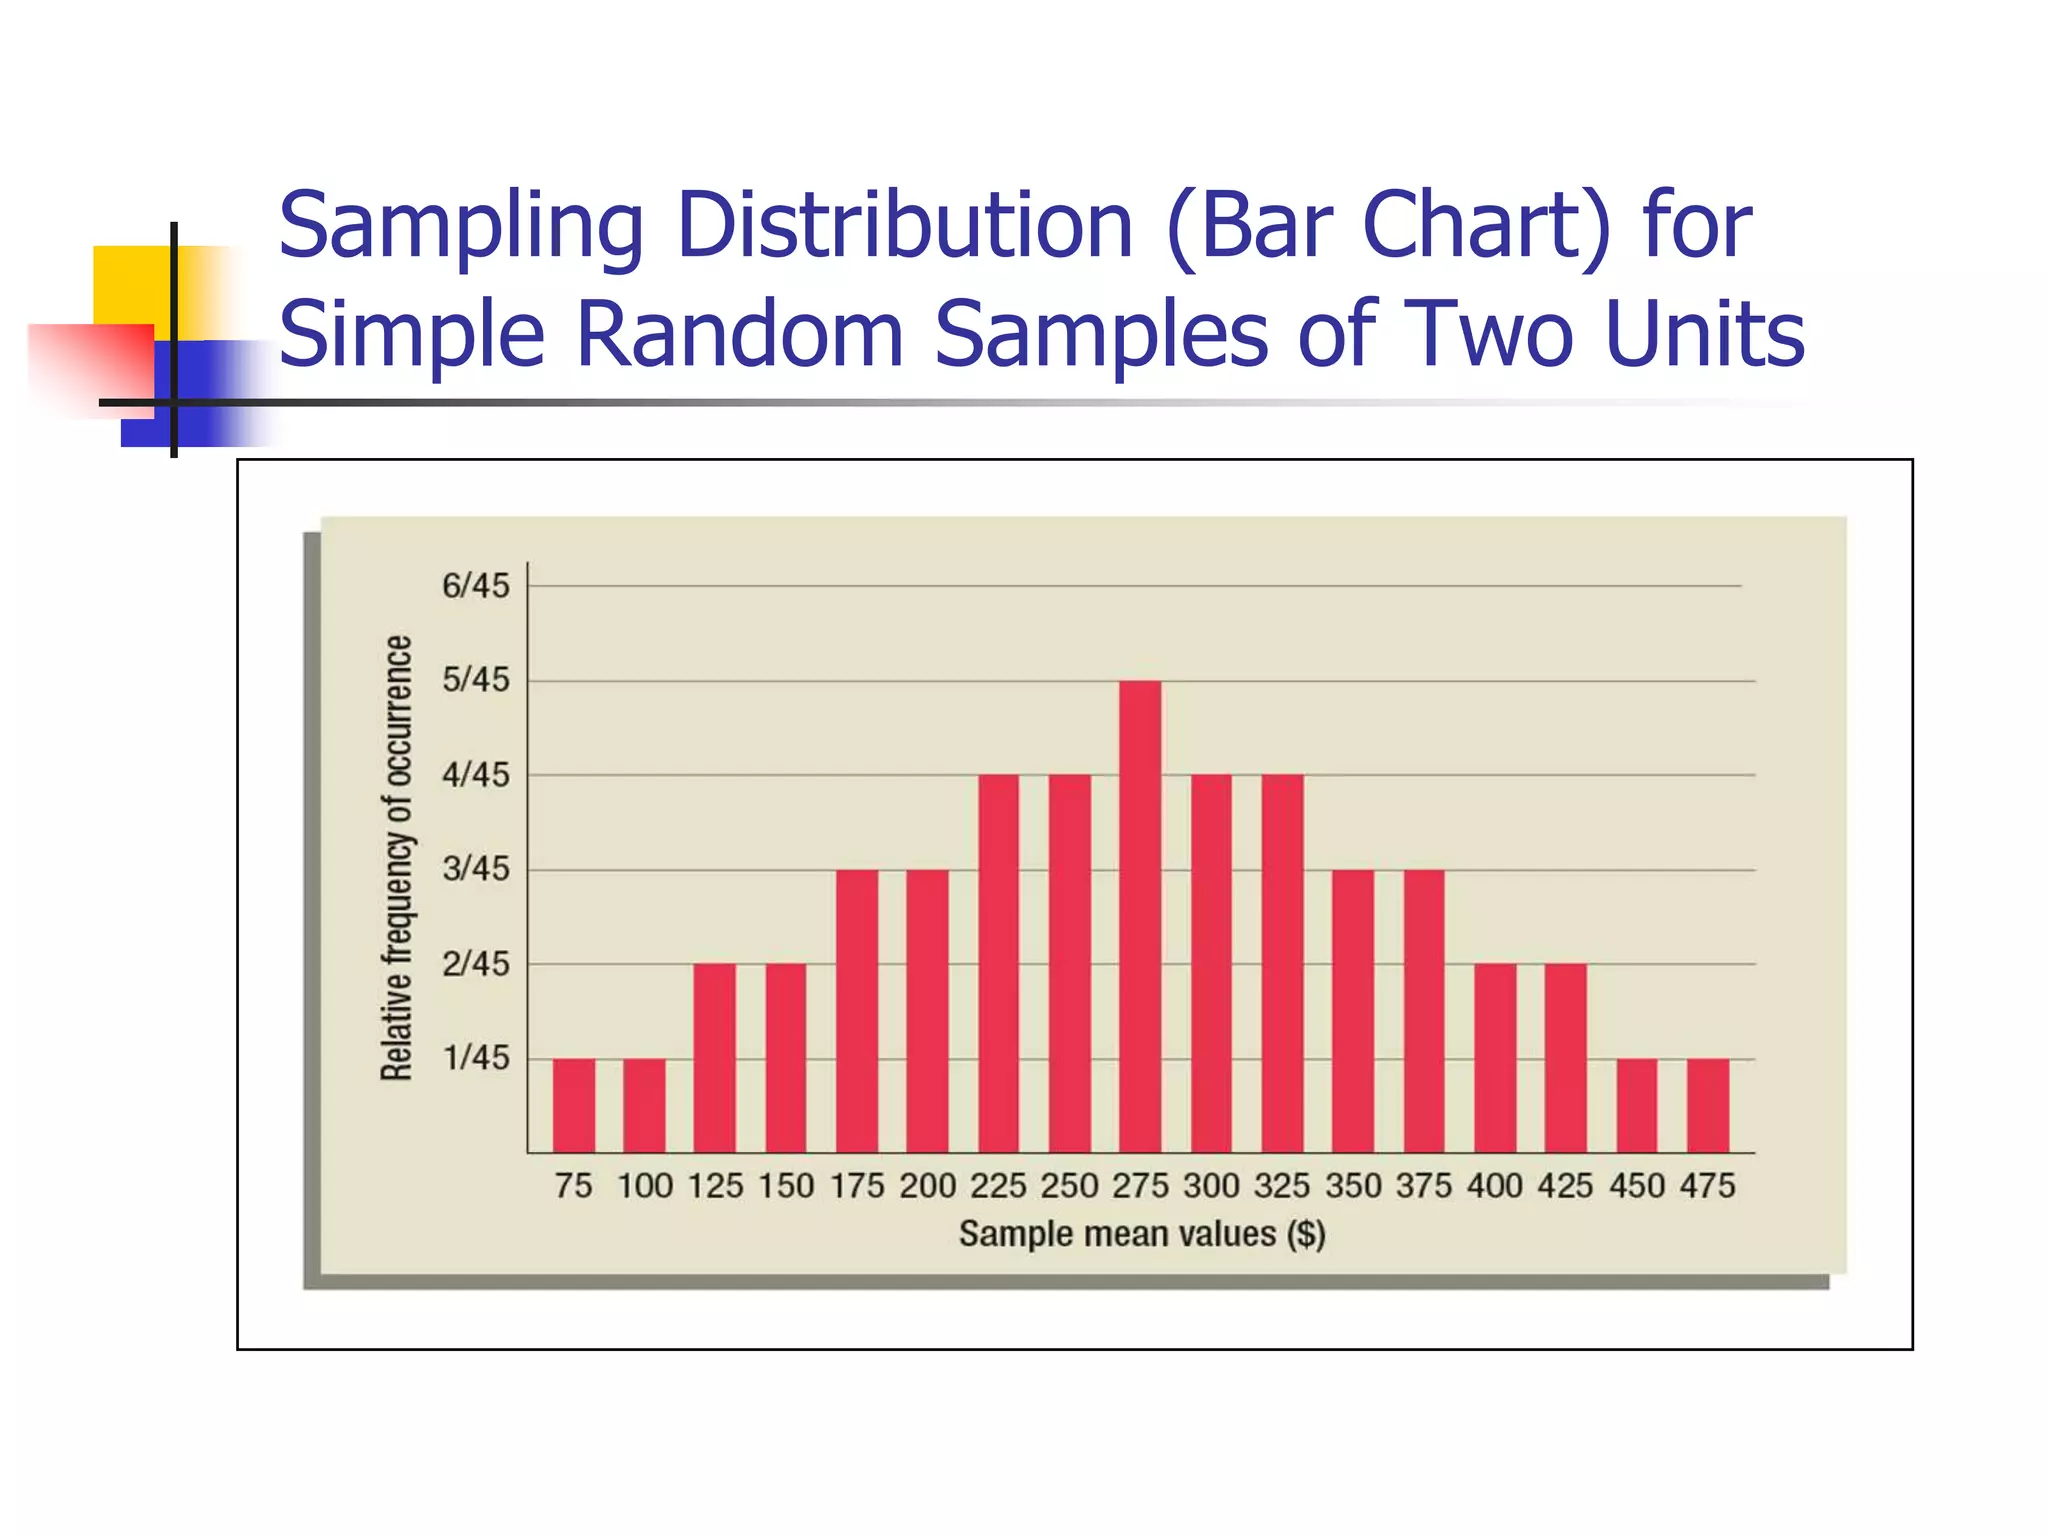
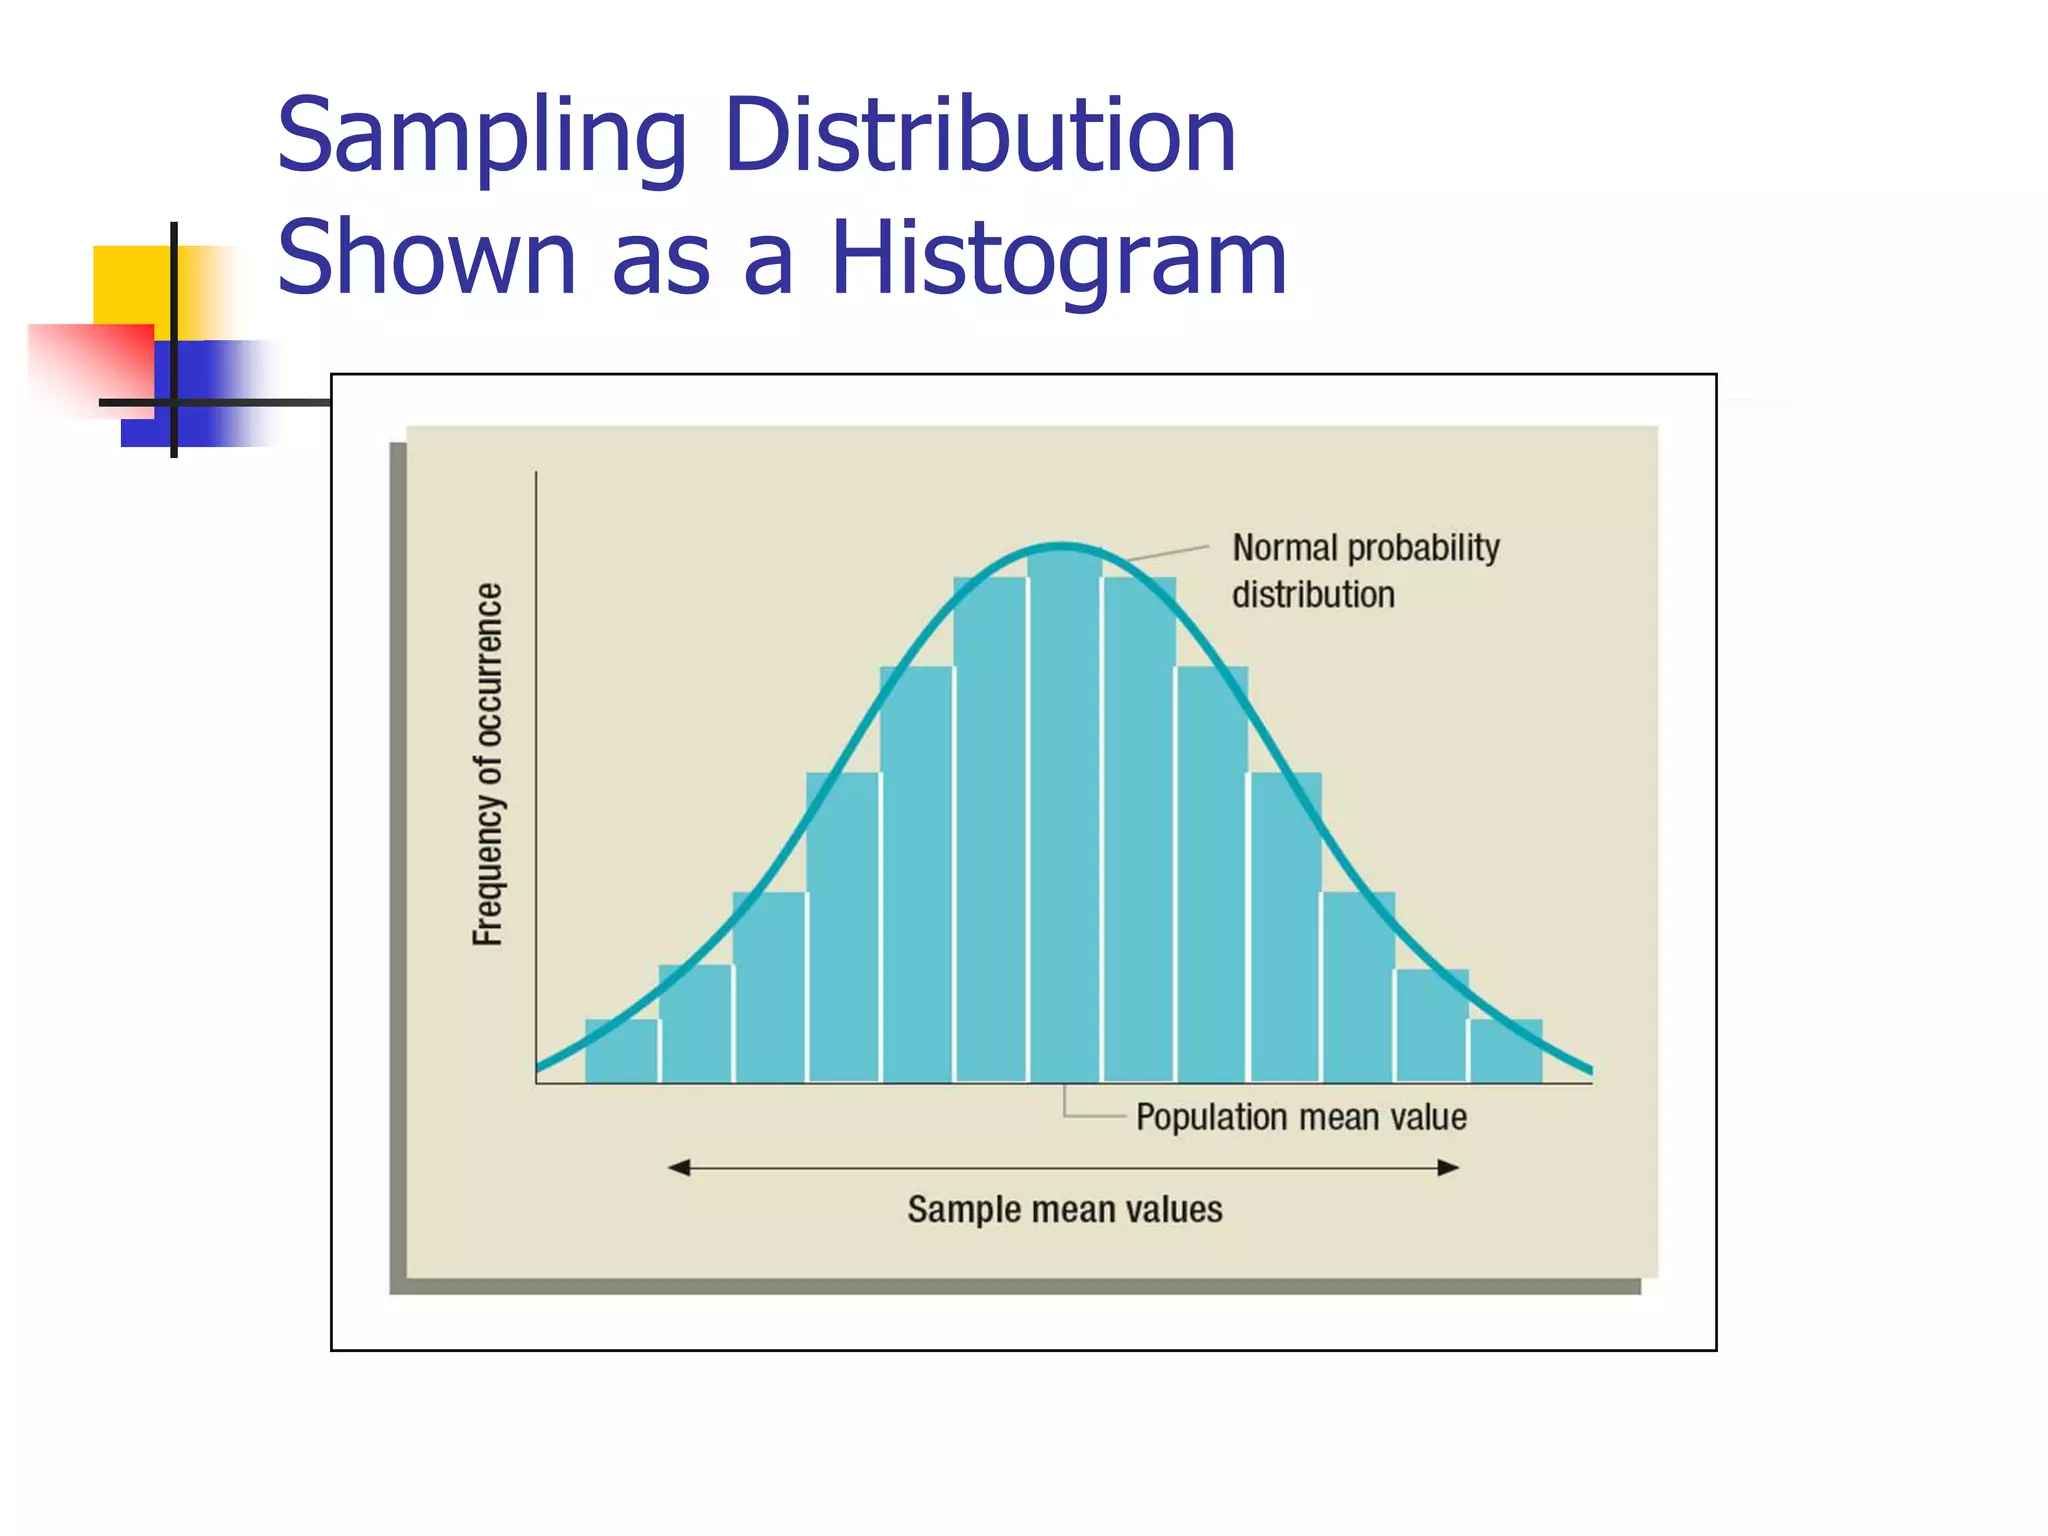
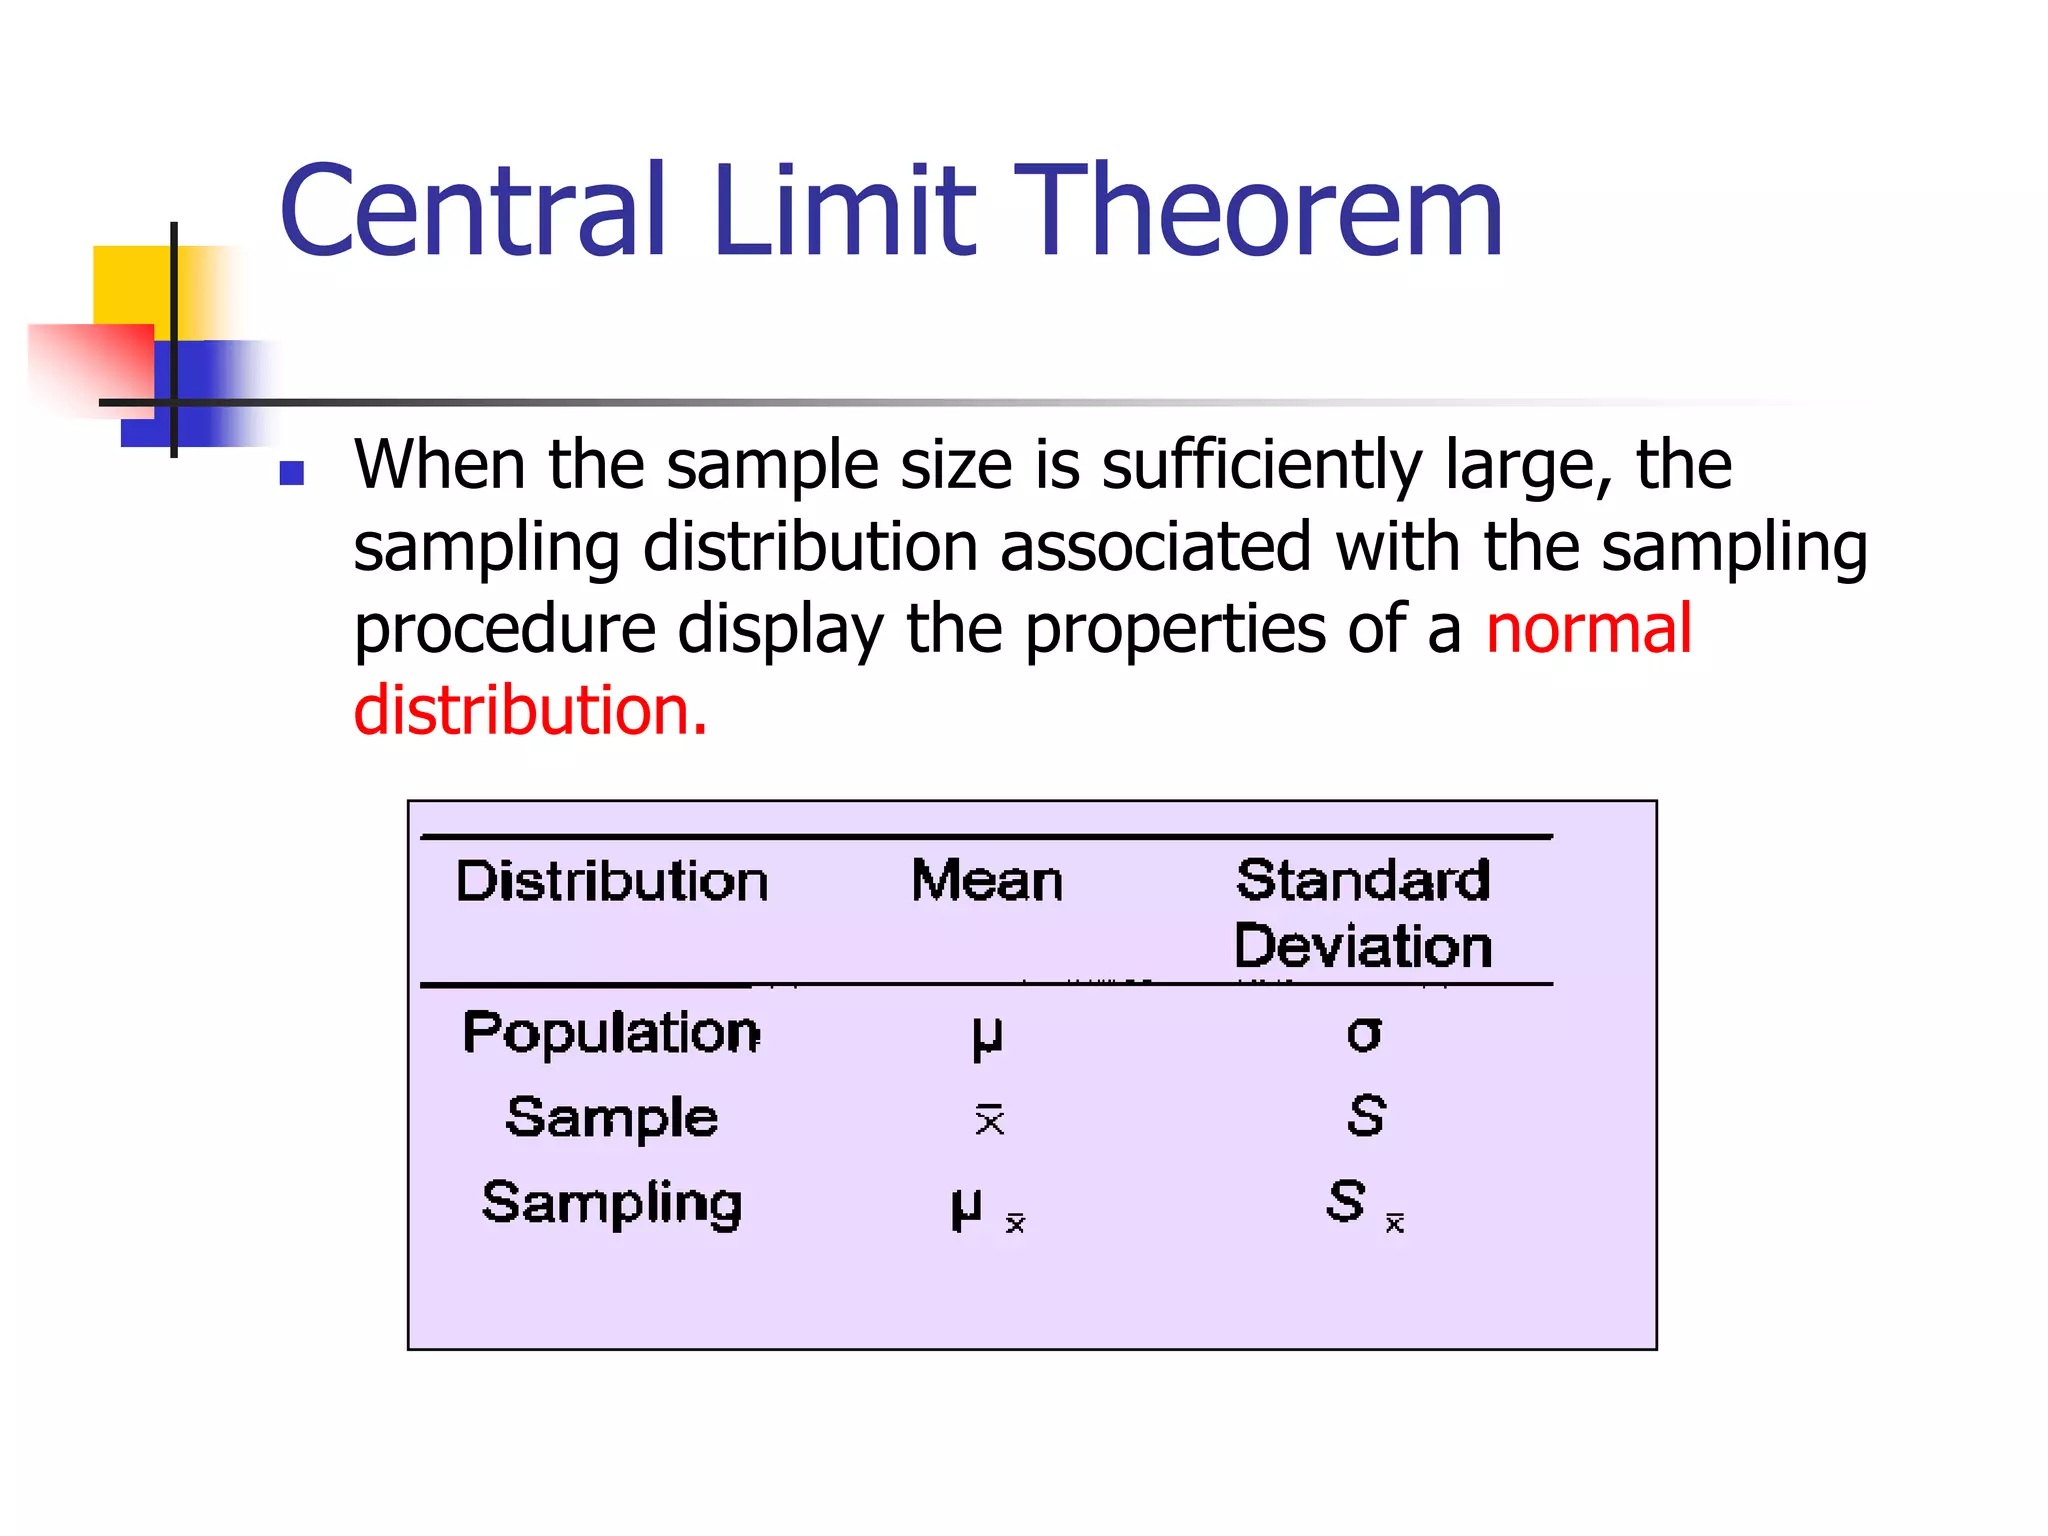
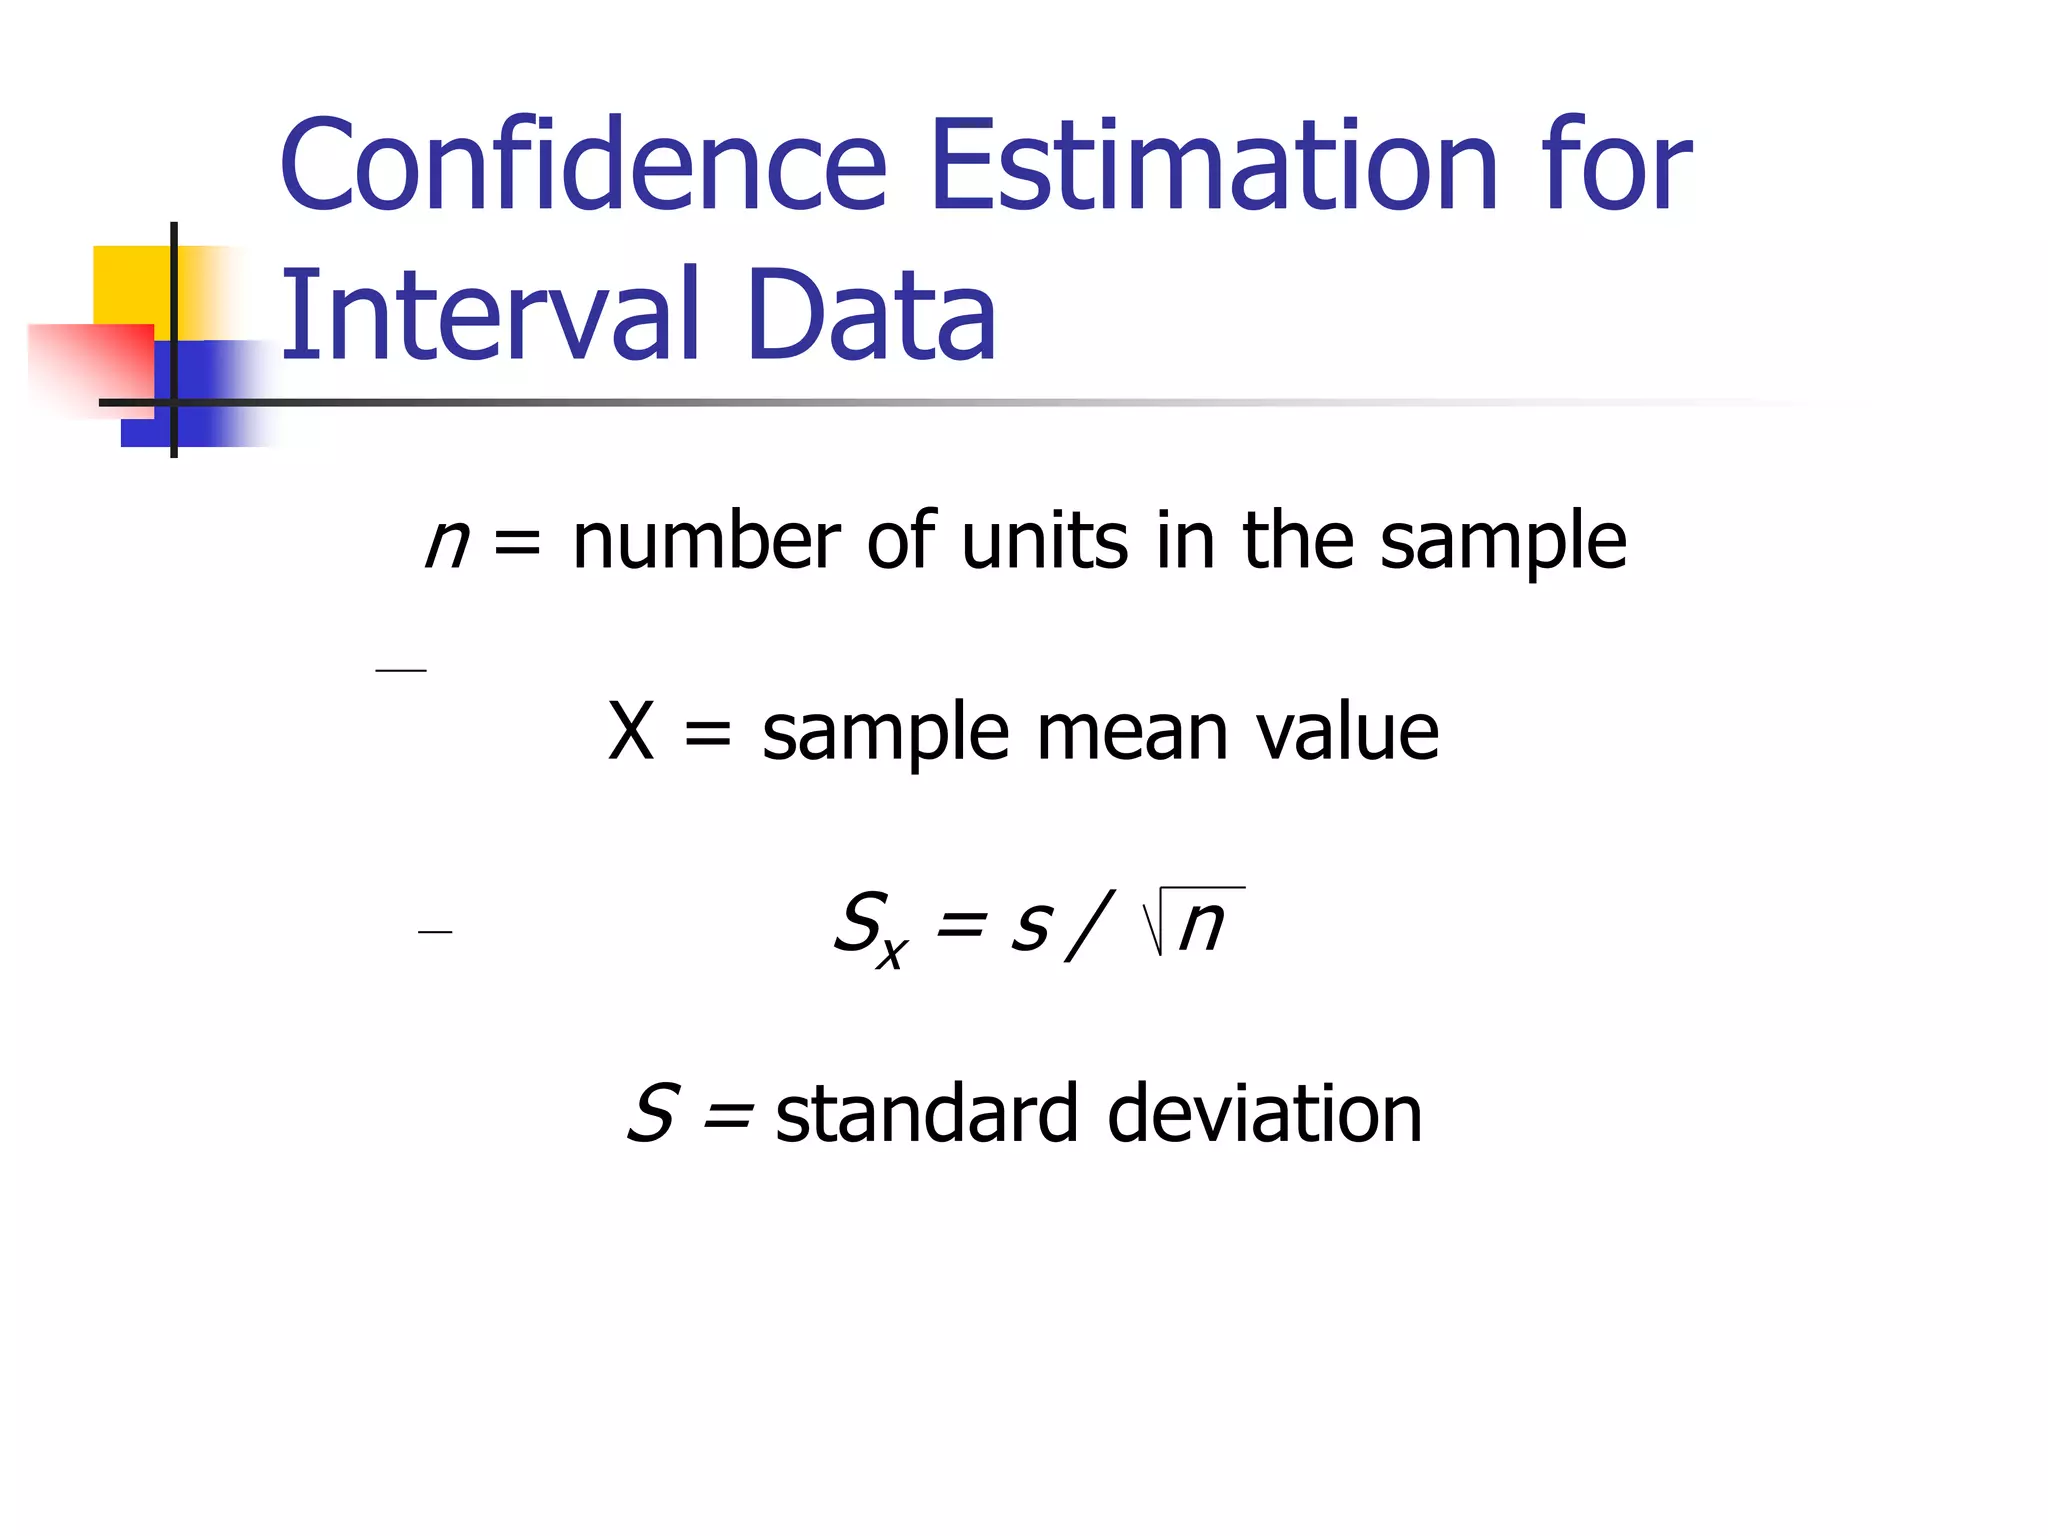
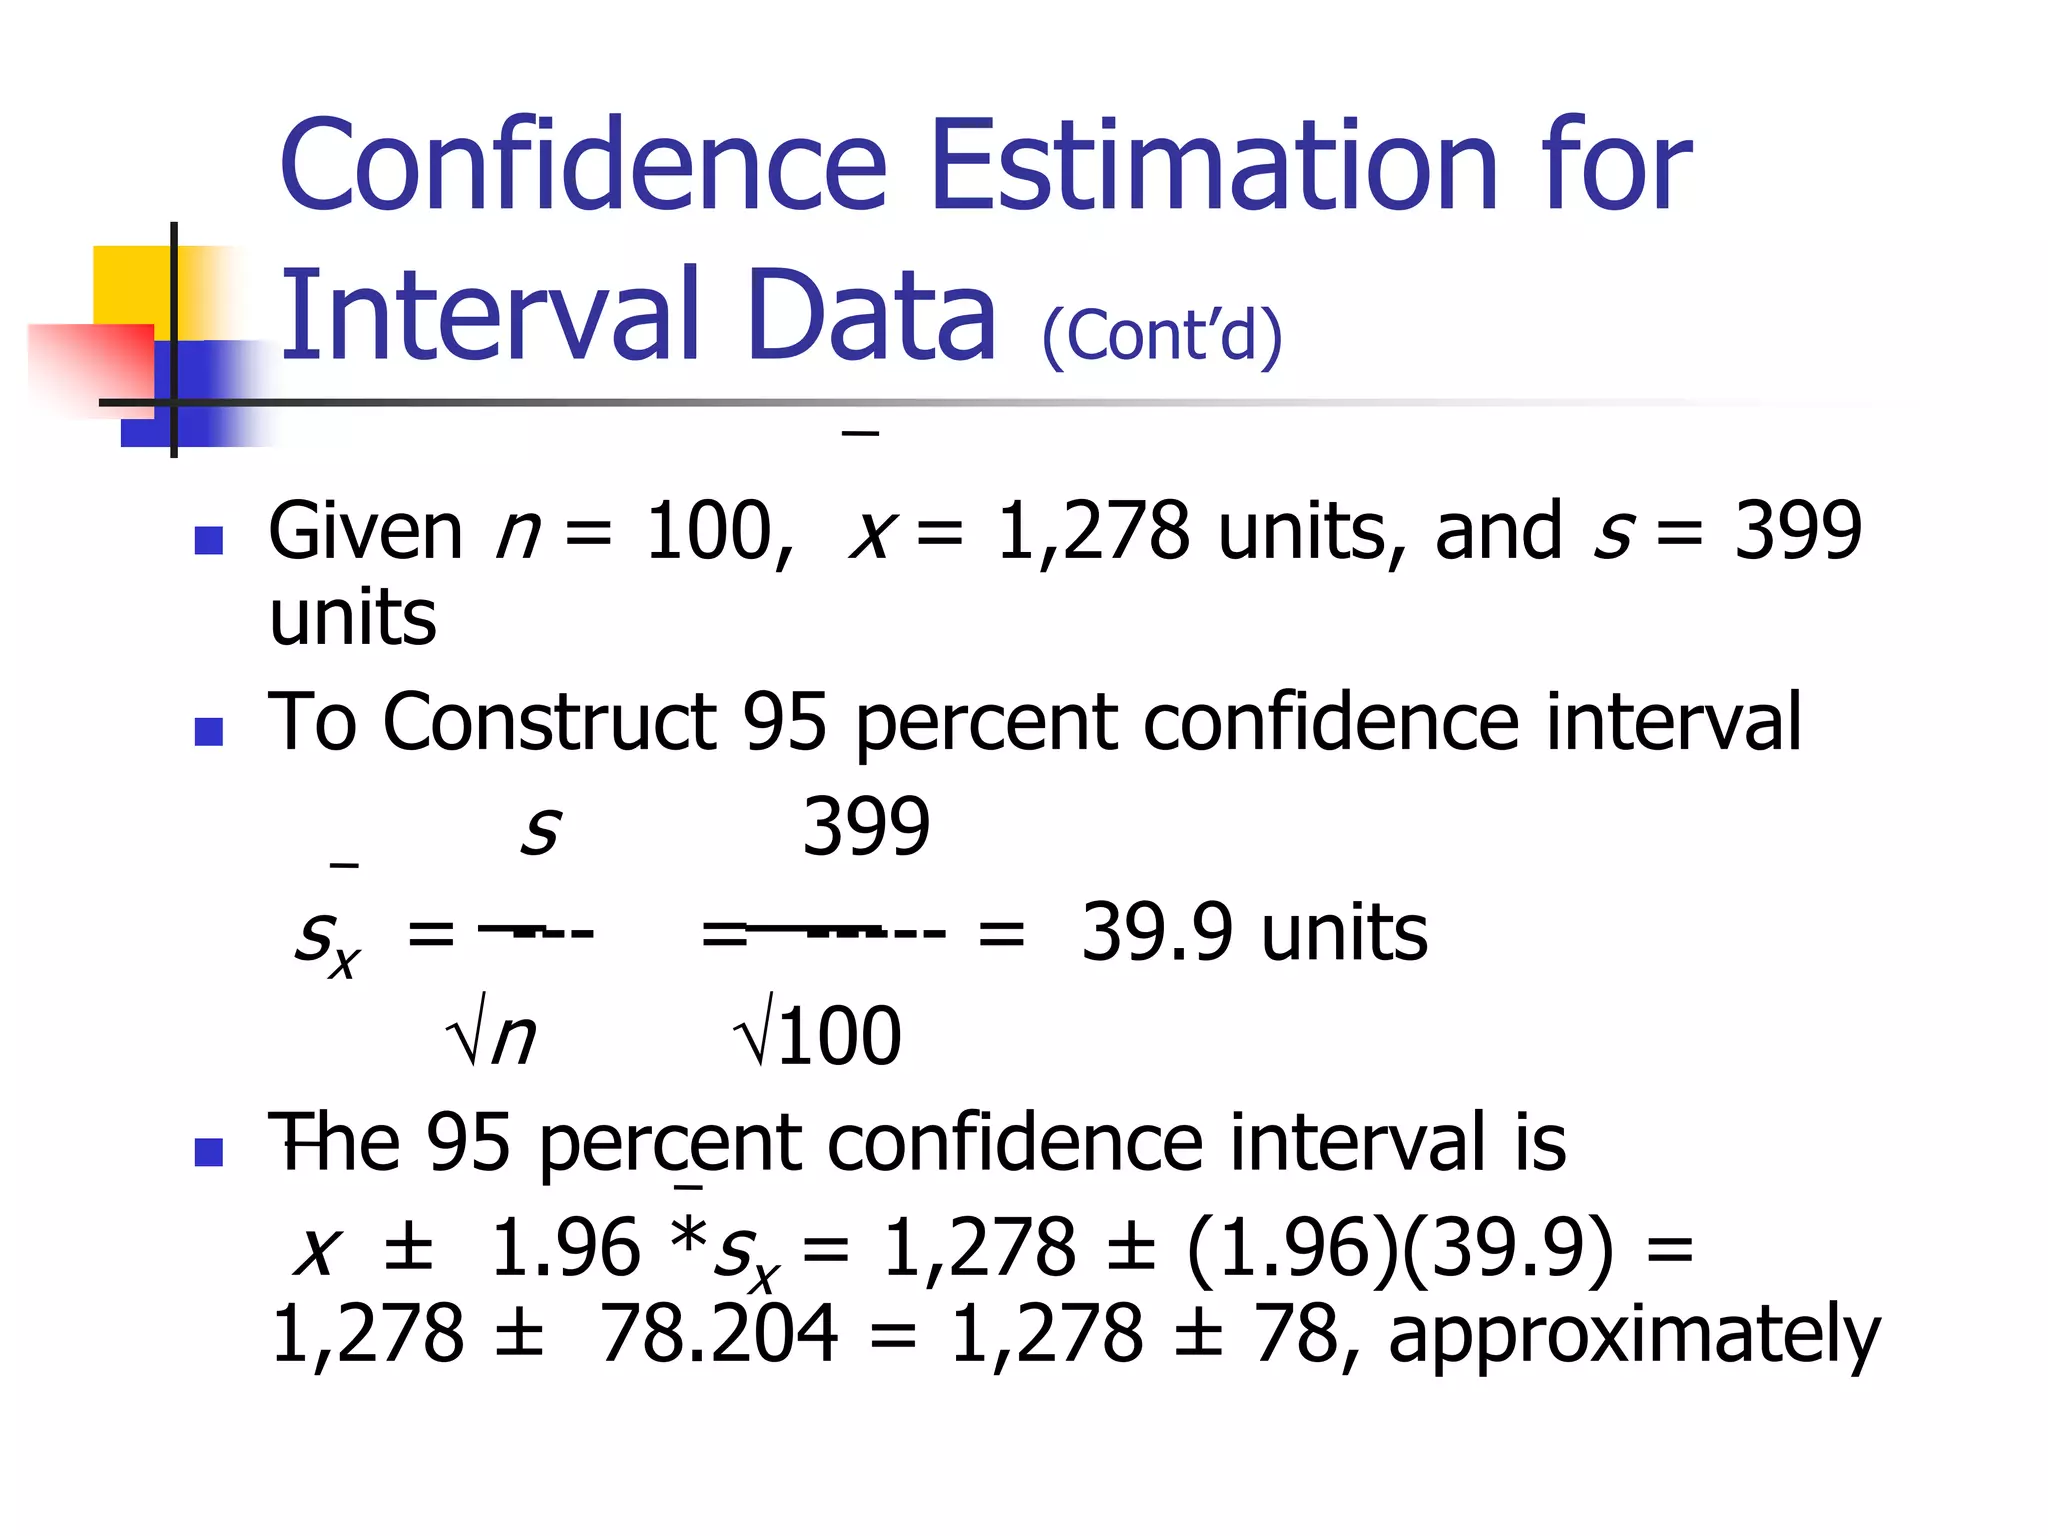
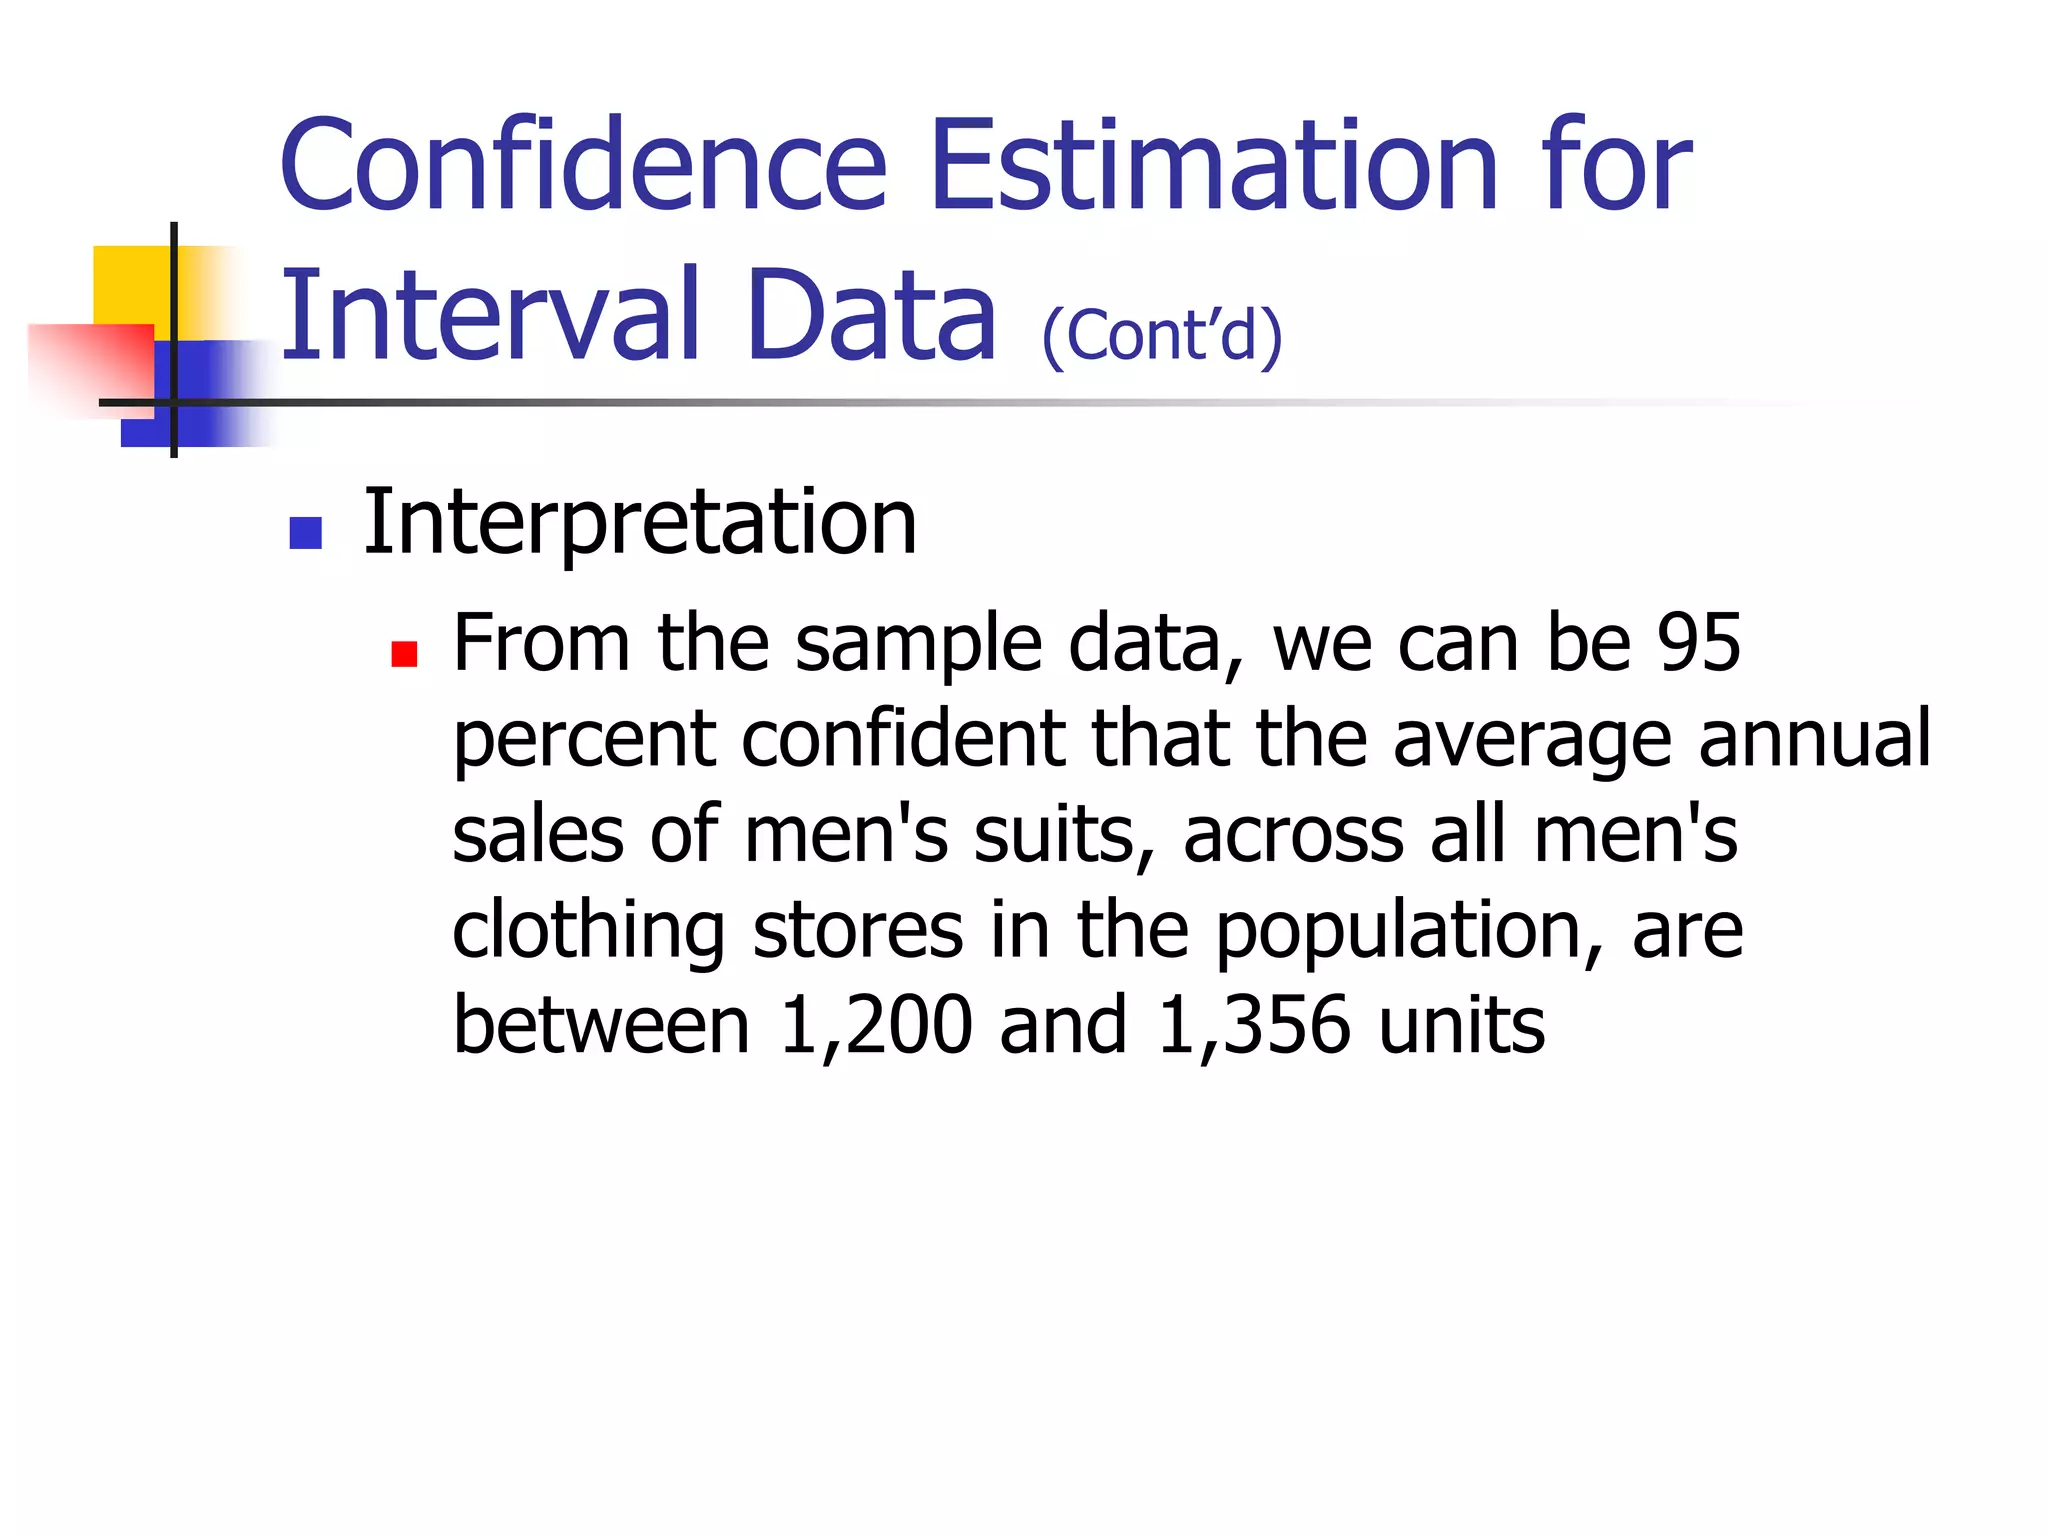
Analysis and
Interpretation of Data
Sampling Distribution
 Representation of the sample statistic
values obtained from every conceivable
sample of a certain size chosen from a
population by using a specified
sampling procedure along with the
relative frequency of occurrence of
those statistic values
µX SX

C
Sampling Distribution
500
10
450
9
400
8
350
7
300
6
250
5
200
4
150
3
100
2
50
1
Annual
expenditure for
eating out ($)
Family Number
Table : Expenditures for Eating Out for a
Hypothetical Population
475
9,10
375
5,10;6,9;7,8
275
1,10;2,9;3,8;4,7;5,6
175
1,6;2,5;3,4
75
1,2
Sample Mean
Values ($)
Samples of Two
Families
Table : Partial List of Possible
Samples and Sample Means
Sampling Distribution (Bar Chart) for
Simple Random Samples of Two Units
Sampling Distribution
Shown as a Histogram
Central Limit Theorem
 When the sample size is sufficiently large, the
sampling distribution associated with the sampling
procedure display the properties of a normal
distribution.
Confidence Estimation for
Interval Data
n = number of units in the sample
X = sample mean value
Sx = s / n
S = standard deviation
 Given n = 100, x = 1,278 units, and s = 399
units
 To Construct 95 percent confidence interval
s 399
sx = --- = ----- = 39.9 units
n 100
 The 95 percent confidence interval is
x ± 1.96 *sx = 1,278 ± (1.96)(39.9) =
1,278 ± 78.204 = 1,278 ± 78, approximately
Confidence Estimation for
Interval Data (Cont’d)
Confidence Estimation for
Interval Data (Cont’d)
 Interpretation
 From the sample data, we can be 95
percent confident that the average annual
sales of men's suits, across all men's
clothing stores in the population, are
between 1,200 and 1,356 units
Thank You

Lecture -9(Analysis and Interpretation of Data).ppt