SlideShare a Scribd company logo
1 of 18
Audit Report Cycle 
Time Duration Study 
Process Monitoring - Pharmaceuticals 5629 (101) – Fall 2013 
Neil Norton, Chuck Kemmerer, Karen Otrupchak
Objectives 
• To identify potential root cause for 
Audit to Final Audit Report cycle 
time to approach the 42-day limit 
• To identify sources of variation 
• To determine potential actions to 
create fixes - reduce cycle time
Process Flow 
Open audit Template 
Document audit from notes and observations 
Route report to management/audit team for 
review and comment 
Edit report adding comment and corrections 
requested 
Print, sign, and scan report 
Post report and observations into Audit tracking 
Issue report to supplier
Inputs and Outputs 
Inputs (X’s) 
• Responsibility: Auditing Group/Department 
• Audit Date: Date the audit started 
• Lead Auditor: Code letters given for each lead auditor 
• Audit Team Size: Number of team members 
• Observations: Numbers of Critical, Major, and Minor 
observations found 
• Supplier Type: Type of facility being audited (API, Commodity, 
Device, lab, etc.) 
• Change Control: Routine vs. non-Routine 
• Audit Process: “Stage” of the Process. (process 
changed/streamlined for Routine Audits April2013 
• Audit Duration: Number of days spent at a site 
• Report Issue Date: Date final report was issued 
Output (Y) 
• Report Cycle Time: Time from Audit start date to Report Issued 
(Limits - be less than 42 days)
Data Collected* 
Audit 
Responsibility 
Lead 
Auditor 
Audit 
Team 
Size 
Audit 
Date 
Audit 
Duratio 
n 
(days) 
Report 
Issue 
Date 
Report 
Cycle 
Time 
(Days) 
Critical 
Obs 
Major 
Obs 
Minor 
Obs 
Supplier 
TYPE 
* Data compiled from 105 audits over a duration of 12 months 
Change 
Control 
History 
Global Audit EU B 1 09/05/12 2 09/21/12 16 0 0 3 API Routine 
Global Audit 
09/11/12 
EXC 
Americas E 1 
1 10/08/12 27 0 2 4 
Routine 
Global Audit 
Americas E 2 
09/12/12 
2 10/03/12 21 0 0 0 
Lab 
Routine 
Global Audit EU B 3 09/18/12 1 09/27/12 9 0 6 8 TPM Routine 
Global Audit EU D 7 09/19/12 2 10/19/12 30 1 4 4 Device Routine 
Global Audit EU D 1 09/20/12 1 09/27/12 7 0 1 0 EXC Routine 
Global Audit 
09/20/12 
Device 
Americas A 1 
1 10/25/12 35 0 0 0 
Routine 
Global Audit 
Americas E 2 
09/26/12 
2 10/19/12 23 0 1 0 
TPM 
Routine 
Global Audit 
Americas G 3 
09/28/12 
2 10/30/12 32 0 4 4 
TPM 
Routine 
… 
… 
…
I-Chart - Report Cycle Times 
JMP 
Note: Special Test (6) - 4 
out of 5 points more than 
1 standard 
deviation from center line 
(on one side of CL) at 
points: 25, 27
Dot Plot – Report Cycle Times 
Minitab
Lead Auditor 
Pareto Plot 
110 
100 
90 
80 
70 
60 
50 
40 
30 
20 
10 
0 
Count 
E A B C D F G H J K L 
Lead Audi tor 
100 
90 
80 
70 
60 
50 
40 
30 
20 
10 
0 
Cum Percent 
Plots 
30 
25 
20 
15 
10 
5 
0 
Number of Audits 
20 
17 
16 
10 
26 
6 6 
1 1 1 1 
A B C D E F G H J K L 
Lead Audi tor 
Bar Chart 
JMP 
Note: Auditor E conducted 
the most number of audits
Lead Auditor (ANOVA) 
JMP 
Oneway Analysis of Report Cycle Time (Days) By Lead Auditor 
45 
40 
35 
30 
25 
20 
15 
10 
5 
0 
Report Cycle 
Time (Days) 
A B C D E F GHJKL 
Lead Audi tor 
Oneway Anova 
Rsquare 
Adj Rsquare 
Root Mean Square Erro r 
Mean of Response 
Observations (o r Sum Wgts) 
0.372156 
0.305364 
8.098001 
21.19048 
105 
Summary of Fit 
Source 
Lead Audi tor 
Error 
C. Total 
DF 
10 
94 
104 
Sum of 
Squares 
3653.8941 
6164.2964 
9818.1905 
Mean Square 
365.389 
65.578 
F Ratio 
5.5719 
Prob > F 
<.0001* 
Analysis of Variance 
Means for Oneway Anova 
Note: Auditor E had the 
shortest overall mean turn 
around time for report
Bar Chart: Counts of total 
observations 
Minitab
Total Observations (ANOVA) 
Minitab 
One-way ANOVA: Report Cycle Time (Days) versus Total Observations 
Source DF SS MS F P 
Total Observations 14 1246.7 89.1 0.94 0.525 
Error 90 8571.5 95.2 
Total 104 9818.2 
S = 9.759 R-Sq = 12.70% R-Sq(adj) = 0.00%
Change in Process 
Open audit Template 
Open audit Template 
Routine 
Audit? 
Document audit from notes and observations 
Routine audit report 
template 
Non-Routine audit 
report template 
Route report to management/audit team for 
review and comment 
Document audit from notes and observations
Change in Process 
Minitab
2-Sample t-test by audit stage 
Two-Sample T-Test and CI: Report Cycle Time (Days), Audit Process 
Two-sample T for Report Cycle Time (Days) 
Audit 
Process N Mean StDev SE Mean 
1 35 23.5 10.7 1.8 
2 40 20.15 9.05 1.4 
Difference = mu (1) - mu (2) 
Estimate for difference: 3.34 
95% CI for difference: (-1.26, 7.93) 
T-Test of difference = 0 (vs not =): T-Value = 1.45 
P-Value = 0.152 DF = 67 
Based on this data, the change in routine audits had no 
statistically significant effect
Initial IVP: Cycle time vs. Audit 
Responsibility
Audit Responsibility- After Process 
Change 
Minitab 
Note: one “outlier” 
removed from 
Global Audit Americas
Routine Audit Report Cycle Time 
Comparison of Data- Audit Responsibility after change 
Audit 
Responsibilit 
y 
# of Audits Mean 
Cycle Time 
(days) 
Std. Dev SE Mean 
Americas 21 15.71 7.85 1.7 
PAA 5 19.20 7.33 2.0 
EU 14 27.19 6.34 2.8 
T-Test Results 
Comparison DF P-Value Stat. Sig. 
Diff 
Americas 
vs. EU 
29 0.000 YES 
Americas 
vs. PAA 
7 0.328 NO 
EU vs. PAA 8 0.050 YES
Conclusions 
 Auditor E has conducted the most audits and has 
the lowest average turn-around time 
 There was no factor that could be linked to high 
cycle time 
 Initial analysis of the change in audit process 
didn’t appear to show any statistically significant 
change in cycle time 
 Further analysis showed that certain groups 
weren’t following the process change. 
 There was a statistically significant improvement 
in cycle time for those groups using the new form 
versus those that weren’t

More Related Content

Viewers also liked

Mail Merge_Parakramesh Jaroli_Pacific University
Mail Merge_Parakramesh Jaroli_Pacific UniversityMail Merge_Parakramesh Jaroli_Pacific University
Mail Merge_Parakramesh Jaroli_Pacific UniversityParakramesh Jaroli
 
Human Resource Management_Parakramesh Jaroli_MBA_HR
Human Resource Management_Parakramesh Jaroli_MBA_HRHuman Resource Management_Parakramesh Jaroli_MBA_HR
Human Resource Management_Parakramesh Jaroli_MBA_HRParakramesh Jaroli
 
Internship ppt_Parakramesh Jaroli
Internship ppt_Parakramesh JaroliInternship ppt_Parakramesh Jaroli
Internship ppt_Parakramesh JaroliParakramesh Jaroli
 
Business Story_Parakramesh Jaroli_Pacific University
Business Story_Parakramesh Jaroli_Pacific UniversityBusiness Story_Parakramesh Jaroli_Pacific University
Business Story_Parakramesh Jaroli_Pacific UniversityParakramesh Jaroli
 
Training & Development_Parakramesh Jaroli_MBA_Human Resource Management
Training & Development_Parakramesh Jaroli_MBA_Human Resource ManagementTraining & Development_Parakramesh Jaroli_MBA_Human Resource Management
Training & Development_Parakramesh Jaroli_MBA_Human Resource ManagementParakramesh Jaroli
 
Polymorphism of agile project and program managers role in agile
Polymorphism of agile project and program managers role in agilePolymorphism of agile project and program managers role in agile
Polymorphism of agile project and program managers role in agileJeyaprakash Rajaram (JP)
 
Imperatives of Tools and Engineering Practices
Imperatives of Tools and Engineering PracticesImperatives of Tools and Engineering Practices
Imperatives of Tools and Engineering PracticesJeyaprakash Rajaram (JP)
 
Times of India, Britannia in Dilemma_Parakramesh Jaroli_Pacific University
Times of India, Britannia in Dilemma_Parakramesh Jaroli_Pacific UniversityTimes of India, Britannia in Dilemma_Parakramesh Jaroli_Pacific University
Times of India, Britannia in Dilemma_Parakramesh Jaroli_Pacific UniversityParakramesh Jaroli
 
Industrial Report on Indian IT Industry by Parakramesh Jaroli
Industrial Report on Indian IT Industry by Parakramesh JaroliIndustrial Report on Indian IT Industry by Parakramesh Jaroli
Industrial Report on Indian IT Industry by Parakramesh JaroliParakramesh Jaroli
 
Market Perfect Competition_MBA_Parakramesh Jaroli
Market Perfect Competition_MBA_Parakramesh JaroliMarket Perfect Competition_MBA_Parakramesh Jaroli
Market Perfect Competition_MBA_Parakramesh JaroliParakramesh Jaroli
 
Pivot Table & Chart_Parakramesh Jaroli_Pacific University
Pivot Table & Chart_Parakramesh Jaroli_Pacific UniversityPivot Table & Chart_Parakramesh Jaroli_Pacific University
Pivot Table & Chart_Parakramesh Jaroli_Pacific UniversityParakramesh Jaroli
 
Importance & Steps in Decision Making_Parakramesh Jaroli_Pacific University
Importance & Steps in Decision Making_Parakramesh Jaroli_Pacific UniversityImportance & Steps in Decision Making_Parakramesh Jaroli_Pacific University
Importance & Steps in Decision Making_Parakramesh Jaroli_Pacific UniversityParakramesh Jaroli
 
Polymorphism of Agile Project and Program Managers
Polymorphism of Agile Project and Program Managers Polymorphism of Agile Project and Program Managers
Polymorphism of Agile Project and Program Managers Jeyaprakash Rajaram (JP)
 
Giao an boi duong hoc sinh lop 8
Giao an boi duong hoc sinh lop 8Giao an boi duong hoc sinh lop 8
Giao an boi duong hoc sinh lop 8ngohien10479
 
Giao an day them 6(hien)
Giao an day them 6(hien)Giao an day them 6(hien)
Giao an day them 6(hien)ngohien10479
 
A Report on Indian Hotel Industry by Parakramesh Jaroli
A Report on Indian Hotel Industry by Parakramesh JaroliA Report on Indian Hotel Industry by Parakramesh Jaroli
A Report on Indian Hotel Industry by Parakramesh JaroliParakramesh Jaroli
 
Giao an 8 ky i (unit1 8)
Giao an 8 ky i (unit1   8)Giao an 8 ky i (unit1   8)
Giao an 8 ky i (unit1 8)ngohien10479
 
Bcpf 다문화 캠프
Bcpf 다문화 캠프Bcpf 다문화 캠프
Bcpf 다문화 캠프미소 최
 

Viewers also liked (19)

Mail Merge_Parakramesh Jaroli_Pacific University
Mail Merge_Parakramesh Jaroli_Pacific UniversityMail Merge_Parakramesh Jaroli_Pacific University
Mail Merge_Parakramesh Jaroli_Pacific University
 
Human Resource Management_Parakramesh Jaroli_MBA_HR
Human Resource Management_Parakramesh Jaroli_MBA_HRHuman Resource Management_Parakramesh Jaroli_MBA_HR
Human Resource Management_Parakramesh Jaroli_MBA_HR
 
Internship ppt_Parakramesh Jaroli
Internship ppt_Parakramesh JaroliInternship ppt_Parakramesh Jaroli
Internship ppt_Parakramesh Jaroli
 
Business Story_Parakramesh Jaroli_Pacific University
Business Story_Parakramesh Jaroli_Pacific UniversityBusiness Story_Parakramesh Jaroli_Pacific University
Business Story_Parakramesh Jaroli_Pacific University
 
Training & Development_Parakramesh Jaroli_MBA_Human Resource Management
Training & Development_Parakramesh Jaroli_MBA_Human Resource ManagementTraining & Development_Parakramesh Jaroli_MBA_Human Resource Management
Training & Development_Parakramesh Jaroli_MBA_Human Resource Management
 
Polymorphism of agile project and program managers role in agile
Polymorphism of agile project and program managers role in agilePolymorphism of agile project and program managers role in agile
Polymorphism of agile project and program managers role in agile
 
Imperatives of Tools and Engineering Practices
Imperatives of Tools and Engineering PracticesImperatives of Tools and Engineering Practices
Imperatives of Tools and Engineering Practices
 
Times of India, Britannia in Dilemma_Parakramesh Jaroli_Pacific University
Times of India, Britannia in Dilemma_Parakramesh Jaroli_Pacific UniversityTimes of India, Britannia in Dilemma_Parakramesh Jaroli_Pacific University
Times of India, Britannia in Dilemma_Parakramesh Jaroli_Pacific University
 
Industrial Report on Indian IT Industry by Parakramesh Jaroli
Industrial Report on Indian IT Industry by Parakramesh JaroliIndustrial Report on Indian IT Industry by Parakramesh Jaroli
Industrial Report on Indian IT Industry by Parakramesh Jaroli
 
Market Perfect Competition_MBA_Parakramesh Jaroli
Market Perfect Competition_MBA_Parakramesh JaroliMarket Perfect Competition_MBA_Parakramesh Jaroli
Market Perfect Competition_MBA_Parakramesh Jaroli
 
Pivot Table & Chart_Parakramesh Jaroli_Pacific University
Pivot Table & Chart_Parakramesh Jaroli_Pacific UniversityPivot Table & Chart_Parakramesh Jaroli_Pacific University
Pivot Table & Chart_Parakramesh Jaroli_Pacific University
 
Importance & Steps in Decision Making_Parakramesh Jaroli_Pacific University
Importance & Steps in Decision Making_Parakramesh Jaroli_Pacific UniversityImportance & Steps in Decision Making_Parakramesh Jaroli_Pacific University
Importance & Steps in Decision Making_Parakramesh Jaroli_Pacific University
 
Polymorphism of Agile Project and Program Managers
Polymorphism of Agile Project and Program Managers Polymorphism of Agile Project and Program Managers
Polymorphism of Agile Project and Program Managers
 
Giao an boi duong hoc sinh lop 8
Giao an boi duong hoc sinh lop 8Giao an boi duong hoc sinh lop 8
Giao an boi duong hoc sinh lop 8
 
Giao an day them 6(hien)
Giao an day them 6(hien)Giao an day them 6(hien)
Giao an day them 6(hien)
 
Giao an 8 ki ii
Giao an 8 ki iiGiao an 8 ki ii
Giao an 8 ki ii
 
A Report on Indian Hotel Industry by Parakramesh Jaroli
A Report on Indian Hotel Industry by Parakramesh JaroliA Report on Indian Hotel Industry by Parakramesh Jaroli
A Report on Indian Hotel Industry by Parakramesh Jaroli
 
Giao an 8 ky i (unit1 8)
Giao an 8 ky i (unit1   8)Giao an 8 ky i (unit1   8)
Giao an 8 ky i (unit1 8)
 
Bcpf 다문화 캠프
Bcpf 다문화 캠프Bcpf 다문화 캠프
Bcpf 다문화 캠프
 

Similar to Fall 2013 Process Monitoring group project

Analyze phase lean six sigma tollgate template
Analyze phase   lean six sigma tollgate templateAnalyze phase   lean six sigma tollgate template
Analyze phase lean six sigma tollgate templateSteven Bonacorsi
 
Analyze Phase Lean Six Sigma Tollgate Templates
Analyze Phase Lean Six Sigma Tollgate TemplatesAnalyze Phase Lean Six Sigma Tollgate Templates
Analyze Phase Lean Six Sigma Tollgate TemplatesSteven Bonacorsi
 
Test Metrics
Test MetricsTest Metrics
Test MetricsDevukjs
 
D03 15 Deliverable Roadmap
D03 15 Deliverable RoadmapD03 15 Deliverable Roadmap
D03 15 Deliverable RoadmapLeanleaders.org
 
D03 15 Deliverable Roadmap
D03 15 Deliverable RoadmapD03 15 Deliverable Roadmap
D03 15 Deliverable RoadmapLeanleaders.org
 
Lean6sigma Project Template
Lean6sigma Project TemplateLean6sigma Project Template
Lean6sigma Project TemplateTaco Bakker
 
Storyboard_SPS_Payroll
Storyboard_SPS_PayrollStoryboard_SPS_Payroll
Storyboard_SPS_PayrollBalaguru SP
 
Quality Management & ControlSeung-Kuk Paik, Ph.D.Systems a.docx
Quality Management & ControlSeung-Kuk Paik, Ph.D.Systems a.docxQuality Management & ControlSeung-Kuk Paik, Ph.D.Systems a.docx
Quality Management & ControlSeung-Kuk Paik, Ph.D.Systems a.docxmakdul
 
# 3 PPT - Expose Your Hidden Problems Using Visual Management
# 3 PPT - Expose Your Hidden Problems Using Visual Management# 3 PPT - Expose Your Hidden Problems Using Visual Management
# 3 PPT - Expose Your Hidden Problems Using Visual ManagementRhonda Kovera
 
Quality Management.ppt
Quality Management.pptQuality Management.ppt
Quality Management.pptddelucy
 
Kick-Off Meeting - WP6
Kick-Off Meeting - WP6Kick-Off Meeting - WP6
Kick-Off Meeting - WP6SLOPE Project
 
quality and performance
quality and performancequality and performance
quality and performanceMEHAK GHAI
 
Six sigma-in-measurement-systems-evaluating-the-hidden-factory (2)
Six sigma-in-measurement-systems-evaluating-the-hidden-factory (2)Six sigma-in-measurement-systems-evaluating-the-hidden-factory (2)
Six sigma-in-measurement-systems-evaluating-the-hidden-factory (2)Bibhuti Prasad Nanda
 
How I Improve and Manage a Production Area
How I Improve and Manage a Production AreaHow I Improve and Manage a Production Area
How I Improve and Manage a Production AreaStephen Sikorski
 
Lean six sigma executive overview (case study) templates
Lean six sigma executive overview (case study) templatesLean six sigma executive overview (case study) templates
Lean six sigma executive overview (case study) templatesSteven Bonacorsi
 
Om4 bbm(l) 25.03.11
Om4 bbm(l) 25.03.11Om4 bbm(l) 25.03.11
Om4 bbm(l) 25.03.11Rahul Jain
 
Identifying, Mitigating and Eliminating Risk with an Asset Management Strategy
Identifying, Mitigating and Eliminating Risk with an Asset Management StrategyIdentifying, Mitigating and Eliminating Risk with an Asset Management Strategy
Identifying, Mitigating and Eliminating Risk with an Asset Management StrategyMike Poland, CMRP
 
Six-Sigma-Green-belt.8169983.powerpoint.pptx
Six-Sigma-Green-belt.8169983.powerpoint.pptxSix-Sigma-Green-belt.8169983.powerpoint.pptx
Six-Sigma-Green-belt.8169983.powerpoint.pptxWFD02BLR13Outlet
 

Similar to Fall 2013 Process Monitoring group project (20)

Analyze phase lean six sigma tollgate template
Analyze phase   lean six sigma tollgate templateAnalyze phase   lean six sigma tollgate template
Analyze phase lean six sigma tollgate template
 
Analyze Phase Lean Six Sigma Tollgate Templates
Analyze Phase Lean Six Sigma Tollgate TemplatesAnalyze Phase Lean Six Sigma Tollgate Templates
Analyze Phase Lean Six Sigma Tollgate Templates
 
Testing Metrics
Testing MetricsTesting Metrics
Testing Metrics
 
Test Metrics
Test MetricsTest Metrics
Test Metrics
 
D03 15 Deliverable Roadmap
D03 15 Deliverable RoadmapD03 15 Deliverable Roadmap
D03 15 Deliverable Roadmap
 
D03 15 Deliverable Roadmap
D03 15 Deliverable RoadmapD03 15 Deliverable Roadmap
D03 15 Deliverable Roadmap
 
Lean6sigma Project Template
Lean6sigma Project TemplateLean6sigma Project Template
Lean6sigma Project Template
 
Storyboard_SPS_Payroll
Storyboard_SPS_PayrollStoryboard_SPS_Payroll
Storyboard_SPS_Payroll
 
Analyze_TUV.ppt
Analyze_TUV.pptAnalyze_TUV.ppt
Analyze_TUV.ppt
 
Quality Management & ControlSeung-Kuk Paik, Ph.D.Systems a.docx
Quality Management & ControlSeung-Kuk Paik, Ph.D.Systems a.docxQuality Management & ControlSeung-Kuk Paik, Ph.D.Systems a.docx
Quality Management & ControlSeung-Kuk Paik, Ph.D.Systems a.docx
 
# 3 PPT - Expose Your Hidden Problems Using Visual Management
# 3 PPT - Expose Your Hidden Problems Using Visual Management# 3 PPT - Expose Your Hidden Problems Using Visual Management
# 3 PPT - Expose Your Hidden Problems Using Visual Management
 
Quality Management.ppt
Quality Management.pptQuality Management.ppt
Quality Management.ppt
 
Kick-Off Meeting - WP6
Kick-Off Meeting - WP6Kick-Off Meeting - WP6
Kick-Off Meeting - WP6
 
quality and performance
quality and performancequality and performance
quality and performance
 
Six sigma-in-measurement-systems-evaluating-the-hidden-factory (2)
Six sigma-in-measurement-systems-evaluating-the-hidden-factory (2)Six sigma-in-measurement-systems-evaluating-the-hidden-factory (2)
Six sigma-in-measurement-systems-evaluating-the-hidden-factory (2)
 
How I Improve and Manage a Production Area
How I Improve and Manage a Production AreaHow I Improve and Manage a Production Area
How I Improve and Manage a Production Area
 
Lean six sigma executive overview (case study) templates
Lean six sigma executive overview (case study) templatesLean six sigma executive overview (case study) templates
Lean six sigma executive overview (case study) templates
 
Om4 bbm(l) 25.03.11
Om4 bbm(l) 25.03.11Om4 bbm(l) 25.03.11
Om4 bbm(l) 25.03.11
 
Identifying, Mitigating and Eliminating Risk with an Asset Management Strategy
Identifying, Mitigating and Eliminating Risk with an Asset Management StrategyIdentifying, Mitigating and Eliminating Risk with an Asset Management Strategy
Identifying, Mitigating and Eliminating Risk with an Asset Management Strategy
 
Six-Sigma-Green-belt.8169983.powerpoint.pptx
Six-Sigma-Green-belt.8169983.powerpoint.pptxSix-Sigma-Green-belt.8169983.powerpoint.pptx
Six-Sigma-Green-belt.8169983.powerpoint.pptx
 

Recently uploaded

Scheme-of-Work-Science-Stage-4 cambridge science.docx
Scheme-of-Work-Science-Stage-4 cambridge science.docxScheme-of-Work-Science-Stage-4 cambridge science.docx
Scheme-of-Work-Science-Stage-4 cambridge science.docxyaramohamed343013
 
Labelling Requirements and Label Claims for Dietary Supplements and Recommend...
Labelling Requirements and Label Claims for Dietary Supplements and Recommend...Labelling Requirements and Label Claims for Dietary Supplements and Recommend...
Labelling Requirements and Label Claims for Dietary Supplements and Recommend...Lokesh Kothari
 
G9 Science Q4- Week 1-2 Projectile Motion.ppt
G9 Science Q4- Week 1-2 Projectile Motion.pptG9 Science Q4- Week 1-2 Projectile Motion.ppt
G9 Science Q4- Week 1-2 Projectile Motion.pptMAESTRELLAMesa2
 
A relative description on Sonoporation.pdf
A relative description on Sonoporation.pdfA relative description on Sonoporation.pdf
A relative description on Sonoporation.pdfnehabiju2046
 
Biological Classification BioHack (3).pdf
Biological Classification BioHack (3).pdfBiological Classification BioHack (3).pdf
Biological Classification BioHack (3).pdfmuntazimhurra
 
Unlocking the Potential: Deep dive into ocean of Ceramic Magnets.pptx
Unlocking  the Potential: Deep dive into ocean of Ceramic Magnets.pptxUnlocking  the Potential: Deep dive into ocean of Ceramic Magnets.pptx
Unlocking the Potential: Deep dive into ocean of Ceramic Magnets.pptxanandsmhk
 
STERILITY TESTING OF PHARMACEUTICALS ppt by DR.C.P.PRINCE
STERILITY TESTING OF PHARMACEUTICALS ppt by DR.C.P.PRINCESTERILITY TESTING OF PHARMACEUTICALS ppt by DR.C.P.PRINCE
STERILITY TESTING OF PHARMACEUTICALS ppt by DR.C.P.PRINCEPRINCE C P
 
Spermiogenesis or Spermateleosis or metamorphosis of spermatid
Spermiogenesis or Spermateleosis or metamorphosis of spermatidSpermiogenesis or Spermateleosis or metamorphosis of spermatid
Spermiogenesis or Spermateleosis or metamorphosis of spermatidSarthak Sekhar Mondal
 
Artificial Intelligence In Microbiology by Dr. Prince C P
Artificial Intelligence In Microbiology by Dr. Prince C PArtificial Intelligence In Microbiology by Dr. Prince C P
Artificial Intelligence In Microbiology by Dr. Prince C PPRINCE C P
 
Work, Energy and Power for class 10 ICSE Physics
Work, Energy and Power for class 10 ICSE PhysicsWork, Energy and Power for class 10 ICSE Physics
Work, Energy and Power for class 10 ICSE Physicsvishikhakeshava1
 
Call Girls in Mayapuri Delhi 💯Call Us 🔝9953322196🔝 💯Escort.
Call Girls in Mayapuri Delhi 💯Call Us 🔝9953322196🔝 💯Escort.Call Girls in Mayapuri Delhi 💯Call Us 🔝9953322196🔝 💯Escort.
Call Girls in Mayapuri Delhi 💯Call Us 🔝9953322196🔝 💯Escort.aasikanpl
 
Call Us ≽ 9953322196 ≼ Call Girls In Mukherjee Nagar(Delhi) |
Call Us ≽ 9953322196 ≼ Call Girls In Mukherjee Nagar(Delhi) |Call Us ≽ 9953322196 ≼ Call Girls In Mukherjee Nagar(Delhi) |
Call Us ≽ 9953322196 ≼ Call Girls In Mukherjee Nagar(Delhi) |aasikanpl
 
Analytical Profile of Coleus Forskohlii | Forskolin .pdf
Analytical Profile of Coleus Forskohlii | Forskolin .pdfAnalytical Profile of Coleus Forskohlii | Forskolin .pdf
Analytical Profile of Coleus Forskohlii | Forskolin .pdfSwapnil Therkar
 
Physiochemical properties of nanomaterials and its nanotoxicity.pptx
Physiochemical properties of nanomaterials and its nanotoxicity.pptxPhysiochemical properties of nanomaterials and its nanotoxicity.pptx
Physiochemical properties of nanomaterials and its nanotoxicity.pptxAArockiyaNisha
 
Stunning ➥8448380779▻ Call Girls In Panchshil Enclave Delhi NCR
Stunning ➥8448380779▻ Call Girls In Panchshil Enclave Delhi NCRStunning ➥8448380779▻ Call Girls In Panchshil Enclave Delhi NCR
Stunning ➥8448380779▻ Call Girls In Panchshil Enclave Delhi NCRDelhi Call girls
 
Bentham & Hooker's Classification. along with the merits and demerits of the ...
Bentham & Hooker's Classification. along with the merits and demerits of the ...Bentham & Hooker's Classification. along with the merits and demerits of the ...
Bentham & Hooker's Classification. along with the merits and demerits of the ...Nistarini College, Purulia (W.B) India
 
zoogeography of pakistan.pptx fauna of Pakistan
zoogeography of pakistan.pptx fauna of Pakistanzoogeography of pakistan.pptx fauna of Pakistan
zoogeography of pakistan.pptx fauna of Pakistanzohaibmir069
 
Nightside clouds and disequilibrium chemistry on the hot Jupiter WASP-43b
Nightside clouds and disequilibrium chemistry on the hot Jupiter WASP-43bNightside clouds and disequilibrium chemistry on the hot Jupiter WASP-43b
Nightside clouds and disequilibrium chemistry on the hot Jupiter WASP-43bSérgio Sacani
 
Analytical Profile of Coleus Forskohlii | Forskolin .pptx
Analytical Profile of Coleus Forskohlii | Forskolin .pptxAnalytical Profile of Coleus Forskohlii | Forskolin .pptx
Analytical Profile of Coleus Forskohlii | Forskolin .pptxSwapnil Therkar
 

Recently uploaded (20)

Scheme-of-Work-Science-Stage-4 cambridge science.docx
Scheme-of-Work-Science-Stage-4 cambridge science.docxScheme-of-Work-Science-Stage-4 cambridge science.docx
Scheme-of-Work-Science-Stage-4 cambridge science.docx
 
Labelling Requirements and Label Claims for Dietary Supplements and Recommend...
Labelling Requirements and Label Claims for Dietary Supplements and Recommend...Labelling Requirements and Label Claims for Dietary Supplements and Recommend...
Labelling Requirements and Label Claims for Dietary Supplements and Recommend...
 
9953056974 Young Call Girls In Mahavir enclave Indian Quality Escort service
9953056974 Young Call Girls In Mahavir enclave Indian Quality Escort service9953056974 Young Call Girls In Mahavir enclave Indian Quality Escort service
9953056974 Young Call Girls In Mahavir enclave Indian Quality Escort service
 
G9 Science Q4- Week 1-2 Projectile Motion.ppt
G9 Science Q4- Week 1-2 Projectile Motion.pptG9 Science Q4- Week 1-2 Projectile Motion.ppt
G9 Science Q4- Week 1-2 Projectile Motion.ppt
 
A relative description on Sonoporation.pdf
A relative description on Sonoporation.pdfA relative description on Sonoporation.pdf
A relative description on Sonoporation.pdf
 
Biological Classification BioHack (3).pdf
Biological Classification BioHack (3).pdfBiological Classification BioHack (3).pdf
Biological Classification BioHack (3).pdf
 
Unlocking the Potential: Deep dive into ocean of Ceramic Magnets.pptx
Unlocking  the Potential: Deep dive into ocean of Ceramic Magnets.pptxUnlocking  the Potential: Deep dive into ocean of Ceramic Magnets.pptx
Unlocking the Potential: Deep dive into ocean of Ceramic Magnets.pptx
 
STERILITY TESTING OF PHARMACEUTICALS ppt by DR.C.P.PRINCE
STERILITY TESTING OF PHARMACEUTICALS ppt by DR.C.P.PRINCESTERILITY TESTING OF PHARMACEUTICALS ppt by DR.C.P.PRINCE
STERILITY TESTING OF PHARMACEUTICALS ppt by DR.C.P.PRINCE
 
Spermiogenesis or Spermateleosis or metamorphosis of spermatid
Spermiogenesis or Spermateleosis or metamorphosis of spermatidSpermiogenesis or Spermateleosis or metamorphosis of spermatid
Spermiogenesis or Spermateleosis or metamorphosis of spermatid
 
Artificial Intelligence In Microbiology by Dr. Prince C P
Artificial Intelligence In Microbiology by Dr. Prince C PArtificial Intelligence In Microbiology by Dr. Prince C P
Artificial Intelligence In Microbiology by Dr. Prince C P
 
Work, Energy and Power for class 10 ICSE Physics
Work, Energy and Power for class 10 ICSE PhysicsWork, Energy and Power for class 10 ICSE Physics
Work, Energy and Power for class 10 ICSE Physics
 
Call Girls in Mayapuri Delhi 💯Call Us 🔝9953322196🔝 💯Escort.
Call Girls in Mayapuri Delhi 💯Call Us 🔝9953322196🔝 💯Escort.Call Girls in Mayapuri Delhi 💯Call Us 🔝9953322196🔝 💯Escort.
Call Girls in Mayapuri Delhi 💯Call Us 🔝9953322196🔝 💯Escort.
 
Call Us ≽ 9953322196 ≼ Call Girls In Mukherjee Nagar(Delhi) |
Call Us ≽ 9953322196 ≼ Call Girls In Mukherjee Nagar(Delhi) |Call Us ≽ 9953322196 ≼ Call Girls In Mukherjee Nagar(Delhi) |
Call Us ≽ 9953322196 ≼ Call Girls In Mukherjee Nagar(Delhi) |
 
Analytical Profile of Coleus Forskohlii | Forskolin .pdf
Analytical Profile of Coleus Forskohlii | Forskolin .pdfAnalytical Profile of Coleus Forskohlii | Forskolin .pdf
Analytical Profile of Coleus Forskohlii | Forskolin .pdf
 
Physiochemical properties of nanomaterials and its nanotoxicity.pptx
Physiochemical properties of nanomaterials and its nanotoxicity.pptxPhysiochemical properties of nanomaterials and its nanotoxicity.pptx
Physiochemical properties of nanomaterials and its nanotoxicity.pptx
 
Stunning ➥8448380779▻ Call Girls In Panchshil Enclave Delhi NCR
Stunning ➥8448380779▻ Call Girls In Panchshil Enclave Delhi NCRStunning ➥8448380779▻ Call Girls In Panchshil Enclave Delhi NCR
Stunning ➥8448380779▻ Call Girls In Panchshil Enclave Delhi NCR
 
Bentham & Hooker's Classification. along with the merits and demerits of the ...
Bentham & Hooker's Classification. along with the merits and demerits of the ...Bentham & Hooker's Classification. along with the merits and demerits of the ...
Bentham & Hooker's Classification. along with the merits and demerits of the ...
 
zoogeography of pakistan.pptx fauna of Pakistan
zoogeography of pakistan.pptx fauna of Pakistanzoogeography of pakistan.pptx fauna of Pakistan
zoogeography of pakistan.pptx fauna of Pakistan
 
Nightside clouds and disequilibrium chemistry on the hot Jupiter WASP-43b
Nightside clouds and disequilibrium chemistry on the hot Jupiter WASP-43bNightside clouds and disequilibrium chemistry on the hot Jupiter WASP-43b
Nightside clouds and disequilibrium chemistry on the hot Jupiter WASP-43b
 
Analytical Profile of Coleus Forskohlii | Forskolin .pptx
Analytical Profile of Coleus Forskohlii | Forskolin .pptxAnalytical Profile of Coleus Forskohlii | Forskolin .pptx
Analytical Profile of Coleus Forskohlii | Forskolin .pptx
 

Fall 2013 Process Monitoring group project

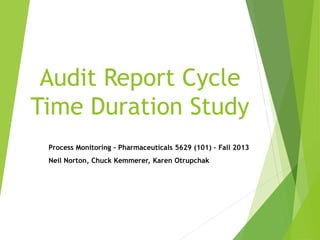
  • 1. Audit Report Cycle Time Duration Study Process Monitoring - Pharmaceuticals 5629 (101) – Fall 2013 Neil Norton, Chuck Kemmerer, Karen Otrupchak
  • 2. Objectives • To identify potential root cause for Audit to Final Audit Report cycle time to approach the 42-day limit • To identify sources of variation • To determine potential actions to create fixes - reduce cycle time
  • 3. Process Flow Open audit Template Document audit from notes and observations Route report to management/audit team for review and comment Edit report adding comment and corrections requested Print, sign, and scan report Post report and observations into Audit tracking Issue report to supplier
  • 4. Inputs and Outputs Inputs (X’s) • Responsibility: Auditing Group/Department • Audit Date: Date the audit started • Lead Auditor: Code letters given for each lead auditor • Audit Team Size: Number of team members • Observations: Numbers of Critical, Major, and Minor observations found • Supplier Type: Type of facility being audited (API, Commodity, Device, lab, etc.) • Change Control: Routine vs. non-Routine • Audit Process: “Stage” of the Process. (process changed/streamlined for Routine Audits April2013 • Audit Duration: Number of days spent at a site • Report Issue Date: Date final report was issued Output (Y) • Report Cycle Time: Time from Audit start date to Report Issued (Limits - be less than 42 days)
  • 5. Data Collected* Audit Responsibility Lead Auditor Audit Team Size Audit Date Audit Duratio n (days) Report Issue Date Report Cycle Time (Days) Critical Obs Major Obs Minor Obs Supplier TYPE * Data compiled from 105 audits over a duration of 12 months Change Control History Global Audit EU B 1 09/05/12 2 09/21/12 16 0 0 3 API Routine Global Audit 09/11/12 EXC Americas E 1 1 10/08/12 27 0 2 4 Routine Global Audit Americas E 2 09/12/12 2 10/03/12 21 0 0 0 Lab Routine Global Audit EU B 3 09/18/12 1 09/27/12 9 0 6 8 TPM Routine Global Audit EU D 7 09/19/12 2 10/19/12 30 1 4 4 Device Routine Global Audit EU D 1 09/20/12 1 09/27/12 7 0 1 0 EXC Routine Global Audit 09/20/12 Device Americas A 1 1 10/25/12 35 0 0 0 Routine Global Audit Americas E 2 09/26/12 2 10/19/12 23 0 1 0 TPM Routine Global Audit Americas G 3 09/28/12 2 10/30/12 32 0 4 4 TPM Routine … … …
  • 6. I-Chart - Report Cycle Times JMP Note: Special Test (6) - 4 out of 5 points more than 1 standard deviation from center line (on one side of CL) at points: 25, 27
  • 7. Dot Plot – Report Cycle Times Minitab
  • 8. Lead Auditor Pareto Plot 110 100 90 80 70 60 50 40 30 20 10 0 Count E A B C D F G H J K L Lead Audi tor 100 90 80 70 60 50 40 30 20 10 0 Cum Percent Plots 30 25 20 15 10 5 0 Number of Audits 20 17 16 10 26 6 6 1 1 1 1 A B C D E F G H J K L Lead Audi tor Bar Chart JMP Note: Auditor E conducted the most number of audits
  • 9. Lead Auditor (ANOVA) JMP Oneway Analysis of Report Cycle Time (Days) By Lead Auditor 45 40 35 30 25 20 15 10 5 0 Report Cycle Time (Days) A B C D E F GHJKL Lead Audi tor Oneway Anova Rsquare Adj Rsquare Root Mean Square Erro r Mean of Response Observations (o r Sum Wgts) 0.372156 0.305364 8.098001 21.19048 105 Summary of Fit Source Lead Audi tor Error C. Total DF 10 94 104 Sum of Squares 3653.8941 6164.2964 9818.1905 Mean Square 365.389 65.578 F Ratio 5.5719 Prob > F <.0001* Analysis of Variance Means for Oneway Anova Note: Auditor E had the shortest overall mean turn around time for report
  • 10. Bar Chart: Counts of total observations Minitab
  • 11. Total Observations (ANOVA) Minitab One-way ANOVA: Report Cycle Time (Days) versus Total Observations Source DF SS MS F P Total Observations 14 1246.7 89.1 0.94 0.525 Error 90 8571.5 95.2 Total 104 9818.2 S = 9.759 R-Sq = 12.70% R-Sq(adj) = 0.00%
  • 12. Change in Process Open audit Template Open audit Template Routine Audit? Document audit from notes and observations Routine audit report template Non-Routine audit report template Route report to management/audit team for review and comment Document audit from notes and observations
  • 13. Change in Process Minitab
  • 14. 2-Sample t-test by audit stage Two-Sample T-Test and CI: Report Cycle Time (Days), Audit Process Two-sample T for Report Cycle Time (Days) Audit Process N Mean StDev SE Mean 1 35 23.5 10.7 1.8 2 40 20.15 9.05 1.4 Difference = mu (1) - mu (2) Estimate for difference: 3.34 95% CI for difference: (-1.26, 7.93) T-Test of difference = 0 (vs not =): T-Value = 1.45 P-Value = 0.152 DF = 67 Based on this data, the change in routine audits had no statistically significant effect
  • 15. Initial IVP: Cycle time vs. Audit Responsibility
  • 16. Audit Responsibility- After Process Change Minitab Note: one “outlier” removed from Global Audit Americas
  • 17. Routine Audit Report Cycle Time Comparison of Data- Audit Responsibility after change Audit Responsibilit y # of Audits Mean Cycle Time (days) Std. Dev SE Mean Americas 21 15.71 7.85 1.7 PAA 5 19.20 7.33 2.0 EU 14 27.19 6.34 2.8 T-Test Results Comparison DF P-Value Stat. Sig. Diff Americas vs. EU 29 0.000 YES Americas vs. PAA 7 0.328 NO EU vs. PAA 8 0.050 YES
  • 18. Conclusions  Auditor E has conducted the most audits and has the lowest average turn-around time  There was no factor that could be linked to high cycle time  Initial analysis of the change in audit process didn’t appear to show any statistically significant change in cycle time  Further analysis showed that certain groups weren’t following the process change.  There was a statistically significant improvement in cycle time for those groups using the new form versus those that weren’t