Viable Production Estimates from Micro-Seismic Data
1. 1
Chance Brashears
Viable Production Estimates from Micro-Seismic Data
Advances in unconventional reservoir technology have been groundbreaking in the last
10 years, with micro-seismic tools being among the most advanced techniques currently used in
the petroleum industry. Detections in a well allow engineers to better understand the potential in
the designated area being fractured. Though micro-seismic data contributes significant fracture
monitoring information, there continues to be speculation if knowledge is limited because of
incongruences in the system. It is valid to use caution when assuming the consistency of a
reservoir. The main determination is this: Without lithological presumptions, is it enough to
know the detailed parameters of the fracture itself, or should micro-seismic data strive to
specifically indicate exact location and amount of hydrocarbons?
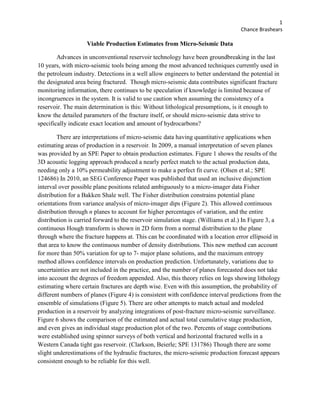
There are interpretations of micro-seismic data having quantitative applications when
estimating areas of production in a reservoir. In 2009, a manual interpretation of seven planes
was provided by an SPE Paper to obtain production estimates. Figure 1 shows the results of the
3D acoustic logging approach produced a nearly perfect match to the actual production data,
needing only a 10% permeability adjustment to make a perfect fit curve. (Olsen et al.; SPE
124686) In 2010, an SEG Conference Paper was published that used an inclusive disjunction
interval over possible plane positions related ambiguously to a micro-imager data Fisher
distribution for a Bakken Shale well. The Fisher distribution constrains potential plane
orientations from variance analysis of micro-imager dips (Figure 2). This allowed continuous
distribution through n planes to account for higher percentages of variation, and the entire
distribution is carried forward to the reservoir simulation stage. (Williams et al.) In Figure 3, a
continuous Hough transform is shown in 2D form from a normal distribution to the plane
through where the fracture happens at. This can be coordinated with a location error ellipsoid in
that area to know the continuous number of density distributions. This new method can account
for more than 50% variation for up to 7- major plane solutions, and the maximum entropy
method allows confidence intervals on production prediction. Unfortunately, variations due to
uncertainties are not included in the practice, and the number of planes forecasted does not take
into account the degrees of freedom appended. Also, this theory relies on logs showing lithology
estimating where certain fractures are depth wise. Even with this assumption, the probability of
different numbers of planes (Figure 4) is consistent with confidence interval predictions from the
ensemble of simulations (Figure 5). There are other attempts to match actual and modeled
production in a reservoir by analyzing integrations of post-fracture micro-seismic surveillance.
Figure 6 shows the comparison of the estimated and actual total cumulative stage production,
and even gives an individual stage production plot of the two. Percents of stage contributions
were established using spinner surveys of both vertical and horizontal fractured wells in a
Western Canada tight gas reservoir. (Clarkson, Beierle; SPE 131786) Though there are some
slight underestimations of the hydraulic fractures, the micro-seismic production forecast appears
consistent enough to be reliable for this well.
2. 2
Chance Brashears
A well is never fully assessed, and many assumptions have to be made. When
there are such a large number of factors influencing a well, a tool like micro-seismic monitoring
must be accurate with what data is available. The reliability of its data should constantly be
observed. This technology is influenced by many parameters:
There are a number of factors that likely influence the strength of microseisms recorded
during a treatment, although since the mechanism relating the microseism deformation
with the hydraulic fracture tensile deformation is not completely understood, any attempt
at providing a comprehensive list would be futile. (Maxwell et al.; SPE 116596)
The type and temperature of injection fluids, proppant density and concentrations, and
environmental aspects of the formation are just a few factors that make the strength of micro-
seismic recordings highly variable. Correlations have been attempted to prove the efficiency of
micro-seismic recordings. Figure 7 shows the recorded seismic moment vs. injected volume with
no clear relationship, while Figure 8 shows only a slight correlation when injection seismic
efficiency is plotted against frac gradient. (Maxwell et al.; SPE 116596) If a strong link could be
found between one or more of a reservoir’s parameters from micro-seismic results, effects could
be more direct. Receivers placed in the reservoir may be able to detect and locate a number of
important aspects of a reservoir, but production data requires a lot of information to accurately
apportion.
Though geophones used in micro-seismic imaging can provide average shear volume and
velocity data, this cannot specifically target a productive area when evaluating a well. It cannot
give a particular stage, and while it is true that there is a correlation between PLT versus seismic
data, it is very weak. Estimations can always be made when assessing complex fractures, but
until further mathematical and/or technological advancements can be made to micro-seismic
data, establishing well productivity from fracture figures will continue to be correlated
experienced assumptions.
3. 3
Chance Brashears
Appendix
Figure 1
Comparison of reservoir simulation (green) to well oil production (red) to for validity of the
production model.
Figure 2
The fracture coordination from fullbore microimager dips and the Fisher Distribution.
4. 4
Chance Brashears
Figure 3
Continuous Hough transform for a plane depicted in 2D. The angle is altered to involve (ϕ,Ɵ)
when the transform is 3D.
Figure 4
The relative probability of different numbers of planes according to the One-Dimensional
Number of Planes Integral.
5. 5
Chance Brashears
Figure 5
The P10, P50, and P90 production predictions from the ensemble of simulations, including the
shut-in period. All three confidence intervals decrease as number of planes decreases as seen in
Figure 4.
Figure 6
Comparison of estimated model data and actual production data using total-half length from
straight-line analysis of micro-seismic data, and flowing material balance. The left graph plots
the commingled stage production, and the right graph plots production for each individual stage
of the reservoir.
6. 6
Chance Brashears
Figure 7
Model from Barnett Shale and Woodford Shale deformation examples, with continuous and
fluvial sandstones, as well as carbonate and coal bed methane stimulation.
Figure 8
Model Showing a weak correlations from recordings from the Barnett and Woodford Shale.
Points closer to the lower solid line are sample simulations from coal bed methane in the
Woodford Shale, and fluvial sandstone. Points near the upper dashed lines are sample
simulations from the Barnett Shale.
7. 7
Chance Brashears
Work Cited
Clarkson, C.r., and J.j. Beierle. "Integration of Microseismic and Other Post-fracture
Surveillance with Production Analysis: A Tight Gas Study." Journal of Natural Gas
Science and Engineering 3.2 (2011): 382-401. Print.
Maxwell, Shawn C., Julie Ellen Shemeta, Elizabeth Campbell, and David James Quirk.
Microseismic Deformation Rate Monitoring. Proc. of SPE Annual Technical Conference
and Exhibition, Denver. Society of Petroleum Engineers, 2008. 1-9. 2008. Web. 5 Feb.
2014. SPE 116596
Olsen, Thomas N., Ernest Gomez, Douglas Dorn McCrady, Gary Stone Forrest, A. Perakis, and
Peter Kaufman. Stimulation Results and Completion Implications From the Consortium
Multiwell Project in the North Dakota Bakken Shale. Proc. of SPE Annual Technical
Conference and Exhibition, New Orleans. Society Of Petroleum Engineers, 2009. Web.
24 Feb. 2014. SPE 124686
Williams, M.J., B. Khadhraoui, and I. Bradford. Proc. of 2010 SEG Annual Meeting, Denver,
Colorado. 1-5. Quantitative Interpretation of Major Planes from Microseismic Event
Locations with Applicationin Production Prediction. Society of Exploration
Geophysicists, 2010. Web. 5 Feb. 2014.
Xin, Wang, Ding Yunhong, Xiu Nailing, Wang Zhenduo, Yanyuzhong, and Langfang. A New
Method to Interpret Hydraulic Fracture Complexity in Unconventional Reservoir by Tilt
Magnitude. Thesis. International Petroleum Technology Conference, 2013. N.p.:
OnePetro, 2013. IPTC 17094