SlideShare a Scribd company logo
1 of 18
Download to read offline
This Week in Earnings provides analysis and commentary on aggregate earnings estimate revisions, growth rates and valuations. View all Thomson
Reuters Proprietary Research subscription channels.
All data sourced from Thomson Reuters Eikon, a complete solution for research and analytics. It places the most comprehensive market information,
news, analytics and trading tools available into a desktop as simple to use as the Internet. Thomson Reuters Eikon clients can run fundamental and
technical screens against a global dataset representing more than 100 countries and over 200,000 securities. Learn more. Request a free trial of Thomson
Reuters Eikon today.
© 2015 Thomson Reuters. All marks herein are used under license.
PROPRIETARY RESEARCH
EARNINGS AGGREGATES
REPORTING ANALYSTS: Greg Harrison, David Aurelio May 1, 2015
THIS WEEK IN EARNINGS
AGGREGATE ESTIMATES AND REVISIONS
 First quarter earnings are expected to grow 2.0% from Q1 2014.
 Of the 360 companies in the S&P 500 that have reported earnings to date for Q1 2015, 68% have
reported earnings above analyst expectations. This is above the long-term average of 63% and below
the average over the past four quarters of 70%.
 44% of companies have reported Q1 2015 revenue above analyst expectations. This is below the long-
term average of 61% and is below the average over the past four quarters of 58%.
 For Q1 2015, there have been 109 negative EPS preannouncements issued by S&P 500 corporations
compared to 19 positive EPS preannouncements. By dividing 109 by 19, one arrives at an N/P ratio of 5.7
for the S&P 500 Index.
 The forward four-quarter (2Q15 – 1Q16) P/E ratio for the S&P 500 is 17.1.
 During the week of May 4, 90 companies are expected to report Q1 2015 earnings.
SECTION A: EARNINGS OUTLOOK
Q1 2015: EARNINGS REVISIONS
Exhibit 1A. S&P 500: Q1 2015 Share-Weighted Earnings ($B)
Source: Thomson Reuters I/B/E/S
225.0
230.0
235.0
240.0
245.0
250.0
255.0
260.0
265.0
270.0
275.0
3/6
3/13
3/20
3/27
4/3
4/10
4/17
4/24
5/1
5/8
5/15
5/22
5/29
6/5
6/12
6/19
6/26
© 2015 Thomson Reuters. All marks herein are used under license. TRPR_82221_277 2
THOMSON REUTERS PROPRIETARY RESEARCH MAY 1, 2015
THIS WEEK IN EARNINGS
There has been a decrease in the share-weighted earnings for the S&P 500 since the start of the quarter (to
$260.9B from $265.4B). Six of the ten sectors have experienced downward revisions to estimates.
Since January 1, the Energy (-33.6%) and Materials (-12.2%) sectors have recorded the highest percentage
decreases in earnings, while the Utilities (11.6%) sector has recorded the highest percentage increase in
earnings. Overall, share-weighted earnings for the S&P 500 have decreased by 1.7% since the start of the
quarter.
Since January 1, the Energy (-$7.0B) and Consumer Discretionary (-$2.3B) sectors have recorded the highest
dollar-level decreases in earnings, while the Financials ($4.8B) sector has recorded the highest dollar-level
increase in earnings. Overall, expected share-weighted earnings for the S&P 500 have decreased by $4.5B
since the start of the quarter.
OBSERVATIONS: S&P 500 EARNINGS BACK IN BLACK
The busiest week of this quarter’s earnings season ended on a positive note. Better than expected earnings
results from the 159 of the S&P 500’s constituents that reported the week of May 1st saw 65% of corporate
earnings come in ahead of Q1 2015 estimates. As a result, the index saw earnings growth expectations for the
first quarter of 2015 cross into the black, and is now expected to grow 2.0% from the prior year. This is a
substantial improvement from last week when earnings were expected to decline 2.3%, which would have
been the first negative growth rate since Q3 2009.
Exhibit 2A. S&P 500: Q1 2015 Earnings vs. Expectations – Companies Reporting April 27 – May 1
Reported Reported Index
Sector Above % Match % Below % This Week Total # Total #
Consumer Discretionary 53% 5% 42% 19 50 84
Consumer Staples 67% 17% 17% 6 23 38
Energy 100% 0% 0% 14 24 41
Financials 59% 16% 25% 32 74 87
Health Care 81% 10% 10% 21 38 55
Industrials 43% 17% 39% 23 58 65
Materials 62% 0% 38% 13 24 29
Technology 69% 8% 23% 13 46 66
Telecom Services 100% 0% 0% 1 3 5
Utilities 71% 6% 24% 17 20 30
S&P 500 65.4% 9.4% 25.2% 159 360 500
Source: Thomson Reuters I/B/E/S
Not only was this the busiest week for S&P 500 reporting, but also the most important because results from
the energy sector could change the outlook for the index. Fortunately, analysts severely underestimated the
sectors’ ability to generate earnings this quarter. All 14 of the companies within the sector that reported the
week ending May 1st, beat earnings estimates, and ten reported double digit earnings surprise percentages.
This helped to bring overall earnings for the sector in 31.8% above estimates. As a result the energy sector’s
earnings growth expectations for Q1 2015 improved 9.7 percentage points from the prior week, and are now
expected to decline 54.5%. While this large improvement was a major contributor to the index turning
positive, the sector is still a major drag on the S&P 500. When the energy sector is excluded, the S&P 500’s
Q1 2015 earnings growth expectations increase to 9.7% from 2.0% when they are included.
The revenue picture for the energy sector was not as glamorous. Of the 14 sector’s constituents that reported
during the week ending May 1st, only eight beat Q1 2015 revenue estimates. Results for the quarter have
come in 8.9% higher than expected and the sector is now expected to decline 33.6% from Q1 2014, a 4.1
percentage point improvement from the prior week. One of the reasons for the discrepancy in performance
between earnings and revenue results vs. estimates for the energy sector has to do with efficiency
improvements.
© 2015 Thomson Reuters. All marks herein are used under license. TRPR_82221_277 3
THOMSON REUTERS PROPRIETARY RESEARCH MAY 1, 2015
THIS WEEK IN EARNINGS
In comparison to expectations, both of the heavy hitters within the energy sector, Exxon Mobile Corp. (XOM.N)
and Chevron Corp. (XOM.N), knocked earnings and revenue results out of the park. Chevron reported Q1 2015
earnings of $1.37 per share for a surprise of 73.4%, and revenue of $34.6 billion, 41.8% above estimates.
Exxon reported earnings of $1.17 per share compared to the mean estimate of $0.83 per share, and revenue of
$67.6 billion for a surprise of 32.0%. There were a few additional positive surprises as well. Given the overall
concern for US multinationals in regard to the dollar, Chevron’s $580 million benefit in the quarter as a result
of foreign currency exchange rates was an unexpected gain. However, it should be noted that this is mostly
due to balance sheet translation and won’t have a substantial impact to cash. Additionally, Exxon increased
its dividend per shares by 5.3% to $0.73.
The two Integrated Oil & Gas sub-industry companies saw benefits to their downstream businesses due to
stronger worldwide refining and marketing margins, but had severe declines in upstream as a result of
substantial declines in crude. Both companies shared two of common themes with the sector, an emphasis
on expectations for increased production to continue, and implementation of cost saving measures. Chevron
expects to save $35 billion this year, while Exxon has signaled a target of $34 billion.
Integrated Oil & Gas wasn’t the only big winner. CONSOL Energy Inc.’s (CNX.N) earnings of $0.37 per share
led to a surprise of 184.6%, which was the largest of any constituent within the index. While this was a great
surprise, low coal prices fueled by low natural gas continue to be an issue and earnings for the quarter were
down 26% from the prior year. Revenue slightly topped estimates by 0.3% at $890 million, down 8% from
Q1 2014. Better margins on coal helped CONSOL’s earnings, but the big boost came from a negative 48%
effective tax rate related to the percentage depletion of its coal operations. However, looking forward
commodity pricing for coal is expected to remain a challenge. Jim Grech, Chief Commercial Officer for
CONSOL Energy, said during the April 28th conference call, “For 2015 right now, we see the current markets
since the beginning of the year as being -- and I'll call it the spot markets -- as being relatively weak and it's
led to us taking advantage of the assets we have and the strength we have to go to the export market. And we
see that weakness continuing here through the second quarter, summer, and as we get to later in the year,
there is some potential for some change. We have some indications of some spot coal, and we've made some
small sales a little further out in a year. But the weakness that we've seen through the first quarter we expect
to continue through the second quarter, and with some potential for some changes we get to later in the year
are going to be highly dependent on weather and gas prices.”
© 2015 Thomson Reuters. All marks herein are used under license. TRPR_82221_277 4
THOMSON REUTERS PROPRIETARY RESEARCH MAY 1, 2015
THIS WEEK IN EARNINGS
Q1 2015: EARNINGS SCORECARD
Exhibit 3A. S&P 500: Q1 2015 Earnings vs. Expectations
Surprise Reported Index
Sector Above % Match % Below % Factor % Total # Total #
Consumer Discretionary 62% 10% 28% 0% 50 84
Consumer Staples 83% 9% 9% 7% 23 38
Energy 92% 0% 8% 32% 24 41
Financials 59% 18% 23% 5% 74 87
Health Care 82% 5% 13% 10% 38 55
Industrials 62% 10% 28% 0% 58 65
Materials 63% 4% 33% 8% 24 29
Technology 63% 13% 24% 6% 46 66
Telecom Services 100% 0% 0% 5% 3 5
Utilities 75% 5% 20% 12% 20 30
S&P 500 68% 10% 22% 7% 360 500
Source: Thomson Reuters I/B/E/S
Through May 1, 360 companies in the S&P 500 Index have reported earnings for Q4 2014. Of these
companies, 68% reported earnings above analyst expectations, 10% reported earnings in line with analyst
expectations and 22% reported earnings below analyst expectations. In a typical quarter (since 1994), 63% of
companies beat estimates, 16% match and 21% miss estimates. Over the past four quarters, 70% of
companies beat the estimates, 9% matched and 21% missed estimates.
In aggregate, companies are reporting earnings that are 7% above estimates, which is above the 3% long-
term (since 1994) average surprise factor, and above the 4% surprise factor recorded over the past four
quarters.
© 2015 Thomson Reuters. All marks herein are used under license. TRPR_82221_277 5
THOMSON REUTERS PROPRIETARY RESEARCH MAY 1, 2015
THIS WEEK IN EARNINGS
Q1 2015: REVENUE SCORECARD
Exhibit 4A. S&P 500: Q1 2015 Revenue vs. Expectations
Surprise Reported Index
Sector Above % Match % Below % Factor % Total # Total #
Consumer Discretionary 40% 0% 60% -3% 50 84
Consumer Staples 57% 0% 43% 0% 23 38
Energy 54% 0% 46% 9% 24 41
Financials 47% 0% 53% 0% 74 87
Health Care 58% 0% 42% 2% 38 55
Industrials 31% 0% 69% -3% 58 65
Materials 25% 0% 75% -4% 24 29
Technology 54% 0% 46% 1% 46 66
Telecom Services 0% 0% 100% -1% 3 5
Utilities 40% 0% 60% 0% 20 30
S&P 500 44% 0% 56% 0% 360 500
Source: Thomson Reuters I/B/E/S
Through May 1, 360 companies in the S&P 500 Index have reported revenues for Q4 2014. Of these
companies, 44% reported revenues above analyst expectations, 0% reported revenues in line with analyst
expectations, and 56% reported revenues below analyst expectations. In aggregate, companies are reporting
revenues that are in line with estimates.
Q1 2015: EARNINGS GROWTH RATES
Exhibit 5A. S&P 500: Q1 2015 Earnings Growth
Earnings $B Earnings $B Growth $B Growth %
Sector Q115 Q114 Q115 Q115
Consumer Discretionary 25.1 23.7 1.3 5.7%
Consumer Staples 23.4 22.7 0.8 3.4%
Energy 13.9 30.5 -16.6 -54.5%
Financials 56.3 48.9 7.5 15.3%
Health Care 38.3 32.7 5.5 17.0%
Industrials 24.9 23.7 1.3 5.4%
Materials 8.8 8.4 0.3 3.7%
Technology 52.7 48.3 4.4 9.1%
Telecom Services 8.0 7.8 0.2 3.1%
Utilities 9.5 9.1 0.4 4.8%
S&P 500 260.9 255.7 5.2 2.0%
Source: Thomson Reuters I/B/E/S
The estimated earnings growth rate for the S&P 500 for Q1 2015 2.0%. The S&P 500 expects to see share-
weighted earnings of $260.9B in Q1 2015, compared to share-weighted earnings of $255.7B (based on the
year-ago earnings of the current 500 constituents) in Q1 2014.
Nine of the ten sectors in the index expect to see an improvement in earnings relative to Q1 2014. The Health
Care and Financials sectors have the highest earnings growth rates for the quarter, while the Energy sector
has the weakest anticipated growth compared to Q1 2014.
The Health Care sector has the highest earnings growth rate (17.0%) of any sector. It is expected to earn
$38.3B in Q1 2015, compared to earnings of $32.7B in Q1 2014. Eight of the ten sub-industries in the sector
are anticipated to have positive earnings growth, led by Biotechnology (61%) and Health Care Facilities (48%).
If these sub-industries are removed, the growth rate declines to 17.0%.
© 2015 Thomson Reuters. All marks herein are used under license. TRPR_82221_277 6
THOMSON REUTERS PROPRIETARY RESEARCH MAY 1, 2015
THIS WEEK IN EARNINGS
The Financials sector has the second highest earnings growth rate (15.3%) of all ten sectors. Analysts expect it
to earn $56.3B in Q1 2015, relative to earnings of $48.9B in Q1 2014. 14 of the 21 sub-industries in the sector
are anticipated to see higher earnings than a year ago. The Diversified Banks (33%) and Investment Banking
& Brokerage (32%) sub-industries have the highest growth rates in the sector. If these sub-industries are
removed, the growth rate declines to 4.9%.
The Energy sector has the lowest growth rate (-54.5%) of any sector. It is expected to earn $13.9B in Q1 2015,
relative to earnings of $30.5B in Q1 2014. Six of the seven sub-industries in the sector are anticipated to see
earnings decreases compared to Q1 2014, led by Oil & Gas Exploration & Production (-113%). If this sub-
industry is removed, the growth rate increases to (-34.3%).
Q1 2015: REVENUE GROWTH RATES
Exhibit 6A. S&P 500: Q1 2015 Revenue Growth
Revenue $B Revenue $B Growth $B Growth %
Sector Q115 Q114 Q115 Q115
Consumer Discretionary 390.7 386.5 4.2 1.1%
Consumer Staples 396.4 383.7 12.7 3.3%
Energy 253.3 381.7 -128.4 -33.6%
Financials 287.3 276.1 11.1 4.0%
Health Care 363.5 330.8 32.7 9.9%
Industrials 288.4 294.9 -6.5 -2.2%
Materials 90.8 100.2 -9.4 -9.4%
Technology 285.4 269.3 16.0 6.0%
Telecom Services 72.5 70.6 1.9 2.7%
Utilities 91.7 94.7 -3.0 -3.1%
S&P 500 2,519.9 2,588.4 -68.5 -2.6%
Source: Thomson Reuters I/B/E/S
The estimated revenue growth rate for the S&P 500 for Q1 2015 is -2.6%. The S&P 500 is expected to earn
revenues of $2,519.9B in Q1 2015 compared to $2,588.4B in Q1 2014.
Six of the ten sectors anticipate revenue growth for the quarter. The Health Care sector is expected to have
the highest revenue growth rate for the quarter, while the Energy sector is expected to have the lowest
revenue growth rate.
The Health Care sector expects the highest revenue growth rate (9.9%) for the quarter. It is expected to
generate sales of $363.5B in Q1 2015, compared to sales of $330.8B in Q1 2014. Eight of the ten sub-
industries in the sector are expected to see sales growth, led by the Health Care Technology (38%) and
Biotechnology (28%) sub-industries. If these sub-industries are removed, the growth rate declines to 9.0%.
The Energy sector has the lowest revenue growth rate at -33.6%. The sector is expected to post sales of
$253.3 in Q1 2015, relative to sales of $381.7B in Q1 2014. All seven sub-industries in the sector expect to see
revenue decreases for the quarter, led by the Oil & Gas Exploration & Production (-50%) and Oil & Gas
Refining & Marketing (-37%) sub-industries. If these sub-industries are removed, the growth rate increases to
-29.7%.
© 2015 Thomson Reuters. All marks herein are used under license. TRPR_82221_277 7
THOMSON REUTERS PROPRIETARY RESEARCH MAY 1, 2015
THIS WEEK IN EARNINGS
Q1 2015: EARNINGS GUIDANCE
Exhibit 7A. S&P 500: Q1 2015 Preannouncements
Q1 2015 Q1 2014 Q4 2014
Type Total (#) Total (%) Total (#) Total (%) Total (#) Total (%)
Positive 19 14% 18 13% 24 17%
In-Line 6 4% 11 8% 13 9%
Negative 109 81% 109 79% 101 73%
Total 134 138 138
N/P Ratio 5.74 6.06 4.21
Source: Thomson Reuters I/B/E/S
In the S&P 500, there have been 109 negative EPS preannouncements issued by corporations for Q1 2015
compared to 19 positive EPS preannouncements. By dividing 109 by 19, one arrives at an N/P ratio of 5.7 for
the S&P 500 Index. This 5.7 ratio is below the N/P ratio at the same point in time in Q1 2014 (6.1), and is
above the long-term aggregate (since 1995) N/P ratio for the S&P 500 (2.6).
Q2 2015 – Q1 2016: FORWARD FOUR-QUARTER P/E RATIO
Exhibit 8A. S&P 500: Forward Four-Quarter (Q2 2015 – Q1 2016) P/E Ratio
Price EPS P/E Ratio
CY 2015 2,086 118.78 17.6
Forward 4 Quarter 2,086 122.23 17.1
CY 2016 2,086 119.02 17.5
Source: Thomson Reuters I/B/E/S
The forward four-quarter (Q2 2015 – Q1 2016) P/E ratio for the S&P 500 is 17.1.
Q1 2015 – Q4 2015: EARNINGS GROWTH
The estimated earnings growth rates for the S&P 500 for Q1 2015 through Q4 2015 are 2%, -2%, 1%, and 5%,
respectively. For sector-level growth rates for Q1 2015 through Q4 2015, see Exhibits 2C-5C in this report.
EARNINGS CALENDAR
The next several weeks will see the first companies report earnings for Q1 2015. There are 90 companies
scheduled to report Q1 2015 earnings during the week of May 4.
Exhibit 9A. Number of Companies Reporting Q1 2015 Earnings
Reported Report Report Report
Q1 2015 To Date This Week Next Week Remaining
Dow 30 26 1 1 2
S&P 500 360 90 16 34
Source: Thomson Reuters StreetEvents.
© 2015 Thomson Reuters. All marks herein are used under license. TRPR_82221_277 8
THOMSON REUTERS PROPRIETARY RESEARCH MAY 1, 2015
THIS WEEK IN EARNINGS
STARMINE EARNINGS SURPRISE FORECAST Q1 2015
Looking forward to anticipated Q1 performance, we use StarMine’s SmartEstimate to determine which
companies in the S&P 500 are better poised to beat earnings estimates. The SmartEstimate is a weighted
average of analyst estimates, with more weight given to more recent estimates and more accurate analysts.
Our studies have shown that when the SmartEstimate differs from the consensus (IBES Mean) by more than
2%, the company is likely to post subsequent earnings surprises directionally correct 70% of the time.
During the week of May 4, 90 S&P 500 companies are expected to report earnings. Of these companies,
positive surprises are expected from EOG Resources Inc (EOG.N) and Electronic Arts Inc. (EA.O). Analysts
expect EOG to report earnings above the consensus due to lower capex spending. Meanwhile, Electronic Arts
is expected to benefit from an strong sales of its new FIFA game and downloadable game content.
On the flip side, negative surprises are expected from News Corp. (NWSA.O) and TripAdvisor Inc (TRIP.O).
News Corp is expected to be impacted by foreign currency exposure due to the stronger US Dollar versus the
British Pound and the Australian Dollar. Analysts believe that TripAdvisor will be impacted by weak seasonal
revenues from its Viator site.
EXHIBIT 10A. POSITIVE PREDICTED SURPRISES FOR Q1 2015, WEEK OF MAY 4, 2015
Company Ticker SmartEstimate Mean Predicted Surprise Predicted Surprise %
Nrg Energy Inc NRG 0.4431 0.2378 0.2053 86.36%
EOG Resources Inc EOG 0.0444 0.0003 0.0440 44.05%
Pioneer Natural Resources Co PXD 0.0937 0.0804 0.0133 13.28%
Chesapeake Energy Corp CHK 0.0499 0.0385 0.0115 11.46%
Cablevision Systems Corp CVC 0.1866 0.1712 0.0154 9.00%
Cimarex Energy Co XEC -0.3369 -0.3663 0.0294 8.03%
Diamond Offshore Drilling Inc DO 0.4595 0.4308 0.0287 6.66%
Spectra Energy Corp SE 0.4457 0.4220 0.0237 5.63%
Vulcan Materials Co VMC -0.1473 -0.1560 0.0087 5.57%
Electronic Arts Inc EA 0.2636 0.2510 0.0126 5.04%
Source: Thomson Reuters StarMine Professional.
EXHIBIT 11A. NEGATIVE PREDICTED SURPRISES FOR Q1 2015, WEEK OF MAY 4, 2015
Company Ticker SmartEstimate Mean Predicted Surprise Predicted Surprise %
Assurant Inc AIZ 0.6287 0.9250 -0.2963 -32.03%
Perrigo Company Plc PRGO 1.6000 1.9800 -0.3800 -19.19%
News Corp NWSA 0.0531 0.0703 -0.0172 -17.25%
Tesoro Corp TSO 1.1398 1.2902 -0.1505 -11.66%
Apache Corp APA -0.6255 -0.5733 -0.0522 -9.10%
Loews Corp L 0.6837 0.7500 -0.0663 -8.84%
Occidental Petroleum Corp OXY 0.0303 0.0375 -0.0072 -7.18%
Tripadvisor Inc TRIP 0.5369 0.5590 -0.0222 -3.97%
Marathon Oil Corp MRO -0.4659 -0.4529 -0.0131 -2.89%
Newfield Exploration Co NFX 0.0778 0.0807 -0.0029 -2.86%
Source: Thomson Reuters StarMine Professional.
© 2015 Thomson Reuters. All marks herein are used under license. TRPR_82221_277 9
THOMSON REUTERS PROPRIETARY RESEARCH MAY 1, 2015
THIS WEEK IN EARNINGS
SECTION B: EARNINGS CALENDAR
MONDAY: MAY 4
Exhibit 1B. Monday Earnings Calendar
Date Ticker Company Qtr Est Yr Ago % Dif Time
4-May-15 CMCSA.OQ COMCAST CORP Q1-Mar.15 0.74 0.68 8.7 8:30 AM
4-May-15 CTSH.OQ COGNIZANT TECHNOLOGY SOLUTIONS C Q1-Mar.15 0.70 0.57 22.0 8:30 AM
4-May-15 CVC.N CABLEVISION SYSTEMS CORP Q1-Mar.15 0.17 0.14 22.2 8:30 AM
4-May-15 DO.N DIAMOND OFFSHORE DRILLING INC Q1-Mar.15 0.43 0.93 -53.7 8:30 AM
4-May-15 HSIC.OQ HENRY SCHEIN Q1-Mar.15 1.26 1.18 7.2 8:30 AM
4-May-15 L.N LOEWS CORP Q1-Mar.15 0.75 0.68 10.3 8:30 AM
4-May-15 PRGO.N PERRIGO COMPANY PLC Q1-Mar.15 1.78 1.31 36.2 8:30 AM
4-May-15 SYY.N SYSCO CORP Q3-Mar.15 0.41 0.38 8.9 8:30 AM
4-May-15 TSN.N TYSON FOODS INC Q2-Mar.15 0.72 0.60 19.9 8:30 AM
4-May-15 APC.N ANADARKO PETROLEUM CORP Q1-Mar.15 -0.64 1.26 -150.7 4:00 PM
4-May-15 BRKb.N BERKSHIRE HATHAWAY INC Q1-Mar.15 1.62 1.43 13.3 4:00 PM
4-May-15 DNB.N DUN & BRADSTREET CORP Q1-Mar.15 1.24 1.55 -20.0 4:00 PM
4-May-15 DVA.N DAVITA HEALTHCARE PARTNERS INC Q1-Mar.15 0.86 0.97 -10.9 4:00 PM
4-May-15 EOG.N EOG RESOURCES INC Q1-Mar.15 0.00 1.40 -100.0 4:00 PM
4-May-15 THC.N TENET HEALTHCARE CORP Q1-Mar.15 0.32 -0.03 NA 4:00 PM
4-May-15 VNO.N VORNADO REALTY TRUST Q1-Mar.15 1.19 1.31 -9.2 4:00 PM
4-May-15 XEC.N CIMAREX ENERGY CO Q1-Mar.15 -0.37 1.67 -121.9 4:00 PM
4-May-15 D.N DOMINION RESOURCES INC Q1-Mar.15 0.96 1.04 -7.3 N/AV
Source: Thomson Reuters StreetEvents.
© 2015 Thomson Reuters. All marks herein are used under license. TRPR_82221_277 10
THOMSON REUTERS PROPRIETARY RESEARCH MAY 1, 2015
THIS WEEK IN EARNINGS
TUESDAY: MAY 5
Exhibit 2B. Tuesday Earnings Calendar
Date Ticker Company Qtr Est Yr Ago % Dif Time
5-May-15 DISCA.OQ DISCOVERY COMMUNICATIONS INC Q1-Mar.15 0.35 0.38 -5.6 7:00 AM
5-May-15 DISCK.OQ DISCOVERY COMMUNICATIONS INC Q1-Mar.15 0.33 0.38 -12.0 7:00 AM
5-May-15 WEC.N WISCONSIN ENERGY CORP Q1-Mar.15 0.83 0.91 -9.3 7:00 AM
5-May-15 ADM.N ARCHER DANIELS MIDLAND CO Q1-Mar.15 0.71 0.64 11.5 8:30 AM
5-May-15 DTV.OQ DIRECTV Q1-Mar.15 1.53 1.09 40.4 8:30 AM
5-May-15 EL.N ESTEE LAUDER COMPANIES INC Q3-Mar.15 0.51 0.64 -20.4 8:30 AM
5-May-15 EMR.N EMERSON ELECTRIC CO Q2-Mar.15 0.76 0.80 -4.7 8:30 AM
5-May-15 HCA.N HCA HOLDINGS INC Q1-Mar.15 1.19 0.84 41.3 8:30 AM
5-May-15 HCP.N HCP INC Q1-Mar.15 0.78 0.75 4.4 8:30 AM
5-May-15 ICE.N INTERCONTINENTAL EXCHANGE INC Q1-Mar.15 2.97 2.42 22.8 8:30 AM
5-May-15 K.N KELLOGG CO Q1-Mar.15 0.92 1.01 -9.0 8:30 AM
5-May-15 MNK.N MALLINCKRODT PLC Q2-Mar.15 1.52 0.95 60.4 8:30 AM
5-May-15 NBL.N NOBLE ENERGY INC Q1-Mar.15 0.03 0.82 -96.8 8:30 AM
5-May-15 VMC.N VULCAN MATERIALS CO Q1-Mar.15 -0.16 -0.28 NA 8:30 AM
5-May-15 ZTS.N ZOETIS INC Q1-Mar.15 0.36 0.38 -4.6 8:30 AM
5-May-15 SRE.N SEMPRA ENERGY Q1-Mar.15 1.32 1.03 28.0 9:00 AM
5-May-15 AIZ.N ASSURANT INC Q1-Mar.15 0.93 1.68 -44.9 4:00 PM
5-May-15 ALL.N ALLSTATE CORP Q1-Mar.15 1.44 1.30 10.9 4:00 PM
5-May-15 CTL.N CENTURYLINK INC Q1-Mar.15 0.59 0.66 -11.3 4:00 PM
5-May-15 DIS.N WALT DISNEY CO Q2-Mar.15 1.10 1.11 -0.6 4:00 PM
5-May-15 DVN.N DEVON ENERGY CORP Q1-Mar.15 0.26 1.34 -80.2 4:00 PM
5-May-15 EA.OQ ELECTRONIC ARTS INC Q4-Mar.15 0.25 0.48 -47.7 4:00 PM
5-May-15 FISV.OQ FISERV INC Q1-Mar.15 0.86 0.82 5.4 4:00 PM
5-May-15 FOSL.OQ FOSSIL GROUP INC Q1-Mar.15 0.63 1.11 -43.2 4:00 PM
5-May-15 FTR.OQ FRONTIER COMMUNICATIONS CORP Q1-Mar.15 0.04 0.05 -14.0 4:00 PM
5-May-15 MYL.OQ MYLAN NV Q1-Mar.15 0.69 0.66 5.0 4:00 PM
5-May-15 NFX.N NEWFIELD EXPLORATION CO Q1-Mar.15 0.08 0.44 -81.7 4:00 PM
5-May-15 NWSA.OQ NEWS CORP Q3-Mar.15 0.07 0.11 -36.1 4:00 PM
5-May-15 OKE.N ONEOK INC Q1-Mar.15 0.36 0.42 -13.9 4:00 PM
5-May-15 PXD.N PIONEER NATURAL RESOURCES CO Q1-Mar.15 0.08 1.26 -93.6 4:00 PM
5-May-15 TEG.N INTEGRYS ENERGY GROUP INC Q1-Mar.15 1.82 1.73 5.2 4:00 PM
5-May-15 HRS.N HARRIS CORP Q3-Mar.15 1.25 1.27 -1.8 N/AV
Source: Thomson Reuters StreetEvents.
© 2015 Thomson Reuters. All marks herein are used under license. TRPR_82221_277 11
THOMSON REUTERS PROPRIETARY RESEARCH MAY 1, 2015
THIS WEEK IN EARNINGS
WEDNESDAY: MAY 6
Exhibit 3B. Wednesday Earnings Calendar
Date Ticker Company Qtr Est Yr Ago % Dif Time
6-May-15 CHK.N CHESAPEAKE ENERGY CORP Q1-Mar.15 0.04 0.59 -93.5 8:30 AM
6-May-15 MSI.N MOTOROLA SOLUTIONS INC Q1-Mar.15 0.25 0.27 -6.2 8:30 AM
6-May-15 OXY.N OCCIDENTAL PETROLEUM CORP Q1-Mar.15 0.04 1.75 -97.9 8:30 AM
6-May-15 SE.N SPECTRA ENERGY CORP Q1-Mar.15 0.42 0.62 -31.9 8:30 AM
6-May-15 XRAY.OQ DENTSPLY INTERNATIONAL INC Q1-Mar.15 0.57 0.59 -3.0 8:30 AM
6-May-15 CF.N CF INDUSTRIES HOLDINGS INC Q1-Mar.15 4.61 4.51 2.3 4:00 PM
6-May-15 CSC.N COMPUTER SCIENCES CORP Q4-Mar.15 1.20 1.09 10.3 4:00 PM
6-May-15 ED.N CONSOLIDATED EDISON INC Q1-Mar.15 1.18 1.17 0.8 4:00 PM
6-May-15 ESS.N ESSEX PROPERTY TRUST INC. Q1-Mar.15 2.23 1.68 32.5 4:00 PM
6-May-15 FOXA.OQ TWENTYFIRST CENTURY FOX INC Q3-Mar.15 0.39 0.47 -16.8 4:00 PM
6-May-15 GMCR.OQ KEURIG GREEN MOUNTAIN INC Q2-Mar.15 1.05 1.08 -2.9 4:00 PM
6-May-15 KIM.N KIMCO REALTY CORP Q1-Mar.15 0.35 0.34 3.5 4:00 PM
6-May-15 MET.N METLIFE INC Q1-Mar.15 1.41 1.37 3.0 4:00 PM
6-May-15 MRO.N MARATHON OIL CORP Q1-Mar.15 -0.45 0.88 -151.5 4:00 PM
6-May-15 PRU.N PRUDENTIAL FINANCIAL INC Q1-Mar.15 2.38 2.40 -1.0 4:00 PM
6-May-15 RIG.N TRANSOCEAN LTD Q1-Mar.15 0.60 1.43 -58.0 4:00 PM
6-May-15 TRIP.OQ TRIPADVISOR INC Q1-Mar.15 0.56 0.54 3.5 4:00 PM
6-May-15 WFM.OQ WHOLE FOODS MARKET INC Q2-Mar.15 0.43 0.38 12.0 4:00 PM
6-May-15 EXPD.OQ EXPEDITORS INTERNATIONAL OF WASH Q1-Mar.15 0.48 0.42 15.1 N/AV
Source: Thomson Reuters StreetEvents.
© 2015 Thomson Reuters. All marks herein are used under license. TRPR_82221_277 12
THOMSON REUTERS PROPRIETARY RESEARCH MAY 1, 2015
THIS WEEK IN EARNINGS
THURSDAY: MAY 7
Exhibit 4B. Thursday Earnings Calendar
Date Ticker Company Qtr Est Yr Ago % Dif Time
7-May-15 APA.N APACHE CORP Q1-Mar.15 -0.57 1.78 -132.2 8:00 AM
7-May-15 AEE.N AMEREN CORP Q1-Mar.15 0.38 0.40 -4.7 8:30 AM
7-May-15 BDX.N BECTON DICKINSON AND CO Q2-Mar.15 1.53 1.53 0.2 8:30 AM
7-May-15 PCLN.OQ PRICELINE GROUP INC Q1-Mar.15 7.71 7.81 -1.3 8:30 AM
7-May-15 PPL.N PPL CORP Q1-Mar.15 0.70 0.80 -12.9 8:30 AM
7-May-15 REGN.OQ REGENERON PHARMACEUTICALS INC Q1-Mar.15 2.71 2.26 20.0 8:30 AM
7-May-15 SIAL.OQ SIGMAALDRICH CORP Q1-Mar.15 1.08 1.06 1.9 8:30 AM
7-May-15 SNI.N SCRIPPS NETWORKS INTERACTIVE INC Q1-Mar.15 0.92 0.87 5.5 8:30 AM
7-May-15 TAP.N MOLSON COORS BREWING CO Q1-Mar.15 0.45 0.55 -18.5 8:30 AM
7-May-15 TDC.N TERADATA CORP Q1-Mar.15 0.42 0.54 -22.3 8:30 AM
7-May-15 CA.OQ CA INC Q4-Mar.15 0.50 0.61 -18.0 4:00 PM
7-May-15 CBS.N CBS CORP Q1-Mar.15 0.75 0.77 -2.5 4:00 PM
7-May-15 CERN.OQ CERNER CORP Q1-Mar.15 0.45 0.37 21.1 4:00 PM
7-May-15 MCHP.OQ MICROCHIP TECHNOLOGY INC Q4-Mar.15 0.67 0.64 4.2 4:00 PM
7-May-15 MHK.N MOHAWK INDS INC Q1-Mar.15 1.60 1.23 30.4 4:00 PM
7-May-15 MNST.OQ MONSTER BEVERAGE CORP Q1-Mar.15 0.68 0.55 24.3 4:00 PM
7-May-15 NVDA.OQ NVIDIA CORP Q1-Apr.15 0.26 0.21 23.3 4:00 PM
7-May-15 TSO.N TESORO CORP Q1-Mar.15 1.29 0.71 81.7 4:00 PM
7-May-15 LUK.N LEUCADIA NATIONAL CORP Q1-Mar.15 0.00 NA N/AV
Source: Thomson Reuters StreetEvents.
© 2015 Thomson Reuters. All marks herein are used under license. TRPR_82221_277 13
THOMSON REUTERS PROPRIETARY RESEARCH MAY 1, 2015
THIS WEEK IN EARNINGS
FRIDAY: MAY 8
Exhibit 5B. Friday Earnings Calendar
Date Ticker Company Qtr Est Yr Ago % Dif Time
8-May-15 HCN.N HEALTH CARE REIT INC Q1-Mar.15 1.04 1.00 3.8 8:30 AM
8-May-15 NRG.N NRG ENERGY INC Q1-Mar.15 0.24 -0.23 NA 8:30 AM
Source: Thomson Reuters StreetEvents.
© 2015 Thomson Reuters. All marks herein are used under license. TRPR_82221_277 14
THOMSON REUTERS PROPRIETARY RESEARCH MAY 1, 2015
THIS WEEK IN EARNINGS
SECTION C: EARNINGS DATA TABLES
Exhibit 1C. S&P 500: Q1 2015 Earnings Scorecard
Sector Above Match Below Surprise Reported Index
Consumer Discretionary 62% 10% 28% 0% 50 84
Consumer Staples 83% 9% 9% 7% 23 38
Energy 92% 0% 8% 32% 24 41
Financials 59% 18% 23% 5% 74 87
Health Care 82% 5% 13% 10% 38 55
Industrials 62% 10% 28% 0% 58 65
Materials 63% 4% 33% 8% 24 29
Technology 63% 13% 24% 6% 46 66
Telecom 100% 0% 0% 5% 3 5
Utilities 75% 5% 20% 12% 20 30
S&P 500 68% 10% 22% 7% 360 500
Source: Thomson Reuters I/B/E/S
Exhibit 2C. S&P 500: Q1 2015 Earnings Growth
Sector Today 1 Apr 1 Jan 1 Oct 1 Jul
Consumer Discretionary 5.7% 7.0% 14.6% 17.3% 18.2%
Consumer Staples 3.4% -0.6% 5.3% 8.8% 10.3%
Energy -54.5% -63.7% -32.2% 2.3% 5.7%
Financials 15.3% 10.9% 13.9% 15.5% 14.7%
Health Care 17.0% 7.2% 11.1% 12.4% 12.2%
Industrials 5.4% 7.5% 11.5% 13.4% 12.3%
Materials 3.7% -2.4% 17.0% 24.2% 22.1%
Technology 9.1% 4.2% 10.2% 12.0% 10.7%
Telecom 3.1% -0.9% 1.2% 7.6% 8.4%
Utilities 4.8% -6.7% -5.9% -5.2% -2.4%
S&P 500 2.0% -2.9% 5.3% 11.5% 11.7%
Source: Thomson Reuters I/B/E/S
Exhibit 3C. S&P 500: Q2 2015 Earnings Growth
Sector Today 1 Apr 1 Jan 1 Oct 1 Jul
Consumer Discretionary 9.8% 11.5% 16.6% 17.9% 19.9%
Consumer Staples -0.7% 0.0% 4.0% 7.5% 9.2%
Energy -67.2% -64.6% -31.6% 2.9% 10.5%
Financials 15.5% 16.1% 18.0% 20.2% 13.6%
Health Care 4.8% 5.1% 6.3% 7.8% 14.1%
Industrials 3.2% 7.0% 7.5% 9.5% 11.5%
Materials 3.3% 7.6% 14.6% 20.1% 25.9%
Technology 3.5% 6.1% 11.3% 13.2% 13.5%
Telecom 6.1% 3.4% 4.3% 8.3% 6.1%
Utilities 3.2% 4.8% 6.7% 6.3% 3.9%
S&P 500 -2.1% -0.4% 5.9% 11.9% 13.3%
Source: Thomson Reuters I/B/E/S
© 2015 Thomson Reuters. All marks herein are used under license. TRPR_82221_277 15
THOMSON REUTERS PROPRIETARY RESEARCH MAY 1, 2015
THIS WEEK IN EARNINGS
Exhibit 4C. S&P 500: Q3 2015 Earnings Growth
Sector Today 1 Apr 1 Jan 1 Oct
Consumer Discretionary 12.9% 13.4% 17.6% 20.3%
Consumer Staples 1.4% 2.2% 6.0% 10.0%
Energy -61.1% -58.6% -26.4% 12.7%
Financials 14.7% 16.1% 17.8% 23.0%
Health Care 7.0% 8.6% 10.3% 14.8%
Industrials 5.3% 11.1% 8.7% 12.1%
Materials 0.1% -1.0% 6.4% 17.1%
Technology 8.0% 9.4% 12.1% 15.8%
Telecom 7.6% 5.5% 5.6% 7.3%
Utilities 2.5% 3.8% 5.2% 4.0%
S&P 500 0.6% 2.3% 7.4% 15.4%
Source: Thomson Reuters I/B/E/S
Exhibit 5C. S&P 500: Q4 2015 Earnings Growth
Sector Today 1 Apr 1 Jan
Consumer Discretionary 13.7% 13.2% 18.2%
Consumer Staples 4.6% 5.0% 9.2%
Energy -41.1% -36.9% -1.8%
Financials 21.5% 22.9% 21.2%
Health Care 8.9% 9.1% 14.2%
Industrials 3.1% 7.8% 11.2%
Materials 4.0% 4.1% 19.7%
Technology 3.4% 4.2% 11.1%
Telecom 15.3% 12.9% 13.8%
Utilities 3.9% 4.6% 6.6%
S&P 500 5.2% 6.4% 12.9%
Source: Thomson Reuters I/B/E/S
Exhibit 6C. S&P 500: Q1 2016 Earnings Growth
Sector Today 1 Apr
Consumer Discretionary 20.1% 19.8%
Consumer Staples 6.6% 10.3%
Energy 8.4% 46.3%
Financials 6.4% 11.0%
Health Care 5.4% 17.1%
Industrials 9.6% 12.7%
Materials 15.0% 25.4%
Technology 8.8% 14.3%
Telecom 3.5% 4.8%
Utilities -5.5% 3.4%
S&P 500 8.4% 15.2%
Source: Thomson Reuters I/B/E/S
© 2015 Thomson Reuters. All marks herein are used under license. TRPR_82221_277 16
THOMSON REUTERS PROPRIETARY RESEARCH MAY 1, 2015
THIS WEEK IN EARNINGS
Exhibit 7C. S&P 500: CY 2015 Earnings Growth
Sector Today 1 Apr 1 Jan 1 Oct 1 Jul
Consumer Discretionary 10.6% 11.1% 16.9% 18.0% 18.0%
Consumer Staples 2.0% 2.0% 6.6% 9.0% 8.9%
Energy -58.5% -56.5% -23.3% 6.9% 6.5%
Financials 16.6% 16.0% 17.8% 16.7% 12.5%
Health Care 8.3% 7.7% 10.5% 11.6% 11.9%
Industrials 5.4% 9.8% 9.7% 11.5% 11.8%
Materials 1.5% 2.4% 14.7% 19.1% 20.2%
Technology 5.9% 6.0% 11.3% 12.5% 11.3%
Telecom 6.8% 4.6% 4.9% 6.5% 6.5%
Utilities 1.0% 0.9% 2.5% 2.8% 3.5%
S&P 500 1.2% 1.7% 8.1% 12.4% 11.5%
Source: Thomson Reuters I/B/E/S
Exhibit 8C. S&P 500: CY 2016 Earnings Growth
Sector Today 1 Apr 1 Jan 1 Oct 1 Jul
Consumer Discretionary 15.6% 15.0%
Consumer Staples 8.9% 9.0%
Energy 44.1% 46.1%
Financials 9.9% 10.5%
Health Care 13.0% 12.8%
Industrials 9.8% 8.6%
Materials 20.5% 20.3%
Technology 11.2% 11.9%
Telecom 4.1% 5.0%
Utilities 3.8% 4.1%
S&P 500 12.6% 12.8%
Source: Thomson Reuters I/B/E/S
Exhibit 9C. S&P 500: Bottoms-Up EPS Actuals and Estimates
Year Q1 Q2 Q3 Q4 CY
2004 15.87 16.74 16.59 17.83 67.10
2005 17.95 19.11 18.86 20.19 76.28
2006 20.73 22.31 22.60 22.44 88.18
2007 22.71 24.40 21.31 16.14 85.12
2008 18.96 19.78 17.49 5.62 65.47
2009 12.83 16.03 16.36 16.80 60.80
2010 19.71 21.48 21.75 22.55 85.28
2011 23.50 24.14 25.65 24.55 97.82
2012 25.60 25.84 26.00 26.32 103.80
2013 26.74 27.40 27.63 28.62 109.68
2014 28.18 30.07 30.04 30.54 118.78
2015 28.28 28.90 30.27 32.00 119.02
2016 31.06 33.02 34.50 36.28 134.18
2017 148.99
Source: Thomson Reuters I/B/E/S
© 2015 Thomson Reuters. All marks herein are used under license. TRPR_82221_277 17
THOMSON REUTERS PROPRIETARY RESEARCH MAY 1, 2015
THIS WEEK IN EARNINGS
Exhibit 10C. S&P 500: Actual Earnings Growth Rates
Sector 4Q14 3Q14 2Q14 1Q14 4Q13
Consumer Disc. 14.7% -1.8% 7.5% 8.8% 8.4%
Consumer Staples 1.2% 5.7% 7.8% 3.3% 4.1%
Energy -21.8% 10.3% 17.0% -0.1% -8.8%
Financials -3.3% 16.3% -6.6% -0.6% 24.7%
Health Care 22.3% 16.3% 18.5% 12.0% 9.7%
Industrials 15.0% 13.1% 11.4% 3.9% 14.2%
Materials 5.2% 20.7% 12.2% 0.0% 22.2%
Technology 18.0% 10.3% 15.3% 10.0% 10.3%
Telecom 7.3% 6.4% 6.8% 14.0% 25.0%
Utilities 9.6% 2.1% -0.1% 22.6% -5.9%
S&P 500 7.0% 10.3% 8.6% 5.6% 9.9%
Source: Thomson Reuters I/B/E/S
Exhibit 11C. S&P 500: Actual vs. Estimate (Above/Match/Below)
4Q14 3Q14 2Q14 1Q14 4Q13
Above 69% 74% 68% 68% 64%
Match 10% 7% 10% 9% 12%
Below 20% 19% 22% 23% 24%
Source: Thomson Reuters I/B/E/S
Exhibit 12C. S&P 500: Actual vs. Estimate (Aggregate Difference)
4Q14 3Q14 2Q14 1Q14 4Q13
Surprise Factor 3.7% 4.5% 2.7% 5.0% 3.2%
Source: Thomson Reuters I/B/E/S
© 2015 Thomson Reuters. All marks herein are used under license. TRPR_82221_277 18
THOMSON REUTERS PROPRIETARY RESEARCH MAY 1, 2015
THIS WEEK IN EARNINGS
NOTES / DEFINITIONS
ABOUT THOMSON REUTERS EIKON
Thomson Reuters Eikon is more comprehensive and collaborative than anything you’ve ever worked with. It is a real-time
research and portfolio management solution that delivers a broad and deep range of global financial content and insight.
You get direct, unfiltered access to industry-leading sources of financial information and analytics, all in a fully integrated
workspace designed to help you better analyze your investable universe and monitor your holdings. In a single application,
you can: access broker research, estimates, financials, events, news, fixed income and credit analysis, and more; conduct in-
depth portfolio analysis versus indices, sectors, and industries; investigate data aggregates and complex data relationships;
broaden your understanding of the credit markets; monitor negative developments and uncover new investment ideas. We
also provide effortless integration of our content into your proprietary spreadsheets, and allow you to stay connected to
critical portfolio information on your BlackBerry®.
ABOUT THOMSON REUTERS
Thomson Reuters is the world’s leading source of intelligent information for businesses and professionals. We combine
industry expertise with innovative technology to deliver critical information to leading decision makers in the financial, legal,
tax and accounting, scientific, healthcare and media markets, powered by the world’s most trusted news organization. With
headquarters in New York and major operations in London and Eagan, Minnesota, Thomson Reuters employs more than
50,000 people in 93 countries. Thomson Reuters shares are listed on the New York Stock Exchange (NYSE: TRI) and Toronto
Stock Exchange (TSX: TRI). For more information, go to www.thomsonreuters.com.
IMPORTANT NOTICE
This disclaimer is in addition to and not in replacement of any disclaimer of warranties and liabilities set forth in a written
agreement between Thomson Reuters and you or the party authorizing your access to the Service (“Contract Disclaimer”). In
the event of a conflict or inconsistency between this disclaimer and the Contract Disclaimer the terms of the Contract
Disclaimer shall control.
By accessing these materials, you hereby agree to the following:
These research reports and the information contained therein is for your internal use only and redistribution of this
information is expressly prohibited. These reports including the information and analysis, any opinion or recommendation is
not intended for investment purposes and does not constitute investment advice or an offer, or an invitation to make an offer,
to buy or sell any securities or any derivatives related to such securities.
Thomson Reuters does not warrant the accuracy of the reports for any particular purpose and expressly disclaims any
warranties of merchantability or fitness for a particular purpose; nor does Thomson Reuters guarantee the accuracy, validity,
timeliness or completeness of any information or data included in these reports for any particular purpose. Thomson Reuters
is under no obligation to provide you with any current or corrected information. Neither Thomson Reuters nor any of its
affiliates, directors, officers or employees, will be liable or have any responsibility of any kind for any loss or damage (whether
direct, indirect, consequential, or any other damages of any kind even if Thomson Reuters was advised of the possibility
thereof) that you incur in connection with, relating to or arising out of these materials or the analysis, views,
recommendations, opinions or information contained therein, or from any other cause relating to your access to, inability to
access, or use of these materials, whether or not the circumstances giving rise to such cause may have been within the
control of Thomson Reuters.
The information provided in these materials is not intended for distribution to, or use by, any person or entity in any
jurisdiction or country where such distribution or use would be contrary to law or regulation or which would subject Thomson
Reuters or its affiliates to any registration requirement within such jurisdiction or country.

More Related Content

What's hot

Before the Open April 12 2017
Before the Open April 12 2017Before the Open April 12 2017
Before the Open April 12 2017John Pendrith
 
Before the Open May 17 2017
Before the Open May 17 2017Before the Open May 17 2017
Before the Open May 17 2017John Pendrith
 
Before the Open March 10 2017
Before the Open March 10 2017Before the Open March 10 2017
Before the Open March 10 2017John Pendrith
 
15.5.8 gongwer news service - tot study colr
15.5.8   gongwer news service - tot study colr15.5.8   gongwer news service - tot study colr
15.5.8 gongwer news service - tot study colrhmhollingsworth
 
Northern Ireland new car sales
Northern Ireland new car salesNorthern Ireland new car sales
Northern Ireland new car salesRichard Ramsey
 
Before the Open April 27 2017
Before the Open April 27 2017Before the Open April 27 2017
Before the Open April 27 2017John Pendrith
 
Before the Open April 17 2017
Before the Open April 17 2017Before the Open April 17 2017
Before the Open April 17 2017John Pendrith
 
Cox Automotive Market Insight Overview June & H1 2019
Cox Automotive Market Insight Overview   June & H1 2019Cox Automotive Market Insight Overview   June & H1 2019
Cox Automotive Market Insight Overview June & H1 2019Philip Nothard
 
Before the Open April 20 2017
Before the Open April 20 2017Before the Open April 20 2017
Before the Open April 20 2017John Pendrith
 
National Employment Situation: January 2018
National Employment Situation: January 2018National Employment Situation: January 2018
National Employment Situation: January 2018DavidDominy1
 
February 2018 U.S. employment update and outlook
February 2018 U.S. employment update and outlookFebruary 2018 U.S. employment update and outlook
February 2018 U.S. employment update and outlookJLL
 
Before the Open March 29 2017
Before the Open March 29 2017Before the Open March 29 2017
Before the Open March 29 2017John Pendrith
 
Before the Open May 19 2017 (2)
Before the Open May 19 2017 (2)Before the Open May 19 2017 (2)
Before the Open May 19 2017 (2)John Pendrith
 
Weeklyaccchemistryandeconomicreport24 february 2017
Weeklyaccchemistryandeconomicreport24 february 2017Weeklyaccchemistryandeconomicreport24 february 2017
Weeklyaccchemistryandeconomicreport24 february 2017sanjayshah99
 
Before the Open April 21 2017
Before the Open April 21 2017Before the Open April 21 2017
Before the Open April 21 2017John Pendrith
 
Before the Open May 16 2017
Before the Open May 16 2017Before the Open May 16 2017
Before the Open May 16 2017John Pendrith
 
Before the open February 9 2017
Before the open February 9 2017Before the open February 9 2017
Before the open February 9 2017John Pendrith
 

What's hot (20)

Chamber presentation
Chamber presentationChamber presentation
Chamber presentation
 
Before the Open April 12 2017
Before the Open April 12 2017Before the Open April 12 2017
Before the Open April 12 2017
 
Yf econ update-2019-04_v1.0
Yf econ update-2019-04_v1.0Yf econ update-2019-04_v1.0
Yf econ update-2019-04_v1.0
 
Before the Open May 17 2017
Before the Open May 17 2017Before the Open May 17 2017
Before the Open May 17 2017
 
Before the Open March 10 2017
Before the Open March 10 2017Before the Open March 10 2017
Before the Open March 10 2017
 
15.5.8 gongwer news service - tot study colr
15.5.8   gongwer news service - tot study colr15.5.8   gongwer news service - tot study colr
15.5.8 gongwer news service - tot study colr
 
Northern Ireland new car sales
Northern Ireland new car salesNorthern Ireland new car sales
Northern Ireland new car sales
 
Before the Open April 27 2017
Before the Open April 27 2017Before the Open April 27 2017
Before the Open April 27 2017
 
HCUK-mid-year-review
HCUK-mid-year-reviewHCUK-mid-year-review
HCUK-mid-year-review
 
Before the Open April 17 2017
Before the Open April 17 2017Before the Open April 17 2017
Before the Open April 17 2017
 
Cox Automotive Market Insight Overview June & H1 2019
Cox Automotive Market Insight Overview   June & H1 2019Cox Automotive Market Insight Overview   June & H1 2019
Cox Automotive Market Insight Overview June & H1 2019
 
Before the Open April 20 2017
Before the Open April 20 2017Before the Open April 20 2017
Before the Open April 20 2017
 
National Employment Situation: January 2018
National Employment Situation: January 2018National Employment Situation: January 2018
National Employment Situation: January 2018
 
February 2018 U.S. employment update and outlook
February 2018 U.S. employment update and outlookFebruary 2018 U.S. employment update and outlook
February 2018 U.S. employment update and outlook
 
Before the Open March 29 2017
Before the Open March 29 2017Before the Open March 29 2017
Before the Open March 29 2017
 
Before the Open May 19 2017 (2)
Before the Open May 19 2017 (2)Before the Open May 19 2017 (2)
Before the Open May 19 2017 (2)
 
Weeklyaccchemistryandeconomicreport24 february 2017
Weeklyaccchemistryandeconomicreport24 february 2017Weeklyaccchemistryandeconomicreport24 february 2017
Weeklyaccchemistryandeconomicreport24 february 2017
 
Before the Open April 21 2017
Before the Open April 21 2017Before the Open April 21 2017
Before the Open April 21 2017
 
Before the Open May 16 2017
Before the Open May 16 2017Before the Open May 16 2017
Before the Open May 16 2017
 
Before the open February 9 2017
Before the open February 9 2017Before the open February 9 2017
Before the open February 9 2017
 

Viewers also liked

Open badget henkilöstökoulutuksissa
Open badget henkilöstökoulutuksissaOpen badget henkilöstökoulutuksissa
Open badget henkilöstökoulutuksissaMari Varonen
 
Bai giang tin hoc lop 8
Bai giang tin hoc lop 8Bai giang tin hoc lop 8
Bai giang tin hoc lop 8Hoa Phượng
 
Tadelakt Materiavera
Tadelakt MateriaveraTadelakt Materiavera
Tadelakt MateriaveraMateriavera
 
GCPUGと岡山支部のご紹介
GCPUGと岡山支部のご紹介GCPUGと岡山支部のご紹介
GCPUGと岡山支部のご紹介Ryuji Iwata
 
Η ιστορία των Hackers
Η ιστορία των HackersΗ ιστορία των Hackers
Η ιστορία των HackersTheodore Meimarakis
 
dịch vụ làm tvc quảng cáo độc đáo
dịch vụ làm tvc quảng cáo độc đáodịch vụ làm tvc quảng cáo độc đáo
dịch vụ làm tvc quảng cáo độc đáocharita143
 
nơi nào thiết kế tvc quảng cáo sản phẩm
nơi nào thiết kế tvc quảng cáo sản phẩmnơi nào thiết kế tvc quảng cáo sản phẩm
nơi nào thiết kế tvc quảng cáo sản phẩmflorencio329
 
Eserizio03 sandretti sasha copia
Eserizio03 sandretti sasha copiaEserizio03 sandretti sasha copia
Eserizio03 sandretti sasha copiaSashaSandretti
 
2015 sevenval device-trends-april
2015 sevenval device-trends-april2015 sevenval device-trends-april
2015 sevenval device-trends-aprilAvenga Germany GmbH
 
تقرير الدوحة، المنطقة العربية بين صعود تنظيم الدولة والانخراط الأميركي المتجدِّد
تقرير الدوحة، المنطقة العربية بين صعود تنظيم الدولة والانخراط الأميركي المتجدِّدتقرير الدوحة، المنطقة العربية بين صعود تنظيم الدولة والانخراط الأميركي المتجدِّد
تقرير الدوحة، المنطقة العربية بين صعود تنظيم الدولة والانخراط الأميركي المتجدِّدAbdulkareem Ajjour
 
2015 us young lions competitions assignment brief
2015 us young lions competitions   assignment brief2015 us young lions competitions   assignment brief
2015 us young lions competitions assignment briefPR Council
 
Bireysel Bağışçıya Hazır Mısınız?
Bireysel Bağışçıya Hazır Mısınız?Bireysel Bağışçıya Hazır Mısınız?
Bireysel Bağışçıya Hazır Mısınız?I. Renay Onur
 
Build my Dream Sims 4 Opdracht 1 By Devely
Build my Dream Sims 4 Opdracht 1 By DevelyBuild my Dream Sims 4 Opdracht 1 By Devely
Build my Dream Sims 4 Opdracht 1 By DevelyDevely
 
ใบงานที่1 แบบสำรวจตัวเอง
ใบงานที่1 แบบสำรวจตัวเองใบงานที่1 แบบสำรวจตัวเอง
ใบงานที่1 แบบสำรวจตัวเองjinoom
 
Το ασχημόπαπο: Ένα παραμύθι για τα πειράγματα μεταξύ παιδιών
Το ασχημόπαπο: Ένα παραμύθι για τα πειράγματα μεταξύ παιδιώνΤο ασχημόπαπο: Ένα παραμύθι για τα πειράγματα μεταξύ παιδιών
Το ασχημόπαπο: Ένα παραμύθι για τα πειράγματα μεταξύ παιδιώνparentbook
 
Final Report Literature Review
Final Report Literature ReviewFinal Report Literature Review
Final Report Literature ReviewJarett Pederson
 
Wordpress 4. come scrivere SEO
Wordpress 4. come scrivere SEOWordpress 4. come scrivere SEO
Wordpress 4. come scrivere SEOCity Planner
 

Viewers also liked (20)

Open badget henkilöstökoulutuksissa
Open badget henkilöstökoulutuksissaOpen badget henkilöstökoulutuksissa
Open badget henkilöstökoulutuksissa
 
комедия
комедиякомедия
комедия
 
Bai giang tin hoc lop 8
Bai giang tin hoc lop 8Bai giang tin hoc lop 8
Bai giang tin hoc lop 8
 
Tadelakt Materiavera
Tadelakt MateriaveraTadelakt Materiavera
Tadelakt Materiavera
 
GCPUGと岡山支部のご紹介
GCPUGと岡山支部のご紹介GCPUGと岡山支部のご紹介
GCPUGと岡山支部のご紹介
 
Η ιστορία των Hackers
Η ιστορία των HackersΗ ιστορία των Hackers
Η ιστορία των Hackers
 
dịch vụ làm tvc quảng cáo độc đáo
dịch vụ làm tvc quảng cáo độc đáodịch vụ làm tvc quảng cáo độc đáo
dịch vụ làm tvc quảng cáo độc đáo
 
nơi nào thiết kế tvc quảng cáo sản phẩm
nơi nào thiết kế tvc quảng cáo sản phẩmnơi nào thiết kế tvc quảng cáo sản phẩm
nơi nào thiết kế tvc quảng cáo sản phẩm
 
Eserizio03 sandretti sasha copia
Eserizio03 sandretti sasha copiaEserizio03 sandretti sasha copia
Eserizio03 sandretti sasha copia
 
2015 sevenval device-trends-april
2015 sevenval device-trends-april2015 sevenval device-trends-april
2015 sevenval device-trends-april
 
Better Burger
Better BurgerBetter Burger
Better Burger
 
Transformacija
TransformacijaTransformacija
Transformacija
 
تقرير الدوحة، المنطقة العربية بين صعود تنظيم الدولة والانخراط الأميركي المتجدِّد
تقرير الدوحة، المنطقة العربية بين صعود تنظيم الدولة والانخراط الأميركي المتجدِّدتقرير الدوحة، المنطقة العربية بين صعود تنظيم الدولة والانخراط الأميركي المتجدِّد
تقرير الدوحة، المنطقة العربية بين صعود تنظيم الدولة والانخراط الأميركي المتجدِّد
 
2015 us young lions competitions assignment brief
2015 us young lions competitions   assignment brief2015 us young lions competitions   assignment brief
2015 us young lions competitions assignment brief
 
Bireysel Bağışçıya Hazır Mısınız?
Bireysel Bağışçıya Hazır Mısınız?Bireysel Bağışçıya Hazır Mısınız?
Bireysel Bağışçıya Hazır Mısınız?
 
Build my Dream Sims 4 Opdracht 1 By Devely
Build my Dream Sims 4 Opdracht 1 By DevelyBuild my Dream Sims 4 Opdracht 1 By Devely
Build my Dream Sims 4 Opdracht 1 By Devely
 
ใบงานที่1 แบบสำรวจตัวเอง
ใบงานที่1 แบบสำรวจตัวเองใบงานที่1 แบบสำรวจตัวเอง
ใบงานที่1 แบบสำรวจตัวเอง
 
Το ασχημόπαπο: Ένα παραμύθι για τα πειράγματα μεταξύ παιδιών
Το ασχημόπαπο: Ένα παραμύθι για τα πειράγματα μεταξύ παιδιώνΤο ασχημόπαπο: Ένα παραμύθι για τα πειράγματα μεταξύ παιδιών
Το ασχημόπαπο: Ένα παραμύθι για τα πειράγματα μεταξύ παιδιών
 
Final Report Literature Review
Final Report Literature ReviewFinal Report Literature Review
Final Report Literature Review
 
Wordpress 4. come scrivere SEO
Wordpress 4. come scrivere SEOWordpress 4. come scrivere SEO
Wordpress 4. come scrivere SEO
 

Similar to This Week In Earnings - May 1, 2015

The Deloitte CFO Survey 2015 Q1
The Deloitte CFO Survey 2015 Q1The Deloitte CFO Survey 2015 Q1
The Deloitte CFO Survey 2015 Q1Deloitte UK
 
Market Perspective-November 2015
Market Perspective-November 2015 Market Perspective-November 2015
Market Perspective-November 2015 David Berger
 
Market perspective June 2015
Market perspective   June 2015Market perspective   June 2015
Market perspective June 2015David Berger
 
Q215 investor call slides final
Q215 investor call slides finalQ215 investor call slides final
Q215 investor call slides finalbroadwind
 
Market perspective november 2015
Market perspective   november 2015Market perspective   november 2015
Market perspective november 2015James Waller
 
Market Perspective November 2015
Market Perspective November 2015Market Perspective November 2015
Market Perspective November 2015Mark Biegel
 
Market Perspective - November 2015
Market Perspective - November 2015Market Perspective - November 2015
Market Perspective - November 2015James Waller
 
A Macro View Through the Micro Lens
A Macro View Through the Micro LensA Macro View Through the Micro Lens
A Macro View Through the Micro LensPranav Ghai
 
Cw 1 q18 earnings presentation final (1)
Cw 1 q18 earnings presentation final (1)Cw 1 q18 earnings presentation final (1)
Cw 1 q18 earnings presentation final (1)q4curtisswright
 
Financial Markets Review (July 2015)
Financial Markets Review (July 2015) Financial Markets Review (July 2015)
Financial Markets Review (July 2015) Snam
 
Q1 2016 3 m earnings conference
Q1 2016 3 m earnings conferenceQ1 2016 3 m earnings conference
Q1 2016 3 m earnings conferenceInvestors_3M
 
TMUS Q1 2014 Earnings Slide Presentation
TMUS Q1 2014 Earnings Slide PresentationTMUS Q1 2014 Earnings Slide Presentation
TMUS Q1 2014 Earnings Slide PresentationTMUS_IR
 
Klöckner & Co - Q1 2013 Results
Klöckner & Co - Q1 2013 ResultsKlöckner & Co - Q1 2013 Results
Klöckner & Co - Q1 2013 ResultsKlöckner & Co SE
 
Sector Updates: Air Conditioner Sector Institutional Research Report | HDFC s...
Sector Updates: Air Conditioner Sector Institutional Research Report | HDFC s...Sector Updates: Air Conditioner Sector Institutional Research Report | HDFC s...
Sector Updates: Air Conditioner Sector Institutional Research Report | HDFC s...hdfcsecurities1
 
Zep q1 2015
Zep q1 2015Zep q1 2015
Zep q1 2015Zep Inc.
 
Trc q1 2016 earnings slides final
Trc q1 2016 earnings slides finalTrc q1 2016 earnings slides final
Trc q1 2016 earnings slides finaltrcsolutions
 
The Deloitte CFO Survey: 2015 Q4 A cautious start to 2016
The Deloitte CFO Survey: 2015 Q4 A cautious start to 2016The Deloitte CFO Survey: 2015 Q4 A cautious start to 2016
The Deloitte CFO Survey: 2015 Q4 A cautious start to 2016Deloitte UK
 
Market Perspective June 2015
Market Perspective June 2015Market Perspective June 2015
Market Perspective June 2015David Berger
 
Q1 2015 3 m earnings presentation
Q1 2015 3 m earnings presentationQ1 2015 3 m earnings presentation
Q1 2015 3 m earnings presentationInvestors_3M
 

Similar to This Week In Earnings - May 1, 2015 (20)

The Deloitte CFO Survey 2015 Q1
The Deloitte CFO Survey 2015 Q1The Deloitte CFO Survey 2015 Q1
The Deloitte CFO Survey 2015 Q1
 
Market Perspective-November 2015
Market Perspective-November 2015 Market Perspective-November 2015
Market Perspective-November 2015
 
Market perspective June 2015
Market perspective   June 2015Market perspective   June 2015
Market perspective June 2015
 
Q215 investor call slides final
Q215 investor call slides finalQ215 investor call slides final
Q215 investor call slides final
 
Travis Perkins PLC Research Report
Travis Perkins PLC Research Report Travis Perkins PLC Research Report
Travis Perkins PLC Research Report
 
Market perspective november 2015
Market perspective   november 2015Market perspective   november 2015
Market perspective november 2015
 
Market Perspective November 2015
Market Perspective November 2015Market Perspective November 2015
Market Perspective November 2015
 
Market Perspective - November 2015
Market Perspective - November 2015Market Perspective - November 2015
Market Perspective - November 2015
 
A Macro View Through the Micro Lens
A Macro View Through the Micro LensA Macro View Through the Micro Lens
A Macro View Through the Micro Lens
 
Cw 1 q18 earnings presentation final (1)
Cw 1 q18 earnings presentation final (1)Cw 1 q18 earnings presentation final (1)
Cw 1 q18 earnings presentation final (1)
 
Financial Markets Review (July 2015)
Financial Markets Review (July 2015) Financial Markets Review (July 2015)
Financial Markets Review (July 2015)
 
Q1 2016 3 m earnings conference
Q1 2016 3 m earnings conferenceQ1 2016 3 m earnings conference
Q1 2016 3 m earnings conference
 
TMUS Q1 2014 Earnings Slide Presentation
TMUS Q1 2014 Earnings Slide PresentationTMUS Q1 2014 Earnings Slide Presentation
TMUS Q1 2014 Earnings Slide Presentation
 
Klöckner & Co - Q1 2013 Results
Klöckner & Co - Q1 2013 ResultsKlöckner & Co - Q1 2013 Results
Klöckner & Co - Q1 2013 Results
 
Sector Updates: Air Conditioner Sector Institutional Research Report | HDFC s...
Sector Updates: Air Conditioner Sector Institutional Research Report | HDFC s...Sector Updates: Air Conditioner Sector Institutional Research Report | HDFC s...
Sector Updates: Air Conditioner Sector Institutional Research Report | HDFC s...
 
Zep q1 2015
Zep q1 2015Zep q1 2015
Zep q1 2015
 
Trc q1 2016 earnings slides final
Trc q1 2016 earnings slides finalTrc q1 2016 earnings slides final
Trc q1 2016 earnings slides final
 
The Deloitte CFO Survey: 2015 Q4 A cautious start to 2016
The Deloitte CFO Survey: 2015 Q4 A cautious start to 2016The Deloitte CFO Survey: 2015 Q4 A cautious start to 2016
The Deloitte CFO Survey: 2015 Q4 A cautious start to 2016
 
Market Perspective June 2015
Market Perspective June 2015Market Perspective June 2015
Market Perspective June 2015
 
Q1 2015 3 m earnings presentation
Q1 2015 3 m earnings presentationQ1 2015 3 m earnings presentation
Q1 2015 3 m earnings presentation
 

Recently uploaded

Call Girls Service Nagpur Maya Call 7001035870 Meet With Nagpur Escorts
Call Girls Service Nagpur Maya Call 7001035870 Meet With Nagpur EscortsCall Girls Service Nagpur Maya Call 7001035870 Meet With Nagpur Escorts
Call Girls Service Nagpur Maya Call 7001035870 Meet With Nagpur Escortsranjana rawat
 
VIP High Class Call Girls Saharanpur Anushka 8250192130 Independent Escort Se...
VIP High Class Call Girls Saharanpur Anushka 8250192130 Independent Escort Se...VIP High Class Call Girls Saharanpur Anushka 8250192130 Independent Escort Se...
VIP High Class Call Girls Saharanpur Anushka 8250192130 Independent Escort Se...Suhani Kapoor
 
High Class Call Girls Nashik Maya 7001305949 Independent Escort Service Nashik
High Class Call Girls Nashik Maya 7001305949 Independent Escort Service NashikHigh Class Call Girls Nashik Maya 7001305949 Independent Escort Service Nashik
High Class Call Girls Nashik Maya 7001305949 Independent Escort Service NashikCall Girls in Nagpur High Profile
 
Interimreport1 January–31 March2024 Elo Mutual Pension Insurance Company
Interimreport1 January–31 March2024 Elo Mutual Pension Insurance CompanyInterimreport1 January–31 March2024 Elo Mutual Pension Insurance Company
Interimreport1 January–31 March2024 Elo Mutual Pension Insurance CompanyTyöeläkeyhtiö Elo
 
VIP Kolkata Call Girl Jodhpur Park 👉 8250192130 Available With Room
VIP Kolkata Call Girl Jodhpur Park 👉 8250192130  Available With RoomVIP Kolkata Call Girl Jodhpur Park 👉 8250192130  Available With Room
VIP Kolkata Call Girl Jodhpur Park 👉 8250192130 Available With Roomdivyansh0kumar0
 
Vip B Aizawl Call Girls #9907093804 Contact Number Escorts Service Aizawl
Vip B Aizawl Call Girls #9907093804 Contact Number Escorts Service AizawlVip B Aizawl Call Girls #9907093804 Contact Number Escorts Service Aizawl
Vip B Aizawl Call Girls #9907093804 Contact Number Escorts Service Aizawlmakika9823
 
High Class Call Girls Nagpur Grishma Call 7001035870 Meet With Nagpur Escorts
High Class Call Girls Nagpur Grishma Call 7001035870 Meet With Nagpur EscortsHigh Class Call Girls Nagpur Grishma Call 7001035870 Meet With Nagpur Escorts
High Class Call Girls Nagpur Grishma Call 7001035870 Meet With Nagpur Escortsranjana rawat
 
Malad Call Girl in Services 9892124323 | ₹,4500 With Room Free Delivery
Malad Call Girl in Services  9892124323 | ₹,4500 With Room Free DeliveryMalad Call Girl in Services  9892124323 | ₹,4500 With Room Free Delivery
Malad Call Girl in Services 9892124323 | ₹,4500 With Room Free DeliveryPooja Nehwal
 
Instant Issue Debit Cards - School Designs
Instant Issue Debit Cards - School DesignsInstant Issue Debit Cards - School Designs
Instant Issue Debit Cards - School Designsegoetzinger
 
Quantitative Analysis of Retail Sector Companies
Quantitative Analysis of Retail Sector CompaniesQuantitative Analysis of Retail Sector Companies
Quantitative Analysis of Retail Sector Companiesprashantbhati354
 
Stock Market Brief Deck for 4/24/24 .pdf
Stock Market Brief Deck for 4/24/24 .pdfStock Market Brief Deck for 4/24/24 .pdf
Stock Market Brief Deck for 4/24/24 .pdfMichael Silva
 
Russian Call Girls In Gtb Nagar (Delhi) 9711199012 💋✔💕😘 Naughty Call Girls Se...
Russian Call Girls In Gtb Nagar (Delhi) 9711199012 💋✔💕😘 Naughty Call Girls Se...Russian Call Girls In Gtb Nagar (Delhi) 9711199012 💋✔💕😘 Naughty Call Girls Se...
Russian Call Girls In Gtb Nagar (Delhi) 9711199012 💋✔💕😘 Naughty Call Girls Se...shivangimorya083
 
Financial institutions facilitate financing, economic transactions, issue fun...
Financial institutions facilitate financing, economic transactions, issue fun...Financial institutions facilitate financing, economic transactions, issue fun...
Financial institutions facilitate financing, economic transactions, issue fun...Avanish Goel
 
Chapter 2.ppt of macroeconomics by mankiw 9th edition
Chapter 2.ppt of macroeconomics by mankiw 9th editionChapter 2.ppt of macroeconomics by mankiw 9th edition
Chapter 2.ppt of macroeconomics by mankiw 9th editionMuhammadHusnain82237
 
VIP Call Girls Service Dilsukhnagar Hyderabad Call +91-8250192130
VIP Call Girls Service Dilsukhnagar Hyderabad Call +91-8250192130VIP Call Girls Service Dilsukhnagar Hyderabad Call +91-8250192130
VIP Call Girls Service Dilsukhnagar Hyderabad Call +91-8250192130Suhani Kapoor
 
(DIYA) Bhumkar Chowk Call Girls Just Call 7001035870 [ Cash on Delivery ] Pun...
(DIYA) Bhumkar Chowk Call Girls Just Call 7001035870 [ Cash on Delivery ] Pun...(DIYA) Bhumkar Chowk Call Girls Just Call 7001035870 [ Cash on Delivery ] Pun...
(DIYA) Bhumkar Chowk Call Girls Just Call 7001035870 [ Cash on Delivery ] Pun...ranjana rawat
 
BPPG response - Options for Defined Benefit schemes - 19Apr24.pdf
BPPG response - Options for Defined Benefit schemes - 19Apr24.pdfBPPG response - Options for Defined Benefit schemes - 19Apr24.pdf
BPPG response - Options for Defined Benefit schemes - 19Apr24.pdfHenry Tapper
 
Lundin Gold April 2024 Corporate Presentation v4.pdf
Lundin Gold April 2024 Corporate Presentation v4.pdfLundin Gold April 2024 Corporate Presentation v4.pdf
Lundin Gold April 2024 Corporate Presentation v4.pdfAdnet Communications
 

Recently uploaded (20)

🔝9953056974 🔝Call Girls In Dwarka Escort Service Delhi NCR
🔝9953056974 🔝Call Girls In Dwarka Escort Service Delhi NCR🔝9953056974 🔝Call Girls In Dwarka Escort Service Delhi NCR
🔝9953056974 🔝Call Girls In Dwarka Escort Service Delhi NCR
 
Call Girls Service Nagpur Maya Call 7001035870 Meet With Nagpur Escorts
Call Girls Service Nagpur Maya Call 7001035870 Meet With Nagpur EscortsCall Girls Service Nagpur Maya Call 7001035870 Meet With Nagpur Escorts
Call Girls Service Nagpur Maya Call 7001035870 Meet With Nagpur Escorts
 
Commercial Bank Economic Capsule - April 2024
Commercial Bank Economic Capsule - April 2024Commercial Bank Economic Capsule - April 2024
Commercial Bank Economic Capsule - April 2024
 
VIP High Class Call Girls Saharanpur Anushka 8250192130 Independent Escort Se...
VIP High Class Call Girls Saharanpur Anushka 8250192130 Independent Escort Se...VIP High Class Call Girls Saharanpur Anushka 8250192130 Independent Escort Se...
VIP High Class Call Girls Saharanpur Anushka 8250192130 Independent Escort Se...
 
High Class Call Girls Nashik Maya 7001305949 Independent Escort Service Nashik
High Class Call Girls Nashik Maya 7001305949 Independent Escort Service NashikHigh Class Call Girls Nashik Maya 7001305949 Independent Escort Service Nashik
High Class Call Girls Nashik Maya 7001305949 Independent Escort Service Nashik
 
Interimreport1 January–31 March2024 Elo Mutual Pension Insurance Company
Interimreport1 January–31 March2024 Elo Mutual Pension Insurance CompanyInterimreport1 January–31 March2024 Elo Mutual Pension Insurance Company
Interimreport1 January–31 March2024 Elo Mutual Pension Insurance Company
 
VIP Kolkata Call Girl Jodhpur Park 👉 8250192130 Available With Room
VIP Kolkata Call Girl Jodhpur Park 👉 8250192130  Available With RoomVIP Kolkata Call Girl Jodhpur Park 👉 8250192130  Available With Room
VIP Kolkata Call Girl Jodhpur Park 👉 8250192130 Available With Room
 
Vip B Aizawl Call Girls #9907093804 Contact Number Escorts Service Aizawl
Vip B Aizawl Call Girls #9907093804 Contact Number Escorts Service AizawlVip B Aizawl Call Girls #9907093804 Contact Number Escorts Service Aizawl
Vip B Aizawl Call Girls #9907093804 Contact Number Escorts Service Aizawl
 
High Class Call Girls Nagpur Grishma Call 7001035870 Meet With Nagpur Escorts
High Class Call Girls Nagpur Grishma Call 7001035870 Meet With Nagpur EscortsHigh Class Call Girls Nagpur Grishma Call 7001035870 Meet With Nagpur Escorts
High Class Call Girls Nagpur Grishma Call 7001035870 Meet With Nagpur Escorts
 
Malad Call Girl in Services 9892124323 | ₹,4500 With Room Free Delivery
Malad Call Girl in Services  9892124323 | ₹,4500 With Room Free DeliveryMalad Call Girl in Services  9892124323 | ₹,4500 With Room Free Delivery
Malad Call Girl in Services 9892124323 | ₹,4500 With Room Free Delivery
 
Instant Issue Debit Cards - School Designs
Instant Issue Debit Cards - School DesignsInstant Issue Debit Cards - School Designs
Instant Issue Debit Cards - School Designs
 
Quantitative Analysis of Retail Sector Companies
Quantitative Analysis of Retail Sector CompaniesQuantitative Analysis of Retail Sector Companies
Quantitative Analysis of Retail Sector Companies
 
Stock Market Brief Deck for 4/24/24 .pdf
Stock Market Brief Deck for 4/24/24 .pdfStock Market Brief Deck for 4/24/24 .pdf
Stock Market Brief Deck for 4/24/24 .pdf
 
Russian Call Girls In Gtb Nagar (Delhi) 9711199012 💋✔💕😘 Naughty Call Girls Se...
Russian Call Girls In Gtb Nagar (Delhi) 9711199012 💋✔💕😘 Naughty Call Girls Se...Russian Call Girls In Gtb Nagar (Delhi) 9711199012 💋✔💕😘 Naughty Call Girls Se...
Russian Call Girls In Gtb Nagar (Delhi) 9711199012 💋✔💕😘 Naughty Call Girls Se...
 
Financial institutions facilitate financing, economic transactions, issue fun...
Financial institutions facilitate financing, economic transactions, issue fun...Financial institutions facilitate financing, economic transactions, issue fun...
Financial institutions facilitate financing, economic transactions, issue fun...
 
Chapter 2.ppt of macroeconomics by mankiw 9th edition
Chapter 2.ppt of macroeconomics by mankiw 9th editionChapter 2.ppt of macroeconomics by mankiw 9th edition
Chapter 2.ppt of macroeconomics by mankiw 9th edition
 
VIP Call Girls Service Dilsukhnagar Hyderabad Call +91-8250192130
VIP Call Girls Service Dilsukhnagar Hyderabad Call +91-8250192130VIP Call Girls Service Dilsukhnagar Hyderabad Call +91-8250192130
VIP Call Girls Service Dilsukhnagar Hyderabad Call +91-8250192130
 
(DIYA) Bhumkar Chowk Call Girls Just Call 7001035870 [ Cash on Delivery ] Pun...
(DIYA) Bhumkar Chowk Call Girls Just Call 7001035870 [ Cash on Delivery ] Pun...(DIYA) Bhumkar Chowk Call Girls Just Call 7001035870 [ Cash on Delivery ] Pun...
(DIYA) Bhumkar Chowk Call Girls Just Call 7001035870 [ Cash on Delivery ] Pun...
 
BPPG response - Options for Defined Benefit schemes - 19Apr24.pdf
BPPG response - Options for Defined Benefit schemes - 19Apr24.pdfBPPG response - Options for Defined Benefit schemes - 19Apr24.pdf
BPPG response - Options for Defined Benefit schemes - 19Apr24.pdf
 
Lundin Gold April 2024 Corporate Presentation v4.pdf
Lundin Gold April 2024 Corporate Presentation v4.pdfLundin Gold April 2024 Corporate Presentation v4.pdf
Lundin Gold April 2024 Corporate Presentation v4.pdf
 

This Week In Earnings - May 1, 2015

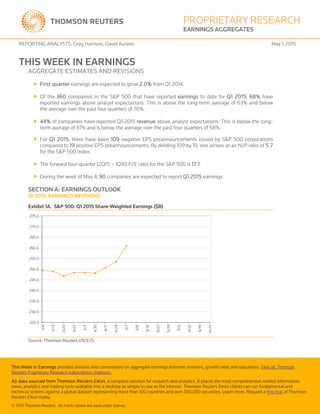
  • 1. This Week in Earnings provides analysis and commentary on aggregate earnings estimate revisions, growth rates and valuations. View all Thomson Reuters Proprietary Research subscription channels. All data sourced from Thomson Reuters Eikon, a complete solution for research and analytics. It places the most comprehensive market information, news, analytics and trading tools available into a desktop as simple to use as the Internet. Thomson Reuters Eikon clients can run fundamental and technical screens against a global dataset representing more than 100 countries and over 200,000 securities. Learn more. Request a free trial of Thomson Reuters Eikon today. © 2015 Thomson Reuters. All marks herein are used under license. PROPRIETARY RESEARCH EARNINGS AGGREGATES REPORTING ANALYSTS: Greg Harrison, David Aurelio May 1, 2015 THIS WEEK IN EARNINGS AGGREGATE ESTIMATES AND REVISIONS  First quarter earnings are expected to grow 2.0% from Q1 2014.  Of the 360 companies in the S&P 500 that have reported earnings to date for Q1 2015, 68% have reported earnings above analyst expectations. This is above the long-term average of 63% and below the average over the past four quarters of 70%.  44% of companies have reported Q1 2015 revenue above analyst expectations. This is below the long- term average of 61% and is below the average over the past four quarters of 58%.  For Q1 2015, there have been 109 negative EPS preannouncements issued by S&P 500 corporations compared to 19 positive EPS preannouncements. By dividing 109 by 19, one arrives at an N/P ratio of 5.7 for the S&P 500 Index.  The forward four-quarter (2Q15 – 1Q16) P/E ratio for the S&P 500 is 17.1.  During the week of May 4, 90 companies are expected to report Q1 2015 earnings. SECTION A: EARNINGS OUTLOOK Q1 2015: EARNINGS REVISIONS Exhibit 1A. S&P 500: Q1 2015 Share-Weighted Earnings ($B) Source: Thomson Reuters I/B/E/S 225.0 230.0 235.0 240.0 245.0 250.0 255.0 260.0 265.0 270.0 275.0 3/6 3/13 3/20 3/27 4/3 4/10 4/17 4/24 5/1 5/8 5/15 5/22 5/29 6/5 6/12 6/19 6/26
  • 2. © 2015 Thomson Reuters. All marks herein are used under license. TRPR_82221_277 2 THOMSON REUTERS PROPRIETARY RESEARCH MAY 1, 2015 THIS WEEK IN EARNINGS There has been a decrease in the share-weighted earnings for the S&P 500 since the start of the quarter (to $260.9B from $265.4B). Six of the ten sectors have experienced downward revisions to estimates. Since January 1, the Energy (-33.6%) and Materials (-12.2%) sectors have recorded the highest percentage decreases in earnings, while the Utilities (11.6%) sector has recorded the highest percentage increase in earnings. Overall, share-weighted earnings for the S&P 500 have decreased by 1.7% since the start of the quarter. Since January 1, the Energy (-$7.0B) and Consumer Discretionary (-$2.3B) sectors have recorded the highest dollar-level decreases in earnings, while the Financials ($4.8B) sector has recorded the highest dollar-level increase in earnings. Overall, expected share-weighted earnings for the S&P 500 have decreased by $4.5B since the start of the quarter. OBSERVATIONS: S&P 500 EARNINGS BACK IN BLACK The busiest week of this quarter’s earnings season ended on a positive note. Better than expected earnings results from the 159 of the S&P 500’s constituents that reported the week of May 1st saw 65% of corporate earnings come in ahead of Q1 2015 estimates. As a result, the index saw earnings growth expectations for the first quarter of 2015 cross into the black, and is now expected to grow 2.0% from the prior year. This is a substantial improvement from last week when earnings were expected to decline 2.3%, which would have been the first negative growth rate since Q3 2009. Exhibit 2A. S&P 500: Q1 2015 Earnings vs. Expectations – Companies Reporting April 27 – May 1 Reported Reported Index Sector Above % Match % Below % This Week Total # Total # Consumer Discretionary 53% 5% 42% 19 50 84 Consumer Staples 67% 17% 17% 6 23 38 Energy 100% 0% 0% 14 24 41 Financials 59% 16% 25% 32 74 87 Health Care 81% 10% 10% 21 38 55 Industrials 43% 17% 39% 23 58 65 Materials 62% 0% 38% 13 24 29 Technology 69% 8% 23% 13 46 66 Telecom Services 100% 0% 0% 1 3 5 Utilities 71% 6% 24% 17 20 30 S&P 500 65.4% 9.4% 25.2% 159 360 500 Source: Thomson Reuters I/B/E/S Not only was this the busiest week for S&P 500 reporting, but also the most important because results from the energy sector could change the outlook for the index. Fortunately, analysts severely underestimated the sectors’ ability to generate earnings this quarter. All 14 of the companies within the sector that reported the week ending May 1st, beat earnings estimates, and ten reported double digit earnings surprise percentages. This helped to bring overall earnings for the sector in 31.8% above estimates. As a result the energy sector’s earnings growth expectations for Q1 2015 improved 9.7 percentage points from the prior week, and are now expected to decline 54.5%. While this large improvement was a major contributor to the index turning positive, the sector is still a major drag on the S&P 500. When the energy sector is excluded, the S&P 500’s Q1 2015 earnings growth expectations increase to 9.7% from 2.0% when they are included. The revenue picture for the energy sector was not as glamorous. Of the 14 sector’s constituents that reported during the week ending May 1st, only eight beat Q1 2015 revenue estimates. Results for the quarter have come in 8.9% higher than expected and the sector is now expected to decline 33.6% from Q1 2014, a 4.1 percentage point improvement from the prior week. One of the reasons for the discrepancy in performance between earnings and revenue results vs. estimates for the energy sector has to do with efficiency improvements.
  • 3. © 2015 Thomson Reuters. All marks herein are used under license. TRPR_82221_277 3 THOMSON REUTERS PROPRIETARY RESEARCH MAY 1, 2015 THIS WEEK IN EARNINGS In comparison to expectations, both of the heavy hitters within the energy sector, Exxon Mobile Corp. (XOM.N) and Chevron Corp. (XOM.N), knocked earnings and revenue results out of the park. Chevron reported Q1 2015 earnings of $1.37 per share for a surprise of 73.4%, and revenue of $34.6 billion, 41.8% above estimates. Exxon reported earnings of $1.17 per share compared to the mean estimate of $0.83 per share, and revenue of $67.6 billion for a surprise of 32.0%. There were a few additional positive surprises as well. Given the overall concern for US multinationals in regard to the dollar, Chevron’s $580 million benefit in the quarter as a result of foreign currency exchange rates was an unexpected gain. However, it should be noted that this is mostly due to balance sheet translation and won’t have a substantial impact to cash. Additionally, Exxon increased its dividend per shares by 5.3% to $0.73. The two Integrated Oil & Gas sub-industry companies saw benefits to their downstream businesses due to stronger worldwide refining and marketing margins, but had severe declines in upstream as a result of substantial declines in crude. Both companies shared two of common themes with the sector, an emphasis on expectations for increased production to continue, and implementation of cost saving measures. Chevron expects to save $35 billion this year, while Exxon has signaled a target of $34 billion. Integrated Oil & Gas wasn’t the only big winner. CONSOL Energy Inc.’s (CNX.N) earnings of $0.37 per share led to a surprise of 184.6%, which was the largest of any constituent within the index. While this was a great surprise, low coal prices fueled by low natural gas continue to be an issue and earnings for the quarter were down 26% from the prior year. Revenue slightly topped estimates by 0.3% at $890 million, down 8% from Q1 2014. Better margins on coal helped CONSOL’s earnings, but the big boost came from a negative 48% effective tax rate related to the percentage depletion of its coal operations. However, looking forward commodity pricing for coal is expected to remain a challenge. Jim Grech, Chief Commercial Officer for CONSOL Energy, said during the April 28th conference call, “For 2015 right now, we see the current markets since the beginning of the year as being -- and I'll call it the spot markets -- as being relatively weak and it's led to us taking advantage of the assets we have and the strength we have to go to the export market. And we see that weakness continuing here through the second quarter, summer, and as we get to later in the year, there is some potential for some change. We have some indications of some spot coal, and we've made some small sales a little further out in a year. But the weakness that we've seen through the first quarter we expect to continue through the second quarter, and with some potential for some changes we get to later in the year are going to be highly dependent on weather and gas prices.”
  • 4. © 2015 Thomson Reuters. All marks herein are used under license. TRPR_82221_277 4 THOMSON REUTERS PROPRIETARY RESEARCH MAY 1, 2015 THIS WEEK IN EARNINGS Q1 2015: EARNINGS SCORECARD Exhibit 3A. S&P 500: Q1 2015 Earnings vs. Expectations Surprise Reported Index Sector Above % Match % Below % Factor % Total # Total # Consumer Discretionary 62% 10% 28% 0% 50 84 Consumer Staples 83% 9% 9% 7% 23 38 Energy 92% 0% 8% 32% 24 41 Financials 59% 18% 23% 5% 74 87 Health Care 82% 5% 13% 10% 38 55 Industrials 62% 10% 28% 0% 58 65 Materials 63% 4% 33% 8% 24 29 Technology 63% 13% 24% 6% 46 66 Telecom Services 100% 0% 0% 5% 3 5 Utilities 75% 5% 20% 12% 20 30 S&P 500 68% 10% 22% 7% 360 500 Source: Thomson Reuters I/B/E/S Through May 1, 360 companies in the S&P 500 Index have reported earnings for Q4 2014. Of these companies, 68% reported earnings above analyst expectations, 10% reported earnings in line with analyst expectations and 22% reported earnings below analyst expectations. In a typical quarter (since 1994), 63% of companies beat estimates, 16% match and 21% miss estimates. Over the past four quarters, 70% of companies beat the estimates, 9% matched and 21% missed estimates. In aggregate, companies are reporting earnings that are 7% above estimates, which is above the 3% long- term (since 1994) average surprise factor, and above the 4% surprise factor recorded over the past four quarters.
  • 5. © 2015 Thomson Reuters. All marks herein are used under license. TRPR_82221_277 5 THOMSON REUTERS PROPRIETARY RESEARCH MAY 1, 2015 THIS WEEK IN EARNINGS Q1 2015: REVENUE SCORECARD Exhibit 4A. S&P 500: Q1 2015 Revenue vs. Expectations Surprise Reported Index Sector Above % Match % Below % Factor % Total # Total # Consumer Discretionary 40% 0% 60% -3% 50 84 Consumer Staples 57% 0% 43% 0% 23 38 Energy 54% 0% 46% 9% 24 41 Financials 47% 0% 53% 0% 74 87 Health Care 58% 0% 42% 2% 38 55 Industrials 31% 0% 69% -3% 58 65 Materials 25% 0% 75% -4% 24 29 Technology 54% 0% 46% 1% 46 66 Telecom Services 0% 0% 100% -1% 3 5 Utilities 40% 0% 60% 0% 20 30 S&P 500 44% 0% 56% 0% 360 500 Source: Thomson Reuters I/B/E/S Through May 1, 360 companies in the S&P 500 Index have reported revenues for Q4 2014. Of these companies, 44% reported revenues above analyst expectations, 0% reported revenues in line with analyst expectations, and 56% reported revenues below analyst expectations. In aggregate, companies are reporting revenues that are in line with estimates. Q1 2015: EARNINGS GROWTH RATES Exhibit 5A. S&P 500: Q1 2015 Earnings Growth Earnings $B Earnings $B Growth $B Growth % Sector Q115 Q114 Q115 Q115 Consumer Discretionary 25.1 23.7 1.3 5.7% Consumer Staples 23.4 22.7 0.8 3.4% Energy 13.9 30.5 -16.6 -54.5% Financials 56.3 48.9 7.5 15.3% Health Care 38.3 32.7 5.5 17.0% Industrials 24.9 23.7 1.3 5.4% Materials 8.8 8.4 0.3 3.7% Technology 52.7 48.3 4.4 9.1% Telecom Services 8.0 7.8 0.2 3.1% Utilities 9.5 9.1 0.4 4.8% S&P 500 260.9 255.7 5.2 2.0% Source: Thomson Reuters I/B/E/S The estimated earnings growth rate for the S&P 500 for Q1 2015 2.0%. The S&P 500 expects to see share- weighted earnings of $260.9B in Q1 2015, compared to share-weighted earnings of $255.7B (based on the year-ago earnings of the current 500 constituents) in Q1 2014. Nine of the ten sectors in the index expect to see an improvement in earnings relative to Q1 2014. The Health Care and Financials sectors have the highest earnings growth rates for the quarter, while the Energy sector has the weakest anticipated growth compared to Q1 2014. The Health Care sector has the highest earnings growth rate (17.0%) of any sector. It is expected to earn $38.3B in Q1 2015, compared to earnings of $32.7B in Q1 2014. Eight of the ten sub-industries in the sector are anticipated to have positive earnings growth, led by Biotechnology (61%) and Health Care Facilities (48%). If these sub-industries are removed, the growth rate declines to 17.0%.
  • 6. © 2015 Thomson Reuters. All marks herein are used under license. TRPR_82221_277 6 THOMSON REUTERS PROPRIETARY RESEARCH MAY 1, 2015 THIS WEEK IN EARNINGS The Financials sector has the second highest earnings growth rate (15.3%) of all ten sectors. Analysts expect it to earn $56.3B in Q1 2015, relative to earnings of $48.9B in Q1 2014. 14 of the 21 sub-industries in the sector are anticipated to see higher earnings than a year ago. The Diversified Banks (33%) and Investment Banking & Brokerage (32%) sub-industries have the highest growth rates in the sector. If these sub-industries are removed, the growth rate declines to 4.9%. The Energy sector has the lowest growth rate (-54.5%) of any sector. It is expected to earn $13.9B in Q1 2015, relative to earnings of $30.5B in Q1 2014. Six of the seven sub-industries in the sector are anticipated to see earnings decreases compared to Q1 2014, led by Oil & Gas Exploration & Production (-113%). If this sub- industry is removed, the growth rate increases to (-34.3%). Q1 2015: REVENUE GROWTH RATES Exhibit 6A. S&P 500: Q1 2015 Revenue Growth Revenue $B Revenue $B Growth $B Growth % Sector Q115 Q114 Q115 Q115 Consumer Discretionary 390.7 386.5 4.2 1.1% Consumer Staples 396.4 383.7 12.7 3.3% Energy 253.3 381.7 -128.4 -33.6% Financials 287.3 276.1 11.1 4.0% Health Care 363.5 330.8 32.7 9.9% Industrials 288.4 294.9 -6.5 -2.2% Materials 90.8 100.2 -9.4 -9.4% Technology 285.4 269.3 16.0 6.0% Telecom Services 72.5 70.6 1.9 2.7% Utilities 91.7 94.7 -3.0 -3.1% S&P 500 2,519.9 2,588.4 -68.5 -2.6% Source: Thomson Reuters I/B/E/S The estimated revenue growth rate for the S&P 500 for Q1 2015 is -2.6%. The S&P 500 is expected to earn revenues of $2,519.9B in Q1 2015 compared to $2,588.4B in Q1 2014. Six of the ten sectors anticipate revenue growth for the quarter. The Health Care sector is expected to have the highest revenue growth rate for the quarter, while the Energy sector is expected to have the lowest revenue growth rate. The Health Care sector expects the highest revenue growth rate (9.9%) for the quarter. It is expected to generate sales of $363.5B in Q1 2015, compared to sales of $330.8B in Q1 2014. Eight of the ten sub- industries in the sector are expected to see sales growth, led by the Health Care Technology (38%) and Biotechnology (28%) sub-industries. If these sub-industries are removed, the growth rate declines to 9.0%. The Energy sector has the lowest revenue growth rate at -33.6%. The sector is expected to post sales of $253.3 in Q1 2015, relative to sales of $381.7B in Q1 2014. All seven sub-industries in the sector expect to see revenue decreases for the quarter, led by the Oil & Gas Exploration & Production (-50%) and Oil & Gas Refining & Marketing (-37%) sub-industries. If these sub-industries are removed, the growth rate increases to -29.7%.
  • 7. © 2015 Thomson Reuters. All marks herein are used under license. TRPR_82221_277 7 THOMSON REUTERS PROPRIETARY RESEARCH MAY 1, 2015 THIS WEEK IN EARNINGS Q1 2015: EARNINGS GUIDANCE Exhibit 7A. S&P 500: Q1 2015 Preannouncements Q1 2015 Q1 2014 Q4 2014 Type Total (#) Total (%) Total (#) Total (%) Total (#) Total (%) Positive 19 14% 18 13% 24 17% In-Line 6 4% 11 8% 13 9% Negative 109 81% 109 79% 101 73% Total 134 138 138 N/P Ratio 5.74 6.06 4.21 Source: Thomson Reuters I/B/E/S In the S&P 500, there have been 109 negative EPS preannouncements issued by corporations for Q1 2015 compared to 19 positive EPS preannouncements. By dividing 109 by 19, one arrives at an N/P ratio of 5.7 for the S&P 500 Index. This 5.7 ratio is below the N/P ratio at the same point in time in Q1 2014 (6.1), and is above the long-term aggregate (since 1995) N/P ratio for the S&P 500 (2.6). Q2 2015 – Q1 2016: FORWARD FOUR-QUARTER P/E RATIO Exhibit 8A. S&P 500: Forward Four-Quarter (Q2 2015 – Q1 2016) P/E Ratio Price EPS P/E Ratio CY 2015 2,086 118.78 17.6 Forward 4 Quarter 2,086 122.23 17.1 CY 2016 2,086 119.02 17.5 Source: Thomson Reuters I/B/E/S The forward four-quarter (Q2 2015 – Q1 2016) P/E ratio for the S&P 500 is 17.1. Q1 2015 – Q4 2015: EARNINGS GROWTH The estimated earnings growth rates for the S&P 500 for Q1 2015 through Q4 2015 are 2%, -2%, 1%, and 5%, respectively. For sector-level growth rates for Q1 2015 through Q4 2015, see Exhibits 2C-5C in this report. EARNINGS CALENDAR The next several weeks will see the first companies report earnings for Q1 2015. There are 90 companies scheduled to report Q1 2015 earnings during the week of May 4. Exhibit 9A. Number of Companies Reporting Q1 2015 Earnings Reported Report Report Report Q1 2015 To Date This Week Next Week Remaining Dow 30 26 1 1 2 S&P 500 360 90 16 34 Source: Thomson Reuters StreetEvents.
  • 8. © 2015 Thomson Reuters. All marks herein are used under license. TRPR_82221_277 8 THOMSON REUTERS PROPRIETARY RESEARCH MAY 1, 2015 THIS WEEK IN EARNINGS STARMINE EARNINGS SURPRISE FORECAST Q1 2015 Looking forward to anticipated Q1 performance, we use StarMine’s SmartEstimate to determine which companies in the S&P 500 are better poised to beat earnings estimates. The SmartEstimate is a weighted average of analyst estimates, with more weight given to more recent estimates and more accurate analysts. Our studies have shown that when the SmartEstimate differs from the consensus (IBES Mean) by more than 2%, the company is likely to post subsequent earnings surprises directionally correct 70% of the time. During the week of May 4, 90 S&P 500 companies are expected to report earnings. Of these companies, positive surprises are expected from EOG Resources Inc (EOG.N) and Electronic Arts Inc. (EA.O). Analysts expect EOG to report earnings above the consensus due to lower capex spending. Meanwhile, Electronic Arts is expected to benefit from an strong sales of its new FIFA game and downloadable game content. On the flip side, negative surprises are expected from News Corp. (NWSA.O) and TripAdvisor Inc (TRIP.O). News Corp is expected to be impacted by foreign currency exposure due to the stronger US Dollar versus the British Pound and the Australian Dollar. Analysts believe that TripAdvisor will be impacted by weak seasonal revenues from its Viator site. EXHIBIT 10A. POSITIVE PREDICTED SURPRISES FOR Q1 2015, WEEK OF MAY 4, 2015 Company Ticker SmartEstimate Mean Predicted Surprise Predicted Surprise % Nrg Energy Inc NRG 0.4431 0.2378 0.2053 86.36% EOG Resources Inc EOG 0.0444 0.0003 0.0440 44.05% Pioneer Natural Resources Co PXD 0.0937 0.0804 0.0133 13.28% Chesapeake Energy Corp CHK 0.0499 0.0385 0.0115 11.46% Cablevision Systems Corp CVC 0.1866 0.1712 0.0154 9.00% Cimarex Energy Co XEC -0.3369 -0.3663 0.0294 8.03% Diamond Offshore Drilling Inc DO 0.4595 0.4308 0.0287 6.66% Spectra Energy Corp SE 0.4457 0.4220 0.0237 5.63% Vulcan Materials Co VMC -0.1473 -0.1560 0.0087 5.57% Electronic Arts Inc EA 0.2636 0.2510 0.0126 5.04% Source: Thomson Reuters StarMine Professional. EXHIBIT 11A. NEGATIVE PREDICTED SURPRISES FOR Q1 2015, WEEK OF MAY 4, 2015 Company Ticker SmartEstimate Mean Predicted Surprise Predicted Surprise % Assurant Inc AIZ 0.6287 0.9250 -0.2963 -32.03% Perrigo Company Plc PRGO 1.6000 1.9800 -0.3800 -19.19% News Corp NWSA 0.0531 0.0703 -0.0172 -17.25% Tesoro Corp TSO 1.1398 1.2902 -0.1505 -11.66% Apache Corp APA -0.6255 -0.5733 -0.0522 -9.10% Loews Corp L 0.6837 0.7500 -0.0663 -8.84% Occidental Petroleum Corp OXY 0.0303 0.0375 -0.0072 -7.18% Tripadvisor Inc TRIP 0.5369 0.5590 -0.0222 -3.97% Marathon Oil Corp MRO -0.4659 -0.4529 -0.0131 -2.89% Newfield Exploration Co NFX 0.0778 0.0807 -0.0029 -2.86% Source: Thomson Reuters StarMine Professional.
  • 9. © 2015 Thomson Reuters. All marks herein are used under license. TRPR_82221_277 9 THOMSON REUTERS PROPRIETARY RESEARCH MAY 1, 2015 THIS WEEK IN EARNINGS SECTION B: EARNINGS CALENDAR MONDAY: MAY 4 Exhibit 1B. Monday Earnings Calendar Date Ticker Company Qtr Est Yr Ago % Dif Time 4-May-15 CMCSA.OQ COMCAST CORP Q1-Mar.15 0.74 0.68 8.7 8:30 AM 4-May-15 CTSH.OQ COGNIZANT TECHNOLOGY SOLUTIONS C Q1-Mar.15 0.70 0.57 22.0 8:30 AM 4-May-15 CVC.N CABLEVISION SYSTEMS CORP Q1-Mar.15 0.17 0.14 22.2 8:30 AM 4-May-15 DO.N DIAMOND OFFSHORE DRILLING INC Q1-Mar.15 0.43 0.93 -53.7 8:30 AM 4-May-15 HSIC.OQ HENRY SCHEIN Q1-Mar.15 1.26 1.18 7.2 8:30 AM 4-May-15 L.N LOEWS CORP Q1-Mar.15 0.75 0.68 10.3 8:30 AM 4-May-15 PRGO.N PERRIGO COMPANY PLC Q1-Mar.15 1.78 1.31 36.2 8:30 AM 4-May-15 SYY.N SYSCO CORP Q3-Mar.15 0.41 0.38 8.9 8:30 AM 4-May-15 TSN.N TYSON FOODS INC Q2-Mar.15 0.72 0.60 19.9 8:30 AM 4-May-15 APC.N ANADARKO PETROLEUM CORP Q1-Mar.15 -0.64 1.26 -150.7 4:00 PM 4-May-15 BRKb.N BERKSHIRE HATHAWAY INC Q1-Mar.15 1.62 1.43 13.3 4:00 PM 4-May-15 DNB.N DUN & BRADSTREET CORP Q1-Mar.15 1.24 1.55 -20.0 4:00 PM 4-May-15 DVA.N DAVITA HEALTHCARE PARTNERS INC Q1-Mar.15 0.86 0.97 -10.9 4:00 PM 4-May-15 EOG.N EOG RESOURCES INC Q1-Mar.15 0.00 1.40 -100.0 4:00 PM 4-May-15 THC.N TENET HEALTHCARE CORP Q1-Mar.15 0.32 -0.03 NA 4:00 PM 4-May-15 VNO.N VORNADO REALTY TRUST Q1-Mar.15 1.19 1.31 -9.2 4:00 PM 4-May-15 XEC.N CIMAREX ENERGY CO Q1-Mar.15 -0.37 1.67 -121.9 4:00 PM 4-May-15 D.N DOMINION RESOURCES INC Q1-Mar.15 0.96 1.04 -7.3 N/AV Source: Thomson Reuters StreetEvents.
  • 10. © 2015 Thomson Reuters. All marks herein are used under license. TRPR_82221_277 10 THOMSON REUTERS PROPRIETARY RESEARCH MAY 1, 2015 THIS WEEK IN EARNINGS TUESDAY: MAY 5 Exhibit 2B. Tuesday Earnings Calendar Date Ticker Company Qtr Est Yr Ago % Dif Time 5-May-15 DISCA.OQ DISCOVERY COMMUNICATIONS INC Q1-Mar.15 0.35 0.38 -5.6 7:00 AM 5-May-15 DISCK.OQ DISCOVERY COMMUNICATIONS INC Q1-Mar.15 0.33 0.38 -12.0 7:00 AM 5-May-15 WEC.N WISCONSIN ENERGY CORP Q1-Mar.15 0.83 0.91 -9.3 7:00 AM 5-May-15 ADM.N ARCHER DANIELS MIDLAND CO Q1-Mar.15 0.71 0.64 11.5 8:30 AM 5-May-15 DTV.OQ DIRECTV Q1-Mar.15 1.53 1.09 40.4 8:30 AM 5-May-15 EL.N ESTEE LAUDER COMPANIES INC Q3-Mar.15 0.51 0.64 -20.4 8:30 AM 5-May-15 EMR.N EMERSON ELECTRIC CO Q2-Mar.15 0.76 0.80 -4.7 8:30 AM 5-May-15 HCA.N HCA HOLDINGS INC Q1-Mar.15 1.19 0.84 41.3 8:30 AM 5-May-15 HCP.N HCP INC Q1-Mar.15 0.78 0.75 4.4 8:30 AM 5-May-15 ICE.N INTERCONTINENTAL EXCHANGE INC Q1-Mar.15 2.97 2.42 22.8 8:30 AM 5-May-15 K.N KELLOGG CO Q1-Mar.15 0.92 1.01 -9.0 8:30 AM 5-May-15 MNK.N MALLINCKRODT PLC Q2-Mar.15 1.52 0.95 60.4 8:30 AM 5-May-15 NBL.N NOBLE ENERGY INC Q1-Mar.15 0.03 0.82 -96.8 8:30 AM 5-May-15 VMC.N VULCAN MATERIALS CO Q1-Mar.15 -0.16 -0.28 NA 8:30 AM 5-May-15 ZTS.N ZOETIS INC Q1-Mar.15 0.36 0.38 -4.6 8:30 AM 5-May-15 SRE.N SEMPRA ENERGY Q1-Mar.15 1.32 1.03 28.0 9:00 AM 5-May-15 AIZ.N ASSURANT INC Q1-Mar.15 0.93 1.68 -44.9 4:00 PM 5-May-15 ALL.N ALLSTATE CORP Q1-Mar.15 1.44 1.30 10.9 4:00 PM 5-May-15 CTL.N CENTURYLINK INC Q1-Mar.15 0.59 0.66 -11.3 4:00 PM 5-May-15 DIS.N WALT DISNEY CO Q2-Mar.15 1.10 1.11 -0.6 4:00 PM 5-May-15 DVN.N DEVON ENERGY CORP Q1-Mar.15 0.26 1.34 -80.2 4:00 PM 5-May-15 EA.OQ ELECTRONIC ARTS INC Q4-Mar.15 0.25 0.48 -47.7 4:00 PM 5-May-15 FISV.OQ FISERV INC Q1-Mar.15 0.86 0.82 5.4 4:00 PM 5-May-15 FOSL.OQ FOSSIL GROUP INC Q1-Mar.15 0.63 1.11 -43.2 4:00 PM 5-May-15 FTR.OQ FRONTIER COMMUNICATIONS CORP Q1-Mar.15 0.04 0.05 -14.0 4:00 PM 5-May-15 MYL.OQ MYLAN NV Q1-Mar.15 0.69 0.66 5.0 4:00 PM 5-May-15 NFX.N NEWFIELD EXPLORATION CO Q1-Mar.15 0.08 0.44 -81.7 4:00 PM 5-May-15 NWSA.OQ NEWS CORP Q3-Mar.15 0.07 0.11 -36.1 4:00 PM 5-May-15 OKE.N ONEOK INC Q1-Mar.15 0.36 0.42 -13.9 4:00 PM 5-May-15 PXD.N PIONEER NATURAL RESOURCES CO Q1-Mar.15 0.08 1.26 -93.6 4:00 PM 5-May-15 TEG.N INTEGRYS ENERGY GROUP INC Q1-Mar.15 1.82 1.73 5.2 4:00 PM 5-May-15 HRS.N HARRIS CORP Q3-Mar.15 1.25 1.27 -1.8 N/AV Source: Thomson Reuters StreetEvents.
  • 11. © 2015 Thomson Reuters. All marks herein are used under license. TRPR_82221_277 11 THOMSON REUTERS PROPRIETARY RESEARCH MAY 1, 2015 THIS WEEK IN EARNINGS WEDNESDAY: MAY 6 Exhibit 3B. Wednesday Earnings Calendar Date Ticker Company Qtr Est Yr Ago % Dif Time 6-May-15 CHK.N CHESAPEAKE ENERGY CORP Q1-Mar.15 0.04 0.59 -93.5 8:30 AM 6-May-15 MSI.N MOTOROLA SOLUTIONS INC Q1-Mar.15 0.25 0.27 -6.2 8:30 AM 6-May-15 OXY.N OCCIDENTAL PETROLEUM CORP Q1-Mar.15 0.04 1.75 -97.9 8:30 AM 6-May-15 SE.N SPECTRA ENERGY CORP Q1-Mar.15 0.42 0.62 -31.9 8:30 AM 6-May-15 XRAY.OQ DENTSPLY INTERNATIONAL INC Q1-Mar.15 0.57 0.59 -3.0 8:30 AM 6-May-15 CF.N CF INDUSTRIES HOLDINGS INC Q1-Mar.15 4.61 4.51 2.3 4:00 PM 6-May-15 CSC.N COMPUTER SCIENCES CORP Q4-Mar.15 1.20 1.09 10.3 4:00 PM 6-May-15 ED.N CONSOLIDATED EDISON INC Q1-Mar.15 1.18 1.17 0.8 4:00 PM 6-May-15 ESS.N ESSEX PROPERTY TRUST INC. Q1-Mar.15 2.23 1.68 32.5 4:00 PM 6-May-15 FOXA.OQ TWENTYFIRST CENTURY FOX INC Q3-Mar.15 0.39 0.47 -16.8 4:00 PM 6-May-15 GMCR.OQ KEURIG GREEN MOUNTAIN INC Q2-Mar.15 1.05 1.08 -2.9 4:00 PM 6-May-15 KIM.N KIMCO REALTY CORP Q1-Mar.15 0.35 0.34 3.5 4:00 PM 6-May-15 MET.N METLIFE INC Q1-Mar.15 1.41 1.37 3.0 4:00 PM 6-May-15 MRO.N MARATHON OIL CORP Q1-Mar.15 -0.45 0.88 -151.5 4:00 PM 6-May-15 PRU.N PRUDENTIAL FINANCIAL INC Q1-Mar.15 2.38 2.40 -1.0 4:00 PM 6-May-15 RIG.N TRANSOCEAN LTD Q1-Mar.15 0.60 1.43 -58.0 4:00 PM 6-May-15 TRIP.OQ TRIPADVISOR INC Q1-Mar.15 0.56 0.54 3.5 4:00 PM 6-May-15 WFM.OQ WHOLE FOODS MARKET INC Q2-Mar.15 0.43 0.38 12.0 4:00 PM 6-May-15 EXPD.OQ EXPEDITORS INTERNATIONAL OF WASH Q1-Mar.15 0.48 0.42 15.1 N/AV Source: Thomson Reuters StreetEvents.
  • 12. © 2015 Thomson Reuters. All marks herein are used under license. TRPR_82221_277 12 THOMSON REUTERS PROPRIETARY RESEARCH MAY 1, 2015 THIS WEEK IN EARNINGS THURSDAY: MAY 7 Exhibit 4B. Thursday Earnings Calendar Date Ticker Company Qtr Est Yr Ago % Dif Time 7-May-15 APA.N APACHE CORP Q1-Mar.15 -0.57 1.78 -132.2 8:00 AM 7-May-15 AEE.N AMEREN CORP Q1-Mar.15 0.38 0.40 -4.7 8:30 AM 7-May-15 BDX.N BECTON DICKINSON AND CO Q2-Mar.15 1.53 1.53 0.2 8:30 AM 7-May-15 PCLN.OQ PRICELINE GROUP INC Q1-Mar.15 7.71 7.81 -1.3 8:30 AM 7-May-15 PPL.N PPL CORP Q1-Mar.15 0.70 0.80 -12.9 8:30 AM 7-May-15 REGN.OQ REGENERON PHARMACEUTICALS INC Q1-Mar.15 2.71 2.26 20.0 8:30 AM 7-May-15 SIAL.OQ SIGMAALDRICH CORP Q1-Mar.15 1.08 1.06 1.9 8:30 AM 7-May-15 SNI.N SCRIPPS NETWORKS INTERACTIVE INC Q1-Mar.15 0.92 0.87 5.5 8:30 AM 7-May-15 TAP.N MOLSON COORS BREWING CO Q1-Mar.15 0.45 0.55 -18.5 8:30 AM 7-May-15 TDC.N TERADATA CORP Q1-Mar.15 0.42 0.54 -22.3 8:30 AM 7-May-15 CA.OQ CA INC Q4-Mar.15 0.50 0.61 -18.0 4:00 PM 7-May-15 CBS.N CBS CORP Q1-Mar.15 0.75 0.77 -2.5 4:00 PM 7-May-15 CERN.OQ CERNER CORP Q1-Mar.15 0.45 0.37 21.1 4:00 PM 7-May-15 MCHP.OQ MICROCHIP TECHNOLOGY INC Q4-Mar.15 0.67 0.64 4.2 4:00 PM 7-May-15 MHK.N MOHAWK INDS INC Q1-Mar.15 1.60 1.23 30.4 4:00 PM 7-May-15 MNST.OQ MONSTER BEVERAGE CORP Q1-Mar.15 0.68 0.55 24.3 4:00 PM 7-May-15 NVDA.OQ NVIDIA CORP Q1-Apr.15 0.26 0.21 23.3 4:00 PM 7-May-15 TSO.N TESORO CORP Q1-Mar.15 1.29 0.71 81.7 4:00 PM 7-May-15 LUK.N LEUCADIA NATIONAL CORP Q1-Mar.15 0.00 NA N/AV Source: Thomson Reuters StreetEvents.
  • 13. © 2015 Thomson Reuters. All marks herein are used under license. TRPR_82221_277 13 THOMSON REUTERS PROPRIETARY RESEARCH MAY 1, 2015 THIS WEEK IN EARNINGS FRIDAY: MAY 8 Exhibit 5B. Friday Earnings Calendar Date Ticker Company Qtr Est Yr Ago % Dif Time 8-May-15 HCN.N HEALTH CARE REIT INC Q1-Mar.15 1.04 1.00 3.8 8:30 AM 8-May-15 NRG.N NRG ENERGY INC Q1-Mar.15 0.24 -0.23 NA 8:30 AM Source: Thomson Reuters StreetEvents.
  • 14. © 2015 Thomson Reuters. All marks herein are used under license. TRPR_82221_277 14 THOMSON REUTERS PROPRIETARY RESEARCH MAY 1, 2015 THIS WEEK IN EARNINGS SECTION C: EARNINGS DATA TABLES Exhibit 1C. S&P 500: Q1 2015 Earnings Scorecard Sector Above Match Below Surprise Reported Index Consumer Discretionary 62% 10% 28% 0% 50 84 Consumer Staples 83% 9% 9% 7% 23 38 Energy 92% 0% 8% 32% 24 41 Financials 59% 18% 23% 5% 74 87 Health Care 82% 5% 13% 10% 38 55 Industrials 62% 10% 28% 0% 58 65 Materials 63% 4% 33% 8% 24 29 Technology 63% 13% 24% 6% 46 66 Telecom 100% 0% 0% 5% 3 5 Utilities 75% 5% 20% 12% 20 30 S&P 500 68% 10% 22% 7% 360 500 Source: Thomson Reuters I/B/E/S Exhibit 2C. S&P 500: Q1 2015 Earnings Growth Sector Today 1 Apr 1 Jan 1 Oct 1 Jul Consumer Discretionary 5.7% 7.0% 14.6% 17.3% 18.2% Consumer Staples 3.4% -0.6% 5.3% 8.8% 10.3% Energy -54.5% -63.7% -32.2% 2.3% 5.7% Financials 15.3% 10.9% 13.9% 15.5% 14.7% Health Care 17.0% 7.2% 11.1% 12.4% 12.2% Industrials 5.4% 7.5% 11.5% 13.4% 12.3% Materials 3.7% -2.4% 17.0% 24.2% 22.1% Technology 9.1% 4.2% 10.2% 12.0% 10.7% Telecom 3.1% -0.9% 1.2% 7.6% 8.4% Utilities 4.8% -6.7% -5.9% -5.2% -2.4% S&P 500 2.0% -2.9% 5.3% 11.5% 11.7% Source: Thomson Reuters I/B/E/S Exhibit 3C. S&P 500: Q2 2015 Earnings Growth Sector Today 1 Apr 1 Jan 1 Oct 1 Jul Consumer Discretionary 9.8% 11.5% 16.6% 17.9% 19.9% Consumer Staples -0.7% 0.0% 4.0% 7.5% 9.2% Energy -67.2% -64.6% -31.6% 2.9% 10.5% Financials 15.5% 16.1% 18.0% 20.2% 13.6% Health Care 4.8% 5.1% 6.3% 7.8% 14.1% Industrials 3.2% 7.0% 7.5% 9.5% 11.5% Materials 3.3% 7.6% 14.6% 20.1% 25.9% Technology 3.5% 6.1% 11.3% 13.2% 13.5% Telecom 6.1% 3.4% 4.3% 8.3% 6.1% Utilities 3.2% 4.8% 6.7% 6.3% 3.9% S&P 500 -2.1% -0.4% 5.9% 11.9% 13.3% Source: Thomson Reuters I/B/E/S
  • 15. © 2015 Thomson Reuters. All marks herein are used under license. TRPR_82221_277 15 THOMSON REUTERS PROPRIETARY RESEARCH MAY 1, 2015 THIS WEEK IN EARNINGS Exhibit 4C. S&P 500: Q3 2015 Earnings Growth Sector Today 1 Apr 1 Jan 1 Oct Consumer Discretionary 12.9% 13.4% 17.6% 20.3% Consumer Staples 1.4% 2.2% 6.0% 10.0% Energy -61.1% -58.6% -26.4% 12.7% Financials 14.7% 16.1% 17.8% 23.0% Health Care 7.0% 8.6% 10.3% 14.8% Industrials 5.3% 11.1% 8.7% 12.1% Materials 0.1% -1.0% 6.4% 17.1% Technology 8.0% 9.4% 12.1% 15.8% Telecom 7.6% 5.5% 5.6% 7.3% Utilities 2.5% 3.8% 5.2% 4.0% S&P 500 0.6% 2.3% 7.4% 15.4% Source: Thomson Reuters I/B/E/S Exhibit 5C. S&P 500: Q4 2015 Earnings Growth Sector Today 1 Apr 1 Jan Consumer Discretionary 13.7% 13.2% 18.2% Consumer Staples 4.6% 5.0% 9.2% Energy -41.1% -36.9% -1.8% Financials 21.5% 22.9% 21.2% Health Care 8.9% 9.1% 14.2% Industrials 3.1% 7.8% 11.2% Materials 4.0% 4.1% 19.7% Technology 3.4% 4.2% 11.1% Telecom 15.3% 12.9% 13.8% Utilities 3.9% 4.6% 6.6% S&P 500 5.2% 6.4% 12.9% Source: Thomson Reuters I/B/E/S Exhibit 6C. S&P 500: Q1 2016 Earnings Growth Sector Today 1 Apr Consumer Discretionary 20.1% 19.8% Consumer Staples 6.6% 10.3% Energy 8.4% 46.3% Financials 6.4% 11.0% Health Care 5.4% 17.1% Industrials 9.6% 12.7% Materials 15.0% 25.4% Technology 8.8% 14.3% Telecom 3.5% 4.8% Utilities -5.5% 3.4% S&P 500 8.4% 15.2% Source: Thomson Reuters I/B/E/S
  • 16. © 2015 Thomson Reuters. All marks herein are used under license. TRPR_82221_277 16 THOMSON REUTERS PROPRIETARY RESEARCH MAY 1, 2015 THIS WEEK IN EARNINGS Exhibit 7C. S&P 500: CY 2015 Earnings Growth Sector Today 1 Apr 1 Jan 1 Oct 1 Jul Consumer Discretionary 10.6% 11.1% 16.9% 18.0% 18.0% Consumer Staples 2.0% 2.0% 6.6% 9.0% 8.9% Energy -58.5% -56.5% -23.3% 6.9% 6.5% Financials 16.6% 16.0% 17.8% 16.7% 12.5% Health Care 8.3% 7.7% 10.5% 11.6% 11.9% Industrials 5.4% 9.8% 9.7% 11.5% 11.8% Materials 1.5% 2.4% 14.7% 19.1% 20.2% Technology 5.9% 6.0% 11.3% 12.5% 11.3% Telecom 6.8% 4.6% 4.9% 6.5% 6.5% Utilities 1.0% 0.9% 2.5% 2.8% 3.5% S&P 500 1.2% 1.7% 8.1% 12.4% 11.5% Source: Thomson Reuters I/B/E/S Exhibit 8C. S&P 500: CY 2016 Earnings Growth Sector Today 1 Apr 1 Jan 1 Oct 1 Jul Consumer Discretionary 15.6% 15.0% Consumer Staples 8.9% 9.0% Energy 44.1% 46.1% Financials 9.9% 10.5% Health Care 13.0% 12.8% Industrials 9.8% 8.6% Materials 20.5% 20.3% Technology 11.2% 11.9% Telecom 4.1% 5.0% Utilities 3.8% 4.1% S&P 500 12.6% 12.8% Source: Thomson Reuters I/B/E/S Exhibit 9C. S&P 500: Bottoms-Up EPS Actuals and Estimates Year Q1 Q2 Q3 Q4 CY 2004 15.87 16.74 16.59 17.83 67.10 2005 17.95 19.11 18.86 20.19 76.28 2006 20.73 22.31 22.60 22.44 88.18 2007 22.71 24.40 21.31 16.14 85.12 2008 18.96 19.78 17.49 5.62 65.47 2009 12.83 16.03 16.36 16.80 60.80 2010 19.71 21.48 21.75 22.55 85.28 2011 23.50 24.14 25.65 24.55 97.82 2012 25.60 25.84 26.00 26.32 103.80 2013 26.74 27.40 27.63 28.62 109.68 2014 28.18 30.07 30.04 30.54 118.78 2015 28.28 28.90 30.27 32.00 119.02 2016 31.06 33.02 34.50 36.28 134.18 2017 148.99 Source: Thomson Reuters I/B/E/S
  • 17. © 2015 Thomson Reuters. All marks herein are used under license. TRPR_82221_277 17 THOMSON REUTERS PROPRIETARY RESEARCH MAY 1, 2015 THIS WEEK IN EARNINGS Exhibit 10C. S&P 500: Actual Earnings Growth Rates Sector 4Q14 3Q14 2Q14 1Q14 4Q13 Consumer Disc. 14.7% -1.8% 7.5% 8.8% 8.4% Consumer Staples 1.2% 5.7% 7.8% 3.3% 4.1% Energy -21.8% 10.3% 17.0% -0.1% -8.8% Financials -3.3% 16.3% -6.6% -0.6% 24.7% Health Care 22.3% 16.3% 18.5% 12.0% 9.7% Industrials 15.0% 13.1% 11.4% 3.9% 14.2% Materials 5.2% 20.7% 12.2% 0.0% 22.2% Technology 18.0% 10.3% 15.3% 10.0% 10.3% Telecom 7.3% 6.4% 6.8% 14.0% 25.0% Utilities 9.6% 2.1% -0.1% 22.6% -5.9% S&P 500 7.0% 10.3% 8.6% 5.6% 9.9% Source: Thomson Reuters I/B/E/S Exhibit 11C. S&P 500: Actual vs. Estimate (Above/Match/Below) 4Q14 3Q14 2Q14 1Q14 4Q13 Above 69% 74% 68% 68% 64% Match 10% 7% 10% 9% 12% Below 20% 19% 22% 23% 24% Source: Thomson Reuters I/B/E/S Exhibit 12C. S&P 500: Actual vs. Estimate (Aggregate Difference) 4Q14 3Q14 2Q14 1Q14 4Q13 Surprise Factor 3.7% 4.5% 2.7% 5.0% 3.2% Source: Thomson Reuters I/B/E/S
  • 18. © 2015 Thomson Reuters. All marks herein are used under license. TRPR_82221_277 18 THOMSON REUTERS PROPRIETARY RESEARCH MAY 1, 2015 THIS WEEK IN EARNINGS NOTES / DEFINITIONS ABOUT THOMSON REUTERS EIKON Thomson Reuters Eikon is more comprehensive and collaborative than anything you’ve ever worked with. It is a real-time research and portfolio management solution that delivers a broad and deep range of global financial content and insight. You get direct, unfiltered access to industry-leading sources of financial information and analytics, all in a fully integrated workspace designed to help you better analyze your investable universe and monitor your holdings. In a single application, you can: access broker research, estimates, financials, events, news, fixed income and credit analysis, and more; conduct in- depth portfolio analysis versus indices, sectors, and industries; investigate data aggregates and complex data relationships; broaden your understanding of the credit markets; monitor negative developments and uncover new investment ideas. We also provide effortless integration of our content into your proprietary spreadsheets, and allow you to stay connected to critical portfolio information on your BlackBerry®. ABOUT THOMSON REUTERS Thomson Reuters is the world’s leading source of intelligent information for businesses and professionals. We combine industry expertise with innovative technology to deliver critical information to leading decision makers in the financial, legal, tax and accounting, scientific, healthcare and media markets, powered by the world’s most trusted news organization. With headquarters in New York and major operations in London and Eagan, Minnesota, Thomson Reuters employs more than 50,000 people in 93 countries. Thomson Reuters shares are listed on the New York Stock Exchange (NYSE: TRI) and Toronto Stock Exchange (TSX: TRI). For more information, go to www.thomsonreuters.com. IMPORTANT NOTICE This disclaimer is in addition to and not in replacement of any disclaimer of warranties and liabilities set forth in a written agreement between Thomson Reuters and you or the party authorizing your access to the Service (“Contract Disclaimer”). In the event of a conflict or inconsistency between this disclaimer and the Contract Disclaimer the terms of the Contract Disclaimer shall control. By accessing these materials, you hereby agree to the following: These research reports and the information contained therein is for your internal use only and redistribution of this information is expressly prohibited. These reports including the information and analysis, any opinion or recommendation is not intended for investment purposes and does not constitute investment advice or an offer, or an invitation to make an offer, to buy or sell any securities or any derivatives related to such securities. Thomson Reuters does not warrant the accuracy of the reports for any particular purpose and expressly disclaims any warranties of merchantability or fitness for a particular purpose; nor does Thomson Reuters guarantee the accuracy, validity, timeliness or completeness of any information or data included in these reports for any particular purpose. Thomson Reuters is under no obligation to provide you with any current or corrected information. Neither Thomson Reuters nor any of its affiliates, directors, officers or employees, will be liable or have any responsibility of any kind for any loss or damage (whether direct, indirect, consequential, or any other damages of any kind even if Thomson Reuters was advised of the possibility thereof) that you incur in connection with, relating to or arising out of these materials or the analysis, views, recommendations, opinions or information contained therein, or from any other cause relating to your access to, inability to access, or use of these materials, whether or not the circumstances giving rise to such cause may have been within the control of Thomson Reuters. The information provided in these materials is not intended for distribution to, or use by, any person or entity in any jurisdiction or country where such distribution or use would be contrary to law or regulation or which would subject Thomson Reuters or its affiliates to any registration requirement within such jurisdiction or country.