Genetic Relatedness among Six Common Phoenix dactylifera (Palmae) Cultivars in Ismailia Region, Egypt

SDS-PAGE electrophoretic analysis of young leaves protein was used to asses the genetic relatedness among 54 specimens belonging to 6 common cultivars of Phoenix dactylifera L. (Aglany, Amry, Haiany, Bent Aisha, Samany, and Zaghloul), that were collected from 7 different locations in Ismailia region. A total of 10 different protein bands were collectively detected in the gels of the 54 studied specimens. The resulted protein profile comprised one monomorphic band. The maximum number of bands observed was 10 bands found in one specimen of Zaghloul cultivar. While the minimum number of bands observed was three bands found in one specimen of Aglany cultivar and two specimens of Bent Aisha cultivar. The data of the allele frequencies of the six studied date palm cultivars revealed that all the alleles in Haiany cultivar were monomorphic, except in three loci with the lowest percentage of polymorphic loci (30%). While Bent Aisha and Aglany cultivars have the highest polymorphism (70% and 80%, respectively). In addition, it was found that the ratio of gene diversity/locus varied greatly within the specimens of the six studied date palm cultivars. Agglomerative cluster analysis, based on the genetic distances of the studied 54 specimens, revealed the variations and relatedness among the six collected cultivars.

Recommended
Recommended
More Related Content
Similar to Genetic Relatedness among Six Common Phoenix dactylifera (Palmae) Cultivars in Ismailia Region, Egypt
Similar to Genetic Relatedness among Six Common Phoenix dactylifera (Palmae) Cultivars in Ismailia Region, Egypt (20)
More from the Egyptian Society for Environmental Sciences
More from the Egyptian Society for Environmental Sciences (18)
Recently uploaded
Recently uploaded (20)
Genetic Relatedness among Six Common Phoenix dactylifera (Palmae) Cultivars in Ismailia Region, Egypt
- 1. CATRINA (2006), 1 (2): 139-147 © 2006 BY THE EGYPTIAN SOCIETY FOR ENVIRONMENTAL SCIENCES PROCEEDINGS OF THE FIRST INTERNATIONAL CONFERENCE ON CONSERVATION AND MANAGEMENT OF NATURAL RESOURCES, ISMAILIA, EGYPT, JUNE 18-19, 2006 ____________________________________________ * Corresponding Author: hmdeif@hotmail.com Genetic Relatedness among Six Common Phoenix dactylifera (Palmae) Cultivars in Ismailia Region, Egypt Hisham A. Deif1 *, Mohamed A. Karam2 , Mohamed S. Beltagi3 , and Hassan M. Hassan3 1 Botany Department, Faculty of Science, Alexandria University, Alexandria, Egypt 2 Botany Department, Faculty of Science, University of El-Faiyum, El-Faiyum, Egypt 3 Botany Department, Faculty of Science, Suez Canal University, 41552 Ismailia, Egypt ABSTRACT SDS-PAGE electrophoretic analysis of young leaves protein was used to asses the genetic relatedness among 54 specimens belonging to 6 common cultivars of Phoenix dactylifera L. (Aglany, Amry, Haiany, Bent Aisha, Samany, and Zaghloul), that were collected from 7 different locations in Ismailia region. A total of 10 different protein bands were collectively detected in the gels of the 54 studied specimens. The resulted protein profile comprised one monomorphic band. The maximum number of bands observed was 10 bands found in one specimen of Zaghloul cultivar. While the minimum number of bands observed was three bands found in one specimen of Aglany cultivar and two specimens of Bent Aisha cultivar. The data of the allele frequencies of the six studied date palm cultivars revealed that all the alleles in Haiany cultivar were monomorphic, except in three loci with the lowest percentage of polymorphic loci (30%). While Bent Aisha and Aglany cultivars have the highest polymorphism (70% and 80%, respectively). In addition, it was found that the ratio of gene diversity/locus varied greatly within the specimens of the six studied date palm cultivars. Agglomerative cluster analysis, based on the genetic distances of the studied 54 specimens, revealed the variations and relatedness among the six collected cultivars. Key words: Allele frequency, Genetic distances, Ismailia region, Palmae, Phoenix dactylifera cultivars, SDS-PAGE electrophoresis. INTRODUCTION Phoenix dactylifera is amongst few plant species that have been developed into agricultural crops and became so closely connected with human life. The exact origin or gene center of the date palm has been lost in history, but evidence of date palm cultivation goes as far back as 4000 B.C. in what is now known as southern Iraq. References to date palms have also been found in Ancient Egypt, and there seems to be a consensus that the earliest form of date palm cultivation coincided with the oldest civilizations and originated in North-East Africa, stretching northeast into the delta of the Euphrates and Tigris. From there, date palms have spread either purposely or accidentally to the Middle East, North Africa and south Sahel, areas of east and south Africa, southwestern USA, Central and south America and even in southern Europe (Spain and Italy; Barreveld, 1993). As a result, two thousand or more different cultivars of date palm are known to exist all over the world, but only few important ones have been evaluated for their agronomic performance and fruit quality (Al-Hooti et al., 1997). Egypt is in the first among the Arab countries on the base number of trees. Date trees that are cultivated in upper and Lower Egypt reach about 9.3 million trees. They are distributed along 1500 km from the Mediterranean coastal area in the north, to the high Dam in the south. It is widely spreading in the western Egyptian Oasis including Sewa, El-Baharyia, El- Farafra, El-Dakhla, El-Kharga, El-Faiyum and also in southern and northern Sinai, Suez Canal region and the Red Sea coastal region (Brown and Bahgat, 1938). Ismailia governorate is known for its soft and semi-dry date palm cultivars. It is reported that it has approximately 436,894 female palms with a total production of about 43379 tons yearly (Ministry of Agriculture, 2001). Studies of genetic polymorphism have been carried out at the level of protein coded by structural genes. Protein polymorphism arises from changes in one or more bases in the structural genes. These changes may result in amino acid substitution in the polypeptide produced at translation stage, thus affecting the physical properties of the translated protein especially its net charge. In order to detect the change in net charge, protein can be subjected to gel electrophoresis (Caprette, 2005). The electrophoretic banding patterns of protein have provided a valid source of taxonomic evidences and were used to address the relatedness among taxa at the generic, species or even cultivar levels. This was investigated with several authors in different taxa, e.g. genus Lathyrus (Badr et al., 2000), genus Lens esculentum (Hassan, 2001) and Psidium guajava (Hassan et al., 2002). Besides, to explore the genetic relatedness among studied taxa, numerical analysis was performed using computer programs, providing a logical means for expressing relationships among closely related specimens, on one hand, and specimens of uncertain positions, on the other hand (Sneath and Sokal, 1973). Davis and Heywood (1973) stated that all kinds of characters may be employed in numerical analyses as long as they are inherent and are not greatly affected by experimental or observational uncertainties. The present study was carried out to investigate the genetic relatedness among the six common Phoenix dactylifera cultivars of Ismailia, Egypt, using
- 2. Genetic relatedness among P. dactylifera cultivars 140 SDS-PAGE protein markers and numerical analysis methods. This will ensure true-to-type offshoots and will help in identifying new cultivars with different traits. Consequently, enhancing and promoting date palm culture in the newly reclaimed soils and may lead the palm breeder to produce high quality date palm fruits. MATERIALS AND METHODS Sampling of plant materials Fifty four Palm trees of the six P. dactylifera cultivars (Aglany, Amry, Bent Aisha, Haiany, Samany, and Zaghloul) were sampled from 7 locations representing different habitats in Ismailia region (from West Kantarah to Ismailia-Cairo Desert Highway). Young leaf samples from each cultivar of P. dactylifera were collected from 3 different locations (Table 1). The collected young leaves were ground in liquid nitrogen and the macerates were washed several times with acetone to get rid of pigments by centrifugation at 10000 rpm for 20 min. The supernatants were discarded and the pellets were air dried and kept frozen at -20o C until used (Laemmli, 1970). Extraction and SDS-PAGE Electrophoresis Samples of 500 µg leaf macerates were mixed with 500 µl extraction buffer (0.2 M Tris HCl, 10% glycerol, 2% SDS, 0.2% mercaptoethanol). The mixture was vortexed several times then centrifuged for 20 min. at 12000 rpm. Total leaf proteins in the supernatant were qualitatively analysed by SDS polyacrylamide gel electrophoresis (SDS-PAGE) following the method of Laemmli (1970). All gels were run in Bio-Rad system following the manufacturer’s instructions, using resolving and stacking gel with 12.5% and 2.5% acrylamide concentration, respectively. The samples were heated at 100°C for 5 minutes and centrifuged at 14000 rpm for 10 minutes prior to loading. Samples were loaded into the wells (10 µl per well). Control wells were loaded with standard protein marker with the following molecular weights; 96.00 KDa, 66.00 KDa, 45.00 KDa, 30.00 KDa, 20.10 KDa, and 14.40 KDa. Electrophoresis was carried out at a constant current of 60 mA. Then the gels were stained for proteins by immersing in 1% Comassie blue R250 stain. The stain solution was discarded and the gels were rinsed in water before adding destain solution (10% Trichloroacetic acid; TCA), shaken for several hours until the background staining is cleared. Documentation of results The gels were photographed and then protein bands were scored manually. Bands occurrence recorded as 1, while band absence recorded as 0. Data analysis (1) Allele frequencies The frequency of a prescribed allele is simply the proportion of all alleles of the gene that are of the prescribed type. The frequency of any prescribed allele in a sample is therefore equal to twice the number of homozygotes for the allele plus the number of heterozygotes for that allele divided by two times the number of individuals in the sample (Hartl and Clark, 1989). (2) Proportion of polymorphic loci The proportion of the polymorphic loci, at all loci assayed, has commonly been used as a measure of genetic diversity. However, the magnitude of this proportion depends on the sampling of loci. In this study, a locus was considered polymorphic if two or more alleles were detected, regardless of their frequencies. One individual carrying a rare variant allele will result in the locus being classified as variable. In many instances, a locus is classified as polymorphic. (3) Ratio of gene diversity per locus The ratio of gene diversity per locus is a measure of diversity similar to the proportion of polymorphic loci, with additional advantage that it takes account of the magnitude of square allele frequencies at each locus. Where pi is the frequency of dominant allele (1), pj is the frequency of recessive allele (0) and N is the total number of loci. POPGENE version 1.31 computer program (Yeh et al., 1999) was used to calculate all genetic parameters. (4) Numerical Analysis The fifty four fresh specimens were used as Operational Taxonomic Units (OTU’s). A total of 24 leaf protein characters were employed in the analysis. Agglomerative cluster analysis of the OTU’s could be illustrated in a tree-like structure similar to the one for phylogenetic trees. The standardized data were scaled by the mean (the mean of each variable was subtracted) then the dissimilarity distance between the OTU’s was calculated using both UPGMA (Unweight Pair Group Method with Arithmetic Averages) and average Euclidean distance coefficient methods (Sneath and Sokal, 1973). This was conducted by using Systat-pc version 7.0.1 computer program (Wilkinson et al., 1992). RESULTS SDS-PAGE A total of 10 different bands were collectively detected in the gels of the 54 studied specimens (Table 2) and presented diagrammatically in Figure (1). The minimum number of bands observed among the studied cultivars was 3 bands. They were recorded in one individual of Aglany cultivar (lane Ag. 2.5), and 2 individuals of Bent Aisha cultivar (lanes BA. = loci c polymorphi of proportion The loci of number Total 100 loci c polymorphi of Number × ∑ + − N j p i p / 2 2 1 locus per diversity gene of Ratio =
- 3. Deif et al. 141 Table (1): Details of the collected P. dactylifera specimens; abbreviations, replica numbers, location numbers and names and the specimen cultivars codes. Cultivars Abbreviations Replica numbers Location Specimen code Numbers Names 1 1 East Kantara, Erook valley Ag. 1.1 2 Ag. 2.1 3 Ag. 3.1 1 4 Abu Sweir, El-Kateeba village Ag. 1.4 Aglany Ag. 2 Ag. 2.4 3 Ag. 3.4 1 5 Abu Sweir, El Omda village Ag. 1.5 2 Ag. 2.5 3 Ag. 3.5 1 3 West Kantara, Ismailia – Port Said Highway (17 Km) Am. 1.3 2 Am. 2.3 3 Am. 3.3 1 4 Abu Sweir, El-Kateeba village Am. 1.4 Amry Am. 2 Am. 2.4 3 Am. 3.4 1 5 Abu Sweir, El Omda village Am. 1.5 2 Am. 2.5 3 Am. 3.5 1 1 East Kantara, Erook valley BA. 1.1 2 BA. 2.1 3 BA. 3.1 1 2 West Kantara, Ismailia – Port Said Highway (11 Km) BA. 1.2 BentaAisha BA. 2 BA. 2.2 3 BA. 3.2 1 5 Abu Sweir, El Omda village BA. 1.5 2 BA. 2.5 3 BA. 3.5 1 1 East Kantara, Erook valley Ha. 1.1 2 Ha. 2.1 3 Ha. 3.1 1 2 West Kantara, Ismailia – Port Said Highway (11 Km) Ha. 1.2 Haiany Ha. 2 Ha. 2.2 3 Ha. 3.2 1 5 Abu Sweir, El Omda village Ha. 1.5 2 Ha. 2.5 3 Ha. 3.5 1 3 West Kantara, Ismailia – Port Said Highway (17 Km) Sa.1.3 2 Sa. 2.3 3 Sa. 3.3 1 6 Ismailia – Cairo Desert Highway Sa. 1.6 Samany Sa. 2 Sa. 2.6 3 Sa. 3.6 1 7 Ismailia, Suez Canal University, Sa. 1.7 2 farm of the Faculty of Agriculture Sa. 2.7 3 Sa. 3.7 1 3 West Kantara, Ismailia – Port Said Highway (17 Km) Za. 1.3 2 Za. 2.3 3 Za. 3.3 1 6 Ismailia – Cairo Desert Highway Za. 1.6 Zaghloul Za. 2 Za. 2.6 3 Za. 3.6 1 7 Ismailia, Suez Canal University, Za. 1.7 2 farm of the Faculty of Agriculture Za. 2.7 3 Za. 3.7 2.2 and BA. 3.2). While the maximum number of bands observed was 10. They were recorded in one individual of Zaghloul cultivar (lane Za. 1.7). The resulted protein profile comprised band number 1 which was a monomorphic band that was found in all the studied specimens. Band number 2 was recorded in all the studied cultivars except two individuals of Aglany cultivar (lanes Ag. 2.5 and Ag. 3.5) and one individual of Amry cultivar (lane Am. 1.3). Band number 3 was recorded in almost all the studied specimens of the six cultivars except 5 individuals of Aglany cultivar (lanes Ag. 3.1, Ag. 1.4, Ag. 2.4, Ag. 3.4, and Ag. 1.5) and one individual of Bent Aisha (lane BA. 1.5). Band number 4 was detected in all specimens of the six cultivars except 2 individuals of Aglany cultivars (lanes Ag. 1.5 and Ag. 2.5), 4 individuals of Bent Aisha cultivar (lanes BA. 1.1, BA. 2.2, BA. 3.2, and BA. 1.5), and 3 individuals of Haiany cultivar (lanes Ha. 1.5, Ha. 2.5, and Ha. 3.5). Band number 5 was recorded in all specimens of Haiany cultivar, 4
- 4. Genetic relatedness among P. dactylifera cultivars 142 individuals of Aglany cultivar (lanes Ag. 1.1, Ag. 3.1, Ag. 1.4, and Ag. 2.4), 6 individuals of Bent Aisha cultivar (lanes BA. 1.1, BA. 2.1, BA. 3.1, BA. 1.2, BA. 2.5, and BA. 3.5), 2 individuals of Samany cultivar (lane Sa. 1.7 and Sa. 3.7), and 2 individuals of Zaghloul cultivar (Za. 1.7 and Za. 2.7). This band, however, was absent in the rest of the specimens. Band number 6 was present in approximately half of the studied specimens, while it was absent in the other. Band number 7 was recorded in all Haiany cultivar, 3 individuals of Aglany cultivar (lanes Ag. 1.1, Ag. 2.1, and Ag. 1.4), 6 individuals of Amry cultivar (lanes Am. 3.3, Am. 1.4, Am. 2.4, Am. 3.4, Am. 1.5, and Am. 2.5) 5 individuals of Bent Aisha cultivar (lanes BA. 1.1, BA. 2.1, BA. 1.5, BA. 2.5, and BA. 3.5), 4 individuals of Samany cultivar (lanes Sa. 3.3, Sa. 1.6, Sa. 1.7, and Sa. 2.7), 6 individuals of Zaghloul cultivar (lanes Za. 3.3, Za. 1.6, Za. 2.6, Za. 1.7, Za. 2.7, and Za. 3.7). This band, however, was absent in the rest of the specimens. Band number 8 was detected in all Amry, Haiany and Samany cultivars, 3 individuals of Aglany cultivar (lanes Ag. 1.1, Ag. 1.4, and Ag. 1.5), 7 individuals of Bent Aisha cultivar (lanes BA. 1.1, BA. 2.1, BA. 3.1, BA. 1.2, BA. 1.5, BA. 2.5, and BA. 3.5), and 7 individuals of Zaghloul cultivar (Za. 1.3, Za. 2.3, Za. 3.3, Za. 1.6, Za. 2.6, Za. 1.7, and Za. 3.7). It was absent, however, in the rest of the specimens. Band number 9 was present in most of the studied specimens except in 8 individuals of Aglany cultivar (lanes Ag. 2.1, Ag. 3.1, Ag. 1.4, Ag. 2.4, Ag. 3.4, Ag. 1.5, Ag. 2.5, and Ag. 3.5), 3 individuals of Amry cultivar (lanes Am. 1.3, Am. 2.3, and Am. 3.3), 3 individuals of Bent Aisha cultivar (lanes BA. 2.2, BA. 3.2, and BA. 1.5), one individual of Samany cultivar (Sa. 1.7), and one individual of Zaghloul cultivar (Za. 3.6). Band number 10 was absent in almost all the studied specimens except that of Haiany cultivar (lane Ha. 2.3), Samany cultivar (lane Sa. 1.7), and Zaghloul cultivar (lanes Za. 2.6, Za. 1.7, and Za. 2.7). The data of the six different P. dactylifera cultivars (Table 3) revealed that all the loci in Haiany cultivar are monomorphic except in 3 loci (locus 4, 6, and 10), where it recorded the lowest percentage of polymorphic loci 30%. Bent Aisha and Aglany cultivars have the highest percentage of polymorphism (70% and 80%, respectively). Meanwhile, Amry, Samany, and Zaghloul cultivars showed a moderate percentage of polymorphism (40%, 50%, and 60%, respectively). It was clearly observed that the sharing loci between two or more cultivars, with high allele frequency (dominant allele), were almost the same at all the polymorphic loci. This appeared clearly from the average of allele frequency data. For example, the average frequency of recessive allele (0) showed a highest value in each of Aglany and Bent Aisha cultivars. They were 0.67 and 0.56, respectively. A slight difference, nonetheless, Table (2): SDS-PAGE protein band patterns of the six studied P. dactylifera cultivars. Protein band numbers Cultivars Specimen code numbers 1 2 3 4 5 6 7 8 9 10 1.1 1 1 1 1 1 1 1 1 1 0 2.1 1 1 1 1 0 0 1 0 0 0 3.1 1 1 0 1 1 0 0 0 0 0 1.4 1 1 0 1 1 0 1 1 0 0 Aglany 2.4 1 1 0 1 1 0 0 0 0 0 3.4 1 1 0 1 0 1 0 0 0 0 1.5 1 1 0 0 0 1 0 1 0 0 2.5 1 0 1 0 0 1 0 0 0 0 3.5 1 0 1 1 0 1 0 0 0 0 1.3 1 0 1 1 0 1 0 1 0 0 2.3 1 1 1 1 0 1 0 1 0 0 3.3 1 1 1 1 0 1 1 1 0 0 1.4 1 1 1 1 0 1 1 1 1 0 Amry 2.4 1 1 1 1 0 1 1 1 1 0 3.4 1 1 1 1 0 1 1 1 1 0 1.5 1 1 1 1 0 1 1 1 1 0 2.5 1 1 1 1 0 1 1 1 1 0 3.5 1 1 1 1 0 0 0 1 1 0 1.1 1 1 1 0 1 0 1 1 1 0 2.1 1 1 1 1 1 0 1 1 1 0 3.1 1 1 1 1 1 0 0 1 1 0 1.2 1 1 1 1 1 0 0 1 1 0 Bent Aisha 2.2 1 1 1 0 0 0 0 0 0 0 3.2 1 1 1 0 0 0 0 0 0 0 1.5 1 1 0 0 0 1 1 1 0 0 2.5 1 1 1 1 1 1 1 1 1 0 3.5 1 1 1 1 1 1 1 1 1 0 1.1 1 1 1 1 1 0 1 1 1 0 2.1 1 1 1 1 1 1 1 1 1 0 3.1 1 1 1 1 1 1 1 1 1 0 1.2 1 1 1 1 1 0 1 1 1 0 Haiany 2.2 1 1 1 1 1 0 1 1 1 0 3.2 1 1 1 1 1 0 1 1 1 1 1.5 1 1 1 0 1 0 1 1 1 0 2.5 1 1 1 0 1 0 1 1 1 0 3.5 1 1 1 0 1 0 1 1 1 0 1.3 1 1 1 1 0 0 0 1 1 0 2.3 1 1 1 1 0 0 0 1 1 0 3.3 1 1 1 1 0 1 1 1 1 0 1.6 1 1 1 1 0 1 1 1 1 0 Samany 2.6 1 1 1 1 0 0 0 1 1 0 3.6 1 1 1 1 0 0 0 1 1 0 1.7 1 1 1 1 1 1 1 1 0 1 2.7 1 1 1 1 0 0 1 1 1 0 3.7 1 1 1 1 1 0 0 1 1 0 1.3 1 1 1 1 0 0 0 1 1 0 2.3 1 1 1 1 0 1 0 1 1 0 3.3 1 1 1 1 0 1 1 1 1 0 1.6 1 1 1 1 0 1 1 1 1 0 Zaghloul 2.6 1 1 1 1 0 1 1 1 1 1 3.6 1 1 1 1 0 0 0 0 0 0 1.7 1 1 1 1 1 1 1 1 1 1 2.7 1 1 1 1 1 1 1 0 1 1 3.7 1 1 1 1 0 1 1 1 1 0 existed between the averages of allele frequency in both of Haiany and Zaghloul cultivars. They were 0.20 and 0.37, respectively (Table 3). In addition, it was found that the ratio of gene diversity/locus within the studied specimens of the six studied Date palm trees cultivars varied greatly. It ranged from a minimum of 0.08 in Haiany cultivar to a maximum of 0.31 in Bent Aisha cultivar (Table 3).
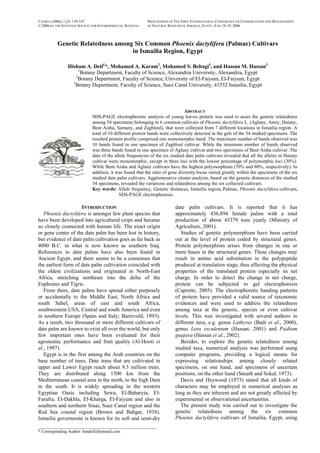
- 5. Deif et al. 143 Figure (1): Diagrammatic presentation for the electrophoretic patterns of leaf protein of six common P. dactylifera cultivars. (Lane M; Marker protein, Lane numbers; cultivars collected from different locations; see Table 1) Table (3): Allele frequencies belonging to the six studied P. dactylifera cultivars. Allele frequencies Cultivars Locus 1 Locus 2 Locus 3 Locus 4 Locus 5 Locus 6 Locus 7 Locus 8 Locus 9 Locus 10 Average of allele frequency Ratio of gene diversity/ locus Percentage of polymorphic loci 0.00 1.00 0.0 1.00 0.8 1.00 0.00 1.00 0.00 1.00 0.00 1.00 0.00 1.00 0.00 1.00 0.00 1.00 0.00 1.00 0.00 1.00 Aglany 0.00 1.00 0.4 0.60 0.8 0.20 0.40 0.60 0.80 0.22 0.72 0.28 0.83 0.17 0.83 0.17 0.94 0.06 1.00 0.00 0.67 0.33 0.30 80.00 Amry 0.00 1.00 0.5 0.65 0.0 1.00 0.00 1.00 1.00 0.00 0.55 0.65 0.67 0.33 0.00 1.00 0.67 0.33 1.00 0.00 0.44 0.60 0.19 40.00 Bent Aisha 0.00 1.00 0.0 1.00 0.5 0.65 0.72 0.28 0.67 0.33 0.83 0.17 0.72 0.28 0.39 0.61 0.67 0.33 1.00 0.00 0.56 0.47 0.31 70.00 Haiany 0.00 1.00 0.0 1.00 0.0 1.00 0.67 0.33 0.00 1.00 0.39 0.61 0.00 1.00 0.00 1.00 0.00 1.00 0.94 0.06 0.20 0.80 0.08 30.00 Samany 0.00 1.00 0.0 1.00 0.0 1.00 0.00 1.00 0.89 0.11 0.83 0.17 0.78 0.22 0.00 1.00 0.55 0.65 0.94 0.06 0.40 0.62 0.14 50.00 Zaghloul 0.00 1.00 0.0 1.00 0.0 1.00 0.00 1.00 0.89 0.11 0.39 0.61 0.67 0.33 0.39 0.61 0.55 0.65 0.83 0.17 0.37 0.65 0.23 60.00 96 KDa 66 KDa 45 KDa 30 KDa 20.10 KDa 14.40 KDa 96 KDa 66 KDa 45 KDa 30 KDa 20.10 KDa 14.40 KDa
- 6. Genetic relatedness among P. dactylifera cultivars 144 Numerical analysis The cluster analysis of the 54 OTU’s for the 24 studied leaf protein characters yielded the dendrogram shown in Figure (2). The resulted dendrogram separated the six studied P. dactylifera cultivars into two main groups (I and II) at a dissimilarity level of 6.12. Group I included Aglany and Amry cultivars at a relatively low dissimilarity level of 2.06. However, group II was further sub-divided into two sub-groups (1 and 2) at a dissimilarity level of 4.10. Sub-group "1" included both Haiany and Bent Aisha in one cluster at 2.05 dissimilarity level, while sub-group "2" included both Samany and Zaghloul cultivars. Discussion The characterization of the genetic diversity usually involves the description of variation among morphological traits and partitioning of such variation into genetic and environmental components. Continuous variation in most morphological traits is assumed to be under polygenic control (Bawa et al., 1991). Thus, morphological data are utilized to analyze variation at many unspecified loci. However, the genetic information provided by morphological characters is often limited. These limitations have resulted in deployment of biochemical techniques (Gottlieb, 1977; Crawford, 1989; Olfelt et al., 2001). Genetic variations and relatedness among certain group of plants can be detected at the molecular level by studying the changes in the structure of their DNA or the proteins coded by specific genes. Genetic markers includes total storage seed proteins, isozymes, restriction fragment length polymorphisms (RFLPs), randomly amplified polymorphic DNAs (RAPDs), and simple sequence repeats (SSRs) (e.g. Doll and Brown, 1979; Saghai-Maroof et al., 1984; Nevo et al., 1986; Chalmers et al., 1991; Peterson et al., 1994; Sanchez de la Hoz et al., 1996; Chtourou-Ghorbel et al., 2001; Sakka et al., 2004). Characterization of genetic diversity has long been a major goal in species, subspecies; and cultivar discrimination as well as plant breeding. SDS-protein marker considered as one of the powerful techniques for determining the variations among cultivars (Yupsanis et al., 1992; Abdel-Salam et al. 1998; Badr et al., 1998; Badr et al., 2000; Hassan, 2001; Hassan et al., 2002; Perin et al., 2006). Besides, the electrophoretic surveys of proteins play an important role in the quantitative evaluation and management of genetic resources. This is because distribution of genetic variation provides guidelines for sampling strategies and germplasm preservation (Black et al., 1995; Karcicio and Izbirak, 2003). Moreover, genetic variations can be estimated by detecting changes in amino acid sequence or electrophoretic mobility of proteins (Bawa et al., 1991). In addition, changes in amino acid sequence or electrophoretic mobility of proteins are presumed to result from alterations in DNA coding of these proteins. Sequencing of amino acids is cumbersome and expensive. Therefore, most population genetic surveys are based on the polymorphism detected by mobility Figure (2): A dendrogram resulted from UPGMA clustering analysis based on the leaf protein characters for the 54 specimens of the six studied P. dactylifera cultivars (GI, Group I; GII, Group II; SG1, Subgroup 1; SG2, Subgroup 2). Aglany Amry Bent Aisha Haiany Samany Zaghloul GI GII SG 1 SG2 0 1 2 3 4 5 6 7 Dissimilarity level (Euclidean distance)
- 7. Deif et al. 145 differences of proteins as revealed by electrophoresis (Hamrick and Rickwood, 1990; Bawa et al., 1991; Olfelt et al., 2001). In the present study, SDS-PAGE analysis was used to distinguish between fifty four genotypes belonging to six P. dactylifera cultivars. At the SDS protein pattern level, the resulted electrophoretic profiles detected variations among the studied cultivars. Based on the genetic diversity measures, Aglany and Bent Aisha cultivars showed the highest genetic diversity, this is also observed from the high percentage of their polymorphic loci. On the other hand, the lowest genetic diversity was obviously detected in Haiany cultivar. Moreover, it is well noted that Haiany cultivar could be considered as one of the most popular cultivar in Ismailia region due to its high productivity (Mousa, 1981). This high productivity could be attributed to the introduced pollen rather than diversity in the mother (female palm). The agglomerative clustering based on genetic distance among the studied cultivars clearly discriminate the six studied P. dactylifera cultivars into two main groups (I and II) at a dissimilarity level of 6.12. Group I included Aglany and Amry cultivars at a relatively low dissimilarity level of 2.06 indicating that they were closely related to each other. This finding was in concomitant with the morphological results of the same cultivars found by Abdalla (1986) indicating that both cultivars sharing several genetic codes related to phenetic ones. Moreover, it supported the idea of Max et al. (1999) and Fjellheim et al. (2001), who stated that both morphological and molecular data are valuable for detecting the intra-specific variations. However, group II was further sub-divided into two sub-groups (1 and 2) at a dissimilarity level of 4.10. Sub-group "1" included both Haiany and Bent Aisha in one cluster at 2.05 dissimilarity level, while sub-group "2" included both Samany and Zaghloul cultivars. These results were consistence with the morphological findings of Ibrahim and Khulif, (1997) and indicating that cultivars of each sub-group 1 and 2 separately sharing a common gene pool. REFERENCES ABDALLA, M.Y. 1986. Morphological and chemical studies through flowering and fruiting stages on date palm. Ph.D. Thesis, Faculty of Agriculture, Cairo University. ABDEL-SALAM, A.Z., S.A. IBRAHIM, F.M. EL-DOMYATI, AND G.H. EL-NADY. 1998. Biochemical and molecular genetic characterization of Egyptian barely cultivars and a trial for their micro propagation. Proceedings of the 3rd Arab Conference. Modern Biotechnology and Areas of Application in the Arab World, Cairo, Egypt 583-604. AL-HOOTI, S., J.S. SIDHU, AND H. QABAZAR. 1997. Physicochemical characteristics of five date fruit cultivars grown in the United Arab Emirates. Plant Foods for Human Nutrition 50: 101-113. BADR, A., M.M. ABOU EL-ENAIN, AND H.H. EL- SHAZLY. 1998. Variation in seed protein electrophoretic pattern and species relationships in the genus Sesbania. Proceedings of the Sixth Egyptian Botanical Conference. Cairo University, Giza 3: 493- 501. BADR, A., H.H. EL-SHAZLY, AND M.M. ABOU EL- ENAIN. 2000. Seed protein diversity and its implications on the relationships in the genus Lathyrus. Proceeding of the 1st International Conference of Biological Sciences (ICBS). Faculty of Science, Tanta University 1: 333-346. BARREVELD, W.H. 1993. Date Palm Products. Agricultural Service Bulletin. FAO. Rome 101: 216. BAWA, K., B. SCHALL, O.T. SOLBRIG, S. STEARNS, A. TEMPLETON, AND G. VIDA. 1991. Biodiversity from the genes to the species. In: O.T. Solbrig (Ed.). From Genes to Ecosystems. A Research Agenda for Biodiversity, Report of IUBS-SCOPE-UNESCO Workshop. IUBS, Cambridge, MA 15-36. BLACK, S., G. ERIKSSON, L. GUSTAFSSON, AND K. LUNDKVIST. 1995. Ecological genetics of the rare species Vicia pisiformis: Quantitative genetic- variation and temperature responses in biomass and fecundity. Acta Oecologica-International Journal of Ecology 16: 261-275. BROWN, W.T., AND M. BAHGAT. 1938. Date Palm in Egypt, Egyptian Ministry of Agriculture. Horticulture Section. Booklet 24: 117. CAPRETTE, D.R. 2005. Introduction to SDS-PAGE, Rice University, Created 14th August 1996, updated 2nd May 2005. http://www.ruf.rice.edu/~bioslabs/studies/sds- page/gellab2.html CHALMERS, K.J., R. WAUGH, J. WATTERS, B.P. FORSTER, E. NEVO, AND W. POWELL. 1991. Grain isozymes and ribosomal DNA variability in Hordeum spontaneum populations from Israel. Theoretical and Applied Genetics 84: 313-322. CHTOUROU-GHORBEL, N., B. LAUGA, D. COMBES, AND M. MARRAKCHI. 2001. Comparative genetic diversity studies in the genus Lathyrus using RFLP and RAPD markers. Lathyrus Lathyrism Newsletter 2: 62-68. CRAWFORD, D.G. 1989. Enzyme Electrophoresis and Plant Systematics In: D.E. Soltis and P.S. Soltis, (eds.), Isozymes in plant biology. Portland, Dioscoroides Press 146-164. DAVIS, P.H., AND V.H. HEYWOOD. 1973. Principles of Angiosperm Taxonomy. Robert Krieger, New York, USA. DOLL, H., AND A.H.D. BROWN. 1979. Hordein variation in wild (Hordeum spontaneum) and cultivated (H. vulgare) barley. Candian Journal of Genetics and Cytology 21: 391-404. FJELLHEIM, S., R. ELVEN, AND C. BROCHMANN. 2001.
- 8. Genetic relatedness among P. dactylifera cultivars 146 Molecules and morphology in concert. II-The Festuca brachyphylla complex (Poaceae) in Svalbard. American Journal of Botany 88: 869-882. GOTTLIEB, L.D. 1977. Electrophoretic evidence in plant systematics. Annals of the Missouri Botanical Garden 64: 161-180. HAMRICK, B.D., AND D.D. RICKWOOD. 1990. Gel Electrophoresis of Proteins. Oxford University Press, England. HARTL, D.L., AND A.G. CLARK. 1989. Principles of Population Genetics. 2nd Edition, Sinauer Associates, Sunderland, Massachusetts. HASSAN, H.Z. 2001. Genetic fingerprinting and relationships of some lent: (Lens esculanta) cultivars based on protein and DNA polymorphism. Proceedings of the 8th International Conference of Union of Arab biologist, Faculty of Science, Cairo University 11-31. HASSAN, H.Z., A.H. EL-SHRIF, AND T.S. WAFAA. 2002. Molecular genetic fingerprinting of some guava (Psidium guajava) cultivars based on SDS-protein, isozymes and RAPD analyses. Bulletin of Faculy of Assuit University 31: 259-282. IBRAHIM, A.M., AND M.N.H. KHULIF. 1997. Date palm: Agriculture, Caring and Production in the Arab Nation. 2nd Edition. Monshaa El-Maaref, Alexandria, Egypt. KARCICIO, M., AND A. IZBIRAK. 2003. Isozyme variation in some Aegilops L. and Triticum L. species collected from central Anatolia. Turkish Journal of Botany 27: 433-440. LAEMMLI, U.K. 1970. Cleavage of structural proteins during assembly of head bacteriophage T4. Nature 227: 680-685. MAX, K.N., S.K. MOUCHATY, AND K.E. SCHWAEGERLE. 1999. Allozyme and morphological variation in two subspecies of Dryas octopetala (Rosaceae) in Alaska. American Journal of Botany 86: 1637-1644. MINISTRY OF AGRICULTURE. 2001. Statistical report. Central Administration of Agricultural Economic, General Administration of Statistics, Horticulture crop Statistic Department. MOUSA, I.A. 1981. Evaluation and studying of some seedling date palms grown in Ismailia Province. M.Sc. Thesis, Faculty of Agriculture, Zagazig University, Egypt. NEVO, E., A. BEILES, AND D. ZOHARY. 1986. Genetic resources of wild barley in the Near East structure, evolution and application in breeding. Biological Journal of the Linnean Society 27: 355-380. OLFELT, J.P., G.R. FURNIER, AND J.J. LUMBY. 2001. What data determines whether a plant taxon is distinct enough to merit legal protection? A case study of Sedum integrifolium (Crassulaceae) 88 (3): 401-410. PERIN, L., L. MARTÍNEZ-AGUILAR, R. CASTRO- GONZÁLEZ, P. ESTRADA-DE LOS SANTOS, T. CABELLOS-AVELAR, H.V. GUEDES, V.M. REIS, AND J. CABALLERO-MELLADO. 2006. Diazotrophic burkholderia species associated with field-grown Maize and Sugarcane. Applied and Environmental Microbiology 72 (5): 3103-3110. PETERSON, L., H. OSTERGARD, AND H. GIESE. 1994. Genetic diversity among wild and cultivated barleys as revealed by RFLP. Theoretical and Applied Genetics 89: 676-691. SAGHAI-MAROOF, M.A., K.M. SOLIMAN, R.A. JORGENSEN, AND R.W. ALLARD. 1984. Ribosomal DNA spacer-length polymorphism in barley: Mendelian inheritance, chromosomal location, and population dynamics. Proceedings of the National Academy of Sciences 81: 8014-8018. SAKKA, H., S. ZEHDI, A.O.M. SALEM, A. RHOUMA, M. MARRAKCHI, AND M. TRIFI. 2004. Genetic polymorphism of plastid DNA in Tunisian date-palm germplasm (Phoenix dactylifera L.) detected with PCR-RFLP. Genetic Resources and Crop Evolution 51: 479-487. SANCHEZ DE LA HOZ, M.P., J.A. DAVILA, Y. LOARCE, AND E. FERRER, 1996. Simple sequence repeat primers used in polymerase chain reaction amplifications to study genetic diversity in barley. Genome 39: 112-117. SNEATH, P.H.A., AND R.R. SOKAL. 1973. Numerical Taxonomy. W.H. Feeman (ed.), San Francisco, USA. WILKINSON, L., M.A. HILL, S. MICELI, G. BIRKENBEUEL, AND E. VANG. 1992. SYSTAT FOR WINDOWS VERSION 7.0.1, Evanston (ed.), Illinois, Systat Incorporation, Illinois, USA. YEH, F.C., R.C. YANG, AND T. BOYLE. 1999. POPGENE VERSION 1.31 Microsoft Window-based Freeware for Population Genetic Analysis. University of Alberta and Centre for International Forestry Research. YUPSANIS, S.T., M. MOUSTAKAS, AND S. KARAKOLI 1992. Seed protein electrophoresis for varietal identification in rice (Oryza sativa L). Journal of Agronomy and crop Science 168 (2): 95-99. Received June 21, 2006 Accepted December 1, 2006
- 9. CATRINA (2006), 1(2): 139-147 © 2006 BY THE EGYPTIAN SOCIETY FOR ENVIRONMENTAL SCIENCES PROCEEDINGS OF THE FIRST INTERNATIONAL CONFERENCE ON CONSERVATION AND MANAGEMENT OF NATURAL RESOURCES, ISMAILIA, EGYPT, JUNE 18-19, 2006 147 اﻹﺳﻤﺎﻋﻴﻠﻴﺔ ﻣﻨﻄﻘﺔ ﻓﻲ اﻟﺒﻠﺢ ﻧﺨﻴﻞ ﻣﻦ ﺷﺎﺋﻌﺔ ﺳﻼﻻت ﻟﺴﺘﺔ اﻟﻮراﺛﻴﺔ اﻟﻌﻼﻗﺎت ، ﻣﺼﺮ ﺿﻴﻒ رأﻓﺖ أﺣﻤﺪ هﺸﺎم 1 ، آﺮم أﻧﻮر ﻣﺤﻤﺪ 2 ، ﺏﻠﺘﺎﺟﻲ ﺹﻼح ﻣﺤﻤﺪ 3 ، ﺣﺴﻦ ﻣﻨﺼﻮر ﺣﺴﻦ 3 1 ﻣﺼﺮ ،اﻹﺳﻜﻨﺪرﻳﺔ ﺟﺎﻣﻌﺔ ،اﻟﻌﻠﻮم آﻠﻴﺔ ،اﻟﻨﺒﺎت ﻗﺴﻢ 2 ﻣﺼﺮ ،اﻟﻔﻴﻮم ﺟﺎﻣﻌﺔ ،اﻟﻌﻠﻮم آﻠﻴﺔ ،اﻟﻨﺒﺎت ﻗﺴﻢ 3 ،اﻟﻨﺒﺎت ﻗﺴﻢ ﺟﺎﻣﻌﺔ ،اﻟﻌﻠﻮم آﻠﻴﺔ ،اﻟﺴﻮﻳﺲ ﻗﻨﺎة ﻣﺼﺮ ،اﻹﺳﻤﺎﻋﻴﻠﻴﺔ اﻟﻌﺮﺏـــﻰ اﻟﻤﻠﺨﺺ ﻀﻤﻨﺖﺗ ﻲواﻟﺘ ﺔاﻟﺪراﺳ ﻗﻴﺪ اﻟﺒﻠﺢ ﻥﺨﻴﻞ ﻟﺴﻼﻻت اﻟﺤﺪﻳﺜﺔ اﻷوراق ﻋﻴﻨﺎت ﻓﻲ ﻟﻠﺒﺮوﺗﻴﻨﺎت اﻟﻜﻬﺮﺏﻲ اﻟﺘﻔﺮﻳﺪ ﻥﺘﺎﺋﺞ أﻇﻬﺮت 54 اﻟﻤﻨﺰرﻋﺔ اﻟﺴﺘﺔ اﻟﺴﻼﻻت ﺗﻤﺜﻞ ﻥﺒﺎﺗﻴﺔ ﻋﻴﻨﺔ ) ﻋﺠﻼﻥﻲ و ﻋﻤﺮي و ﺎﻥﻲﺡﻴ و ﺸﺔﻋﻴ ﺖﺏﻨ و ﻤﺎﺳ ﻮلوزﻏﻠ ﻥﻲ ( ﻢﺗ ﻲاﻟﺘ ﺎﻃﻖﻣﻨ ﺴﺒﻌﺔاﻟ ﻲﻓ اﻹﺳﻤﺎﻋﻴﻠﻴﺔ ﻣﻨﻄﻘﺔ ﻓﻲ اﺥﺘﻴﺎرهﺎ . ﻼمُ ﻬاﻟ ﻲﻓ ﺎﺟﻤﻴﻌﻬ ﺪتﺗﻮاﺟ ﺮوﺗﻴﻦﺏ ﺮﻃﺔأﺵ ﺸﺮةﻋ ﺗﻌﺮﻳﻒ ﺗﻢ ) ﻞِ ﺠاﻟ ( ﺔاﻟﺪراﺳ ﻞﻣﺤ ﺎتﺏﺎﻟﻌﻴﻨ ﺎصاﻟﺨ . ﺮطﺵ ﺮﻇﻬ ﺪوﻗ ﻢ رﻗ ﺮوﺗﻴﻦ اﻟﺒ ) 1 ( ﺸﻜﻞ اﻟ ﺪ وﺡﻴ ) ﺎوي اﻟﻜﻴﻤ ﺐ اﻟﺘﺮآﻴ ( ﺎت اﻟﺒﺮوﺗﻴﻨ ﺎط أﻥﻤ ﻊ ﺟﻤﻴ ﻲ ﻓ . اﻷ ﺪ اﻟﺤ ﺪ وﺗﻮاﺟ ﺮوﺗﻴﻦ اﻟﺒ ﺮﻃﺔ ﻷﺵ ﺼﻰ ﻗ ) 10 أﺵﺮﻃﺔ ( ﻓﻘﻂ زﻏﻠﻮل ﺳﻼﻟﺔ أﻓﺮاد أﺡﺪ ﻓﻲ . اﻟﺒﺮوﺗﻴﻦ ﻷﺵﺮﻃﺔ اﻷدﻥﻰ اﻟﺤﺪ ﺗﺴﺠﻴﻞ ﺗﻢ ﺏﻴﻨﻤﺎ ) 3 ﺮﻃﺔأﺵ ( ﻲﻋﺠﻼﻥ ﻼﻟﺔﺳ ﺮادأﻓ ﺪأﺡ ﻲﻓ ﻋﻴﺸﺔ ﺏﻨﺖ ﺳﻼﻟﺔ ﻣﻦ وﻓﺮدﻳﻦ . ﺪةوﺡﻴ ﺎﻥﻲﺡﻴ ﻼﻟﺔﺳ ﻴﻼتأﻟ ﻊﺟﻤﻴ أن ،ﺴﺘﺔاﻟ ﺴﻼﻻتﺏﺎﻟ ﺔاﻟﺨﺎﺹ ،ﻴﻼتاﻷﻟ ﺮارﺗﻜ ﺎﺋﺞﻥﺘ أوﺽﺤﺖ وﻗﺪ ﺪاﻣﺎﻋ ﻲﻓ ﺸﻜﻞاﻟ ﻣﺌﻮﻳﺔ ﻥﺴﺒﺔ أﻗﻞ ﺳﺠﻠﺖ ﺡﻴﺚ ﺟﻴﻨﻴﺔ ﻣﻮاﺽﻊ ﺙﻼث ) 30 (% اﻟﺸﻜﻞ ﻋﺪﻳﺪة اﻟﺠﻴﻨﻴﺔ ﻟﻠﻤﻮاﻗﻊ . وﺏﻨﺖ ﻋﺠﻼﻥﻲ ﺳﻼﻟﺘﻲ ﺳﺠﻠﺖ ،ﺏﺬﻟﻚ وﻣﻘﺎرﻥﺔ ﻣﺌﻮﻳﺔ ﻥﺴﺒﺔ أﻋﻠﻰ ﻋﻴﺸﺔ ) 70 % ، 80 (% اﻟﺘﻮاﻟﻲ ﻋﻠﻰ ،اﻟﺸﻜﻞ ﻋﺪﻳﺪة اﻟﺠﻴﻨﻴﺔ ﻟﻠﻤﻮاﻗﻊ . ﻲاﻟﺠﻴﻨ ﻮعاﻟﺘﻨ ﺴﺒﺔﻥ أن وﺟﺪ ﻓﻠﻘﺪ ،ذﻟﻚ إﻟﻰ إﺽﺎﻓﺔ اﻟﻤ إﻟﻰ اﻟﺴﺘﺔ اﻟﺴﻼﻻت ﺏﻴﻦ آﺒﻴﺮة اﺥﺘﻼﻓﺎت اﺥﺘﻠﻔﺖ اﻟﺠﻴﻨﻲ ﻮﻗﻊ . ﺎسأﺳ ﻰﻋﻠ ﻲاﻟﻤﺒﻨ اﻟﺘﺠﻤﻴﻌﻲ اﻟﺘﺤﻠﻴﻞ اﺳﺘﺨﺪام ﻓﺈن ،ذاﺗﻪ اﻟﻮﻗﺖ وﻓﻲ ﺔ اﻟﺪراﺳ ﻮع ﻣﻮﺽ ﺎت اﻟﻌﻴﻨ ﻴﻦ ﺏ ﺔ اﻟﻮراﺙﻴ ﺴﺎﻓﺎت اﻟﻤ ) 54 ﺔ ﻥﺒﺎﺗﻴ ﺔ ﻋﻴﻨ ( ﺴﻴﺘﻴﻦ رﺋﻴ ﻮﻋﺘﻴﻦ ﻣﺠﻤ ﻰ إﻟ ﺢ واﺽ ﺸﻜﻞ ﺏ ﺼﻠﺔ اﻟ ﺔ واﻟﻮﺙﻴﻘ ) اﻟﺜﺎﻥﻴﺔ واﻟﻤﺠﻤﻮﻋﺔ اﻷوﻟﻰ اﻟﻤﺠﻤﻮﻋﺔ ( ﻣﻦ ﻳﻘﺎرب اﺥﺘﻼف ﻣﺴﺘﻮى ﻓﻰ 06.12 ﻰﻋﺠﻼﻥ ﺴﻼﻟﺘﻴﻦاﻟ ﻰاﻷوﻟ ﺔاﻟﻤﺠﻤﻮﻋ ﻀﻤﻨﺖﺗ وﻟﻘﺪ ﺮﻋﻴﺘﻴﻦﻓ ﻮﻋﺘﻴﻦﻣﺠﻤ ﻰﻓ ﺮىاﻷﺥ ﻼﻻتﺳ ﺔاﻷرﺏﻌ ﺔاﻟﺜﺎﻥﻴ اﻟﻤﺠﻤﻮﻋﺔ ﺗﻀﻤﻨﺖ ﺏﻴﻨﻤﺎ وﻋﻤﺮي ) ﺔاﻟﻔﺮﻋﻴ ﺔاﻟﻤﺠﻤﻮﻋ " 1 " ﺔواﻟﻤﺠﻤﻮﻋ اﻟﻔﺮﻋﻴﺔ " 2 (" ﻦﻣ ﻳﻘﺎرب إﺥﺘﻼف ﻣﺴﺘﻮى ﻓﻰ 04.10 اﻟﻔﺮ ﺔاﻟﻤﺠﻤﻮﻋ ﺘﻤﻠﺖإﺵ ﺪوﻟﻘ ﺔﻋﻴ " 1 " ﺖوﺏﻨ ﺎﻥﻲﺡﻴ ﺴﻼﻟﺘﻴﻦاﻟ ﻦﻣ ﻼآ ﻰﻋﻠ اﻟﻔﺮﻋﻴﺔ اﻟﻤﺠﻤﻮﻋﺔ ﺗﻀﻤﻨﺖ ﺏﻴﻨﻤﺎ ،ﻋﻴﺸﺔ " 2 " وزﻏﻠﻮل ﺳﻤﺎﻥﻲ اﻷﺥﺮﻳﻴﻦ اﻟﺴﻼﻟﺘﻴﻦ ﻋﻠﻰ .