More Related Content
Similar to 2016 Intern Infographic
Similar to 2016 Intern Infographic (20)
2016 Intern Infographic
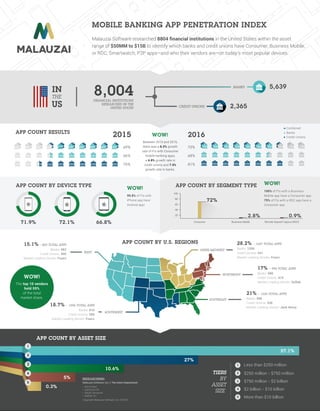
- 1. MOBILE BANKING APP PENETRATION INDEX
APP COUNT RESULTS
FINANCIAL INSTITUTIONS
RESEARCHED IN THE
UNITED STATES
8,004
BANKS
CREDIT UNIONS
5,639
2,365
2016
Combined
Banks
Credit Unions2015
Between 2015 and 2016,
there was a 6.2% growth
rate of FIs with Consumer
mobile banking apps,
a 4.8% growth rate in
credit unions and 7.9%
growth rate in banks.
APP COUNT BY DEVICE TYPE APP COUNT BY SEGMENT TYPE
99.8% of FIs with
iPhone app have
Android app!
20
Consumer Business Mobile Remote Deposit Capture (RDC)
40
60
80
100
72%
2.8% 0.9%
72.1%71.9%
APP COUNT BY U.S. REGIONS
Banks: 483
Credit Unions: 400
Market Leading Vendor: Fiserv
15.1% - 883 TOTAL APPS
Banks: 810
Credit Unions: 286
Market Leading Vendor: Fiserv
18.7% - 1096 TOTAL APPS
WEST
SOUTHWEST
SOUTHEAST
NORTHEAST
UPPER MIDWEST Banks: 1206
Credit Unions: 441
Market Leading Vendor: Fiserv
28.2% - 1647 TOTAL APPS
Banks: 580
Credit Unions: 414
Market Leading Vendor: Softek
17% - 994 TOTAL APPS
Banks: 896
Credit Unions: 330
Market Leading Vendor: Jack Henry
21% - 1226 TOTAL APPS
66.8%
1
4
3
2
5
APP COUNT BY ASSET SIZE
57.1%
27%
10.6%
5%
0.3%
TIERS
BY
ASSET
SIZE
1
4
2
5
3
Less than $250 million
$250 million - $750 million
$750 million - $2 billion
$2 billion - $10 billion
More than $10 billion
Malauzai Software, Inc // The Intern Department:
• Alex Kriese
• Catherine Oh
• Deryk Camazine
• Nathan Vu
Copyright Malauzai Software, Inc 2016 ©
RESEARCHERS:
The top 10 vendors
hold 59%
of the total
market share.
WOW!
WOW! 100% of FIs with a Business
Mobile app have a Consumer app.
79% of FIs with a RDC app have a
Consumer app.
WOW!
WOW!
Malauzai Software researched 8804 financial institutions in the United States within the asset
range of $50MM to $15B to identify which banks and credit unions have Consumer, Business Mobile,
or RDC, Smartwatch, P2P apps–and who their vendors are–on today’s most popular devices.
69% 72%
66% 68%
76% 81%