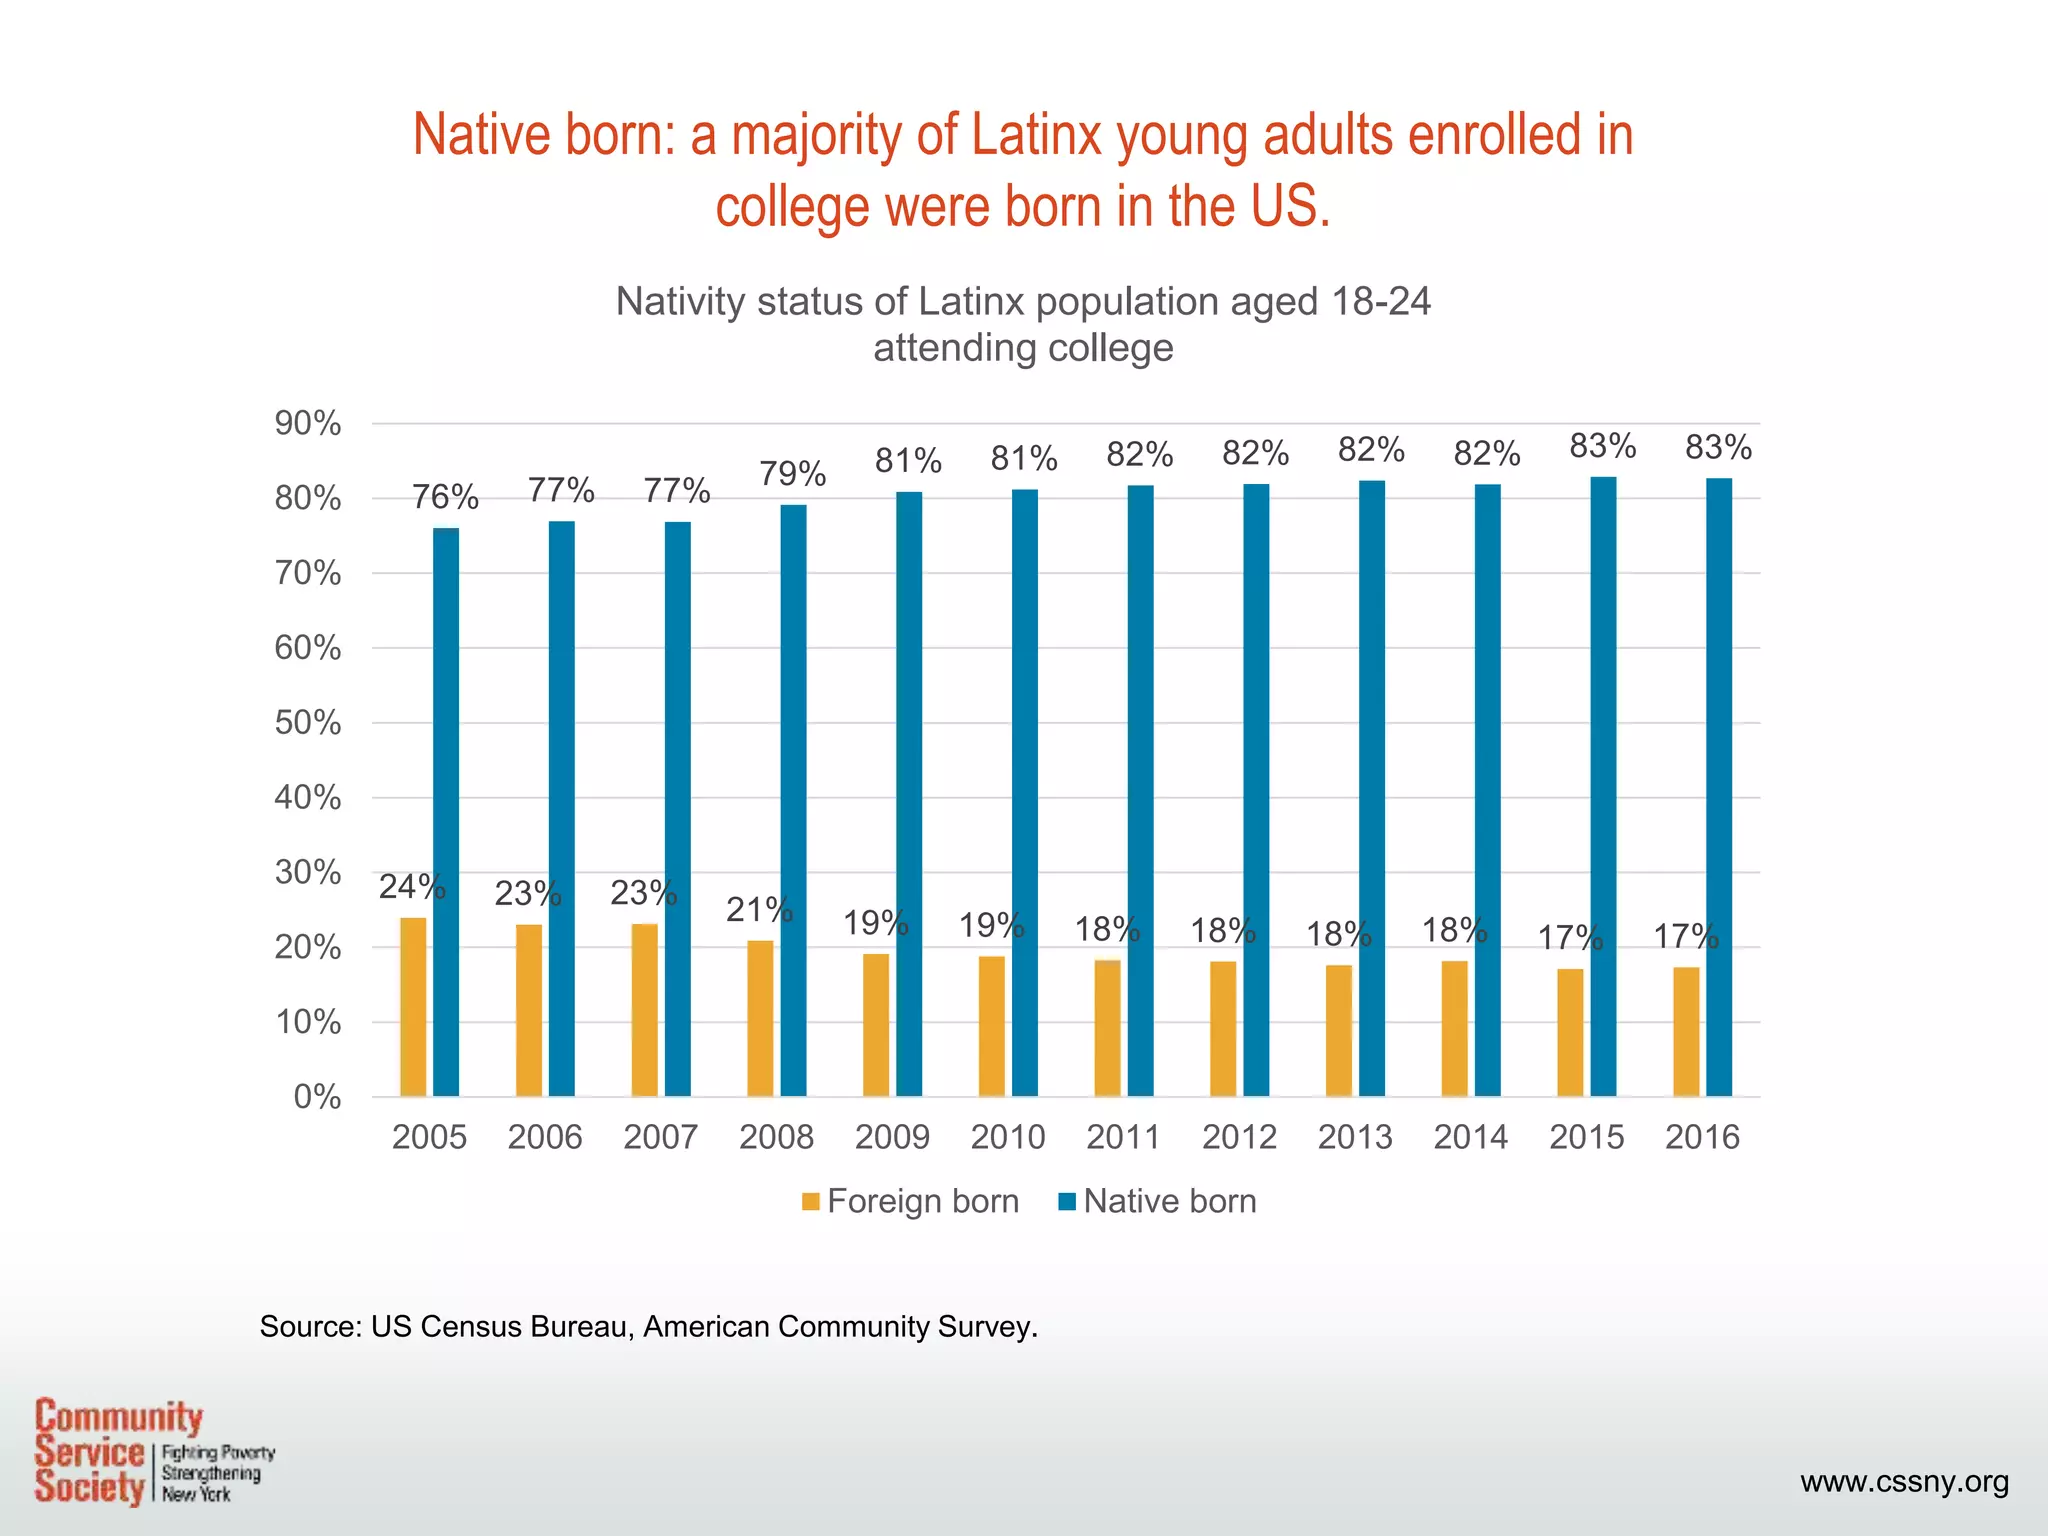
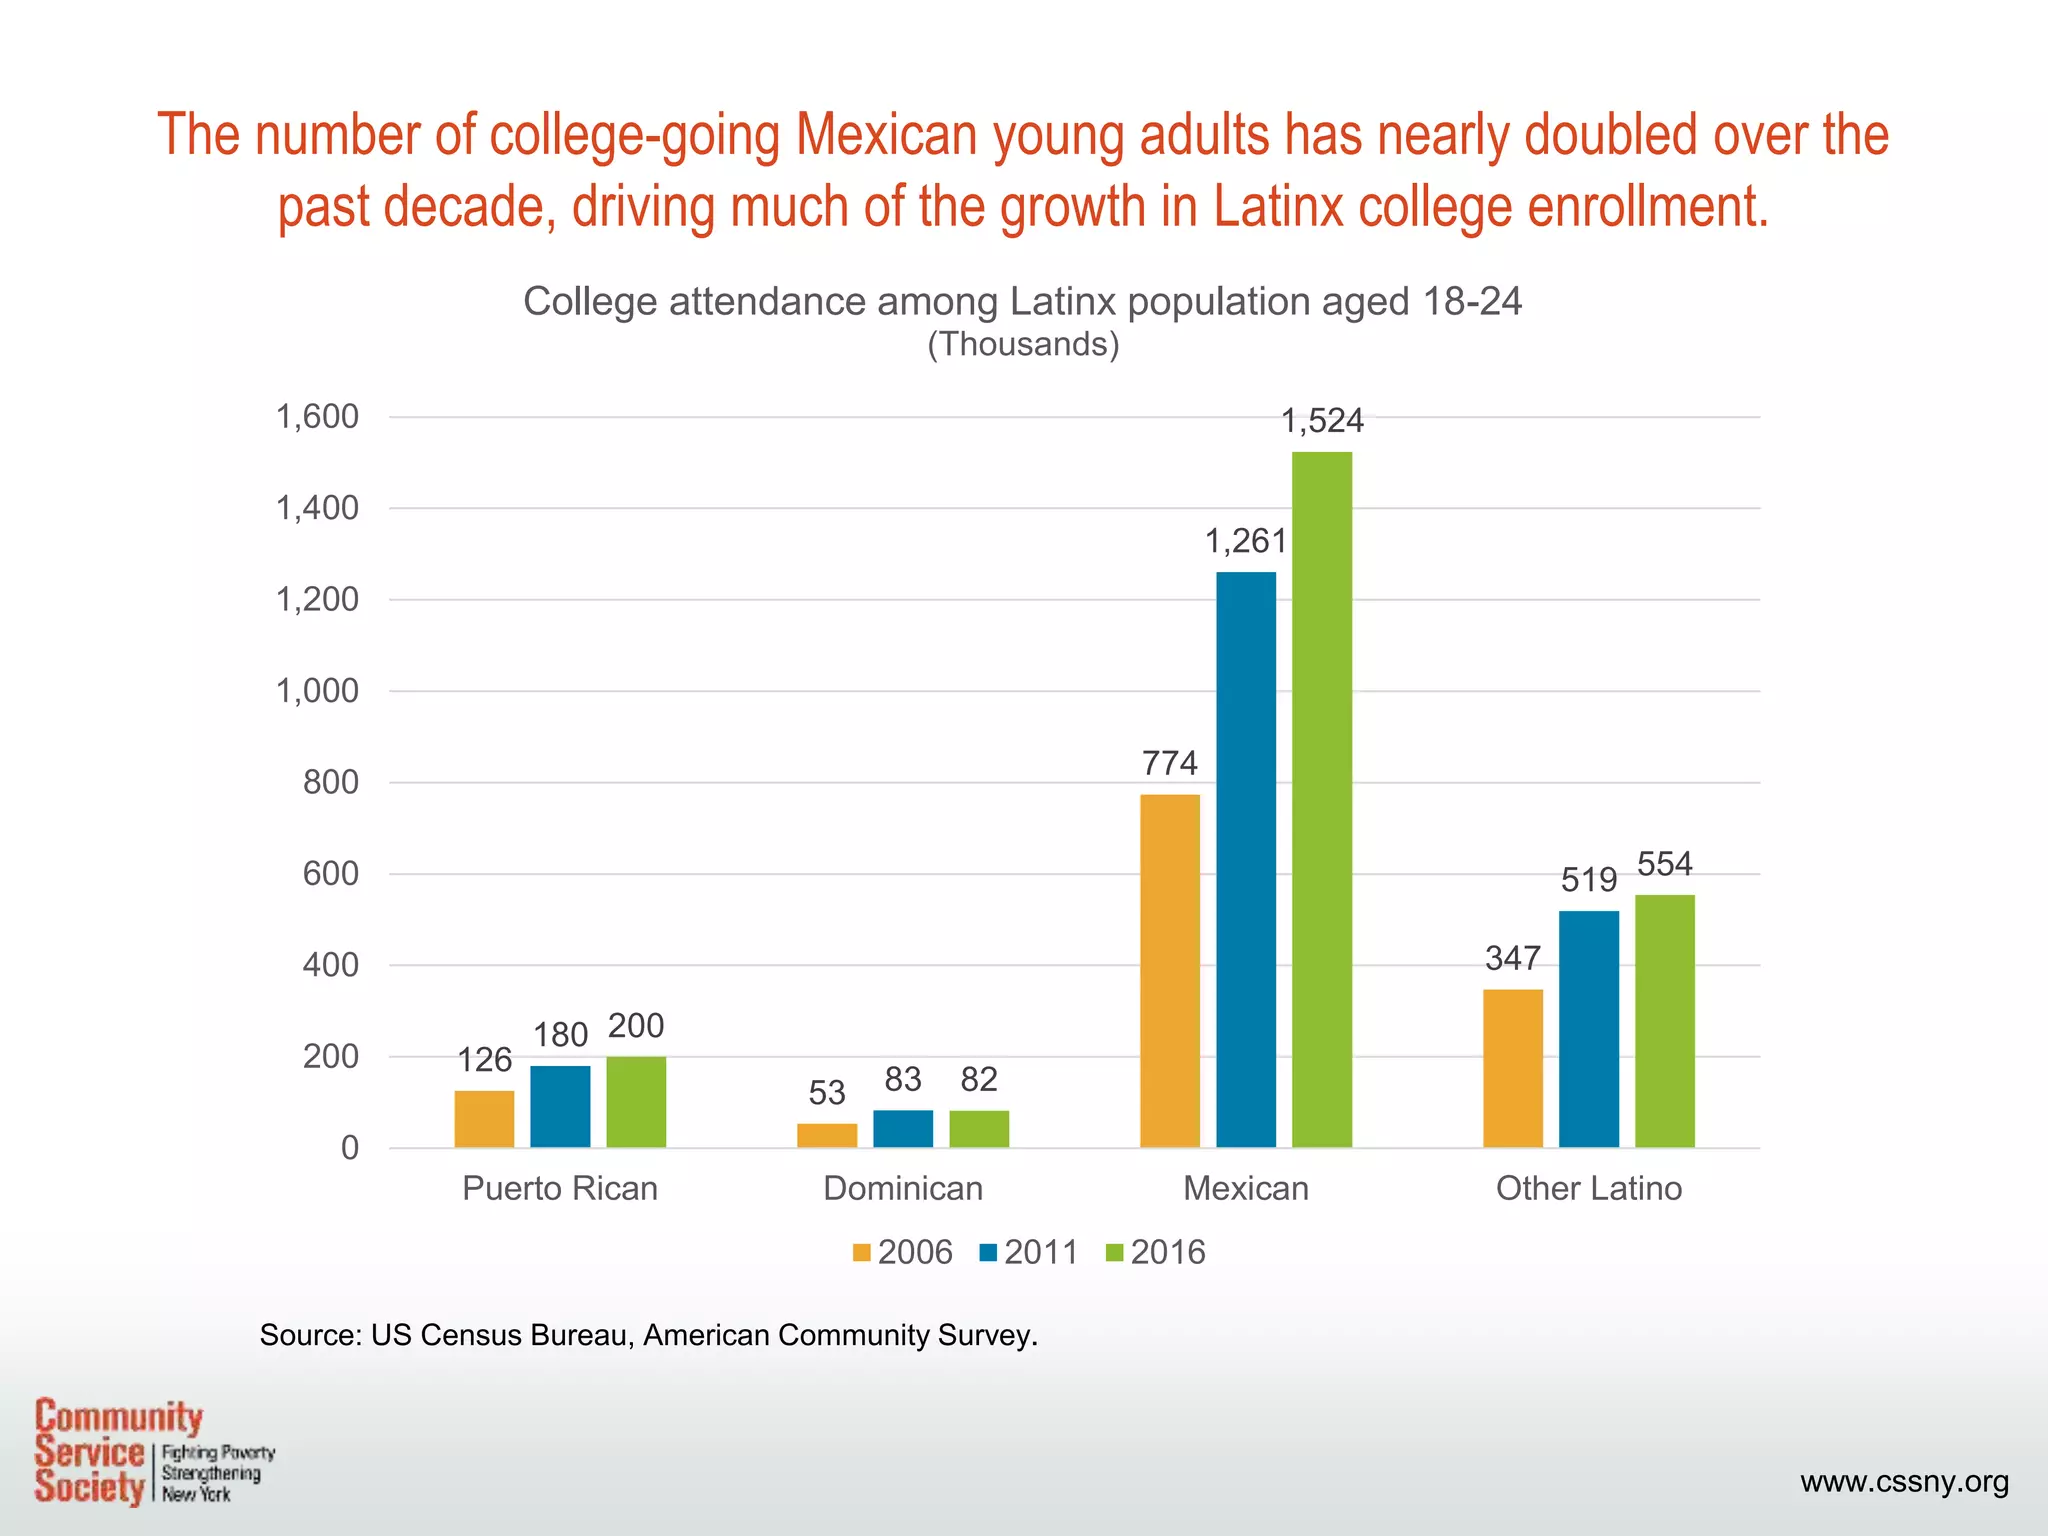
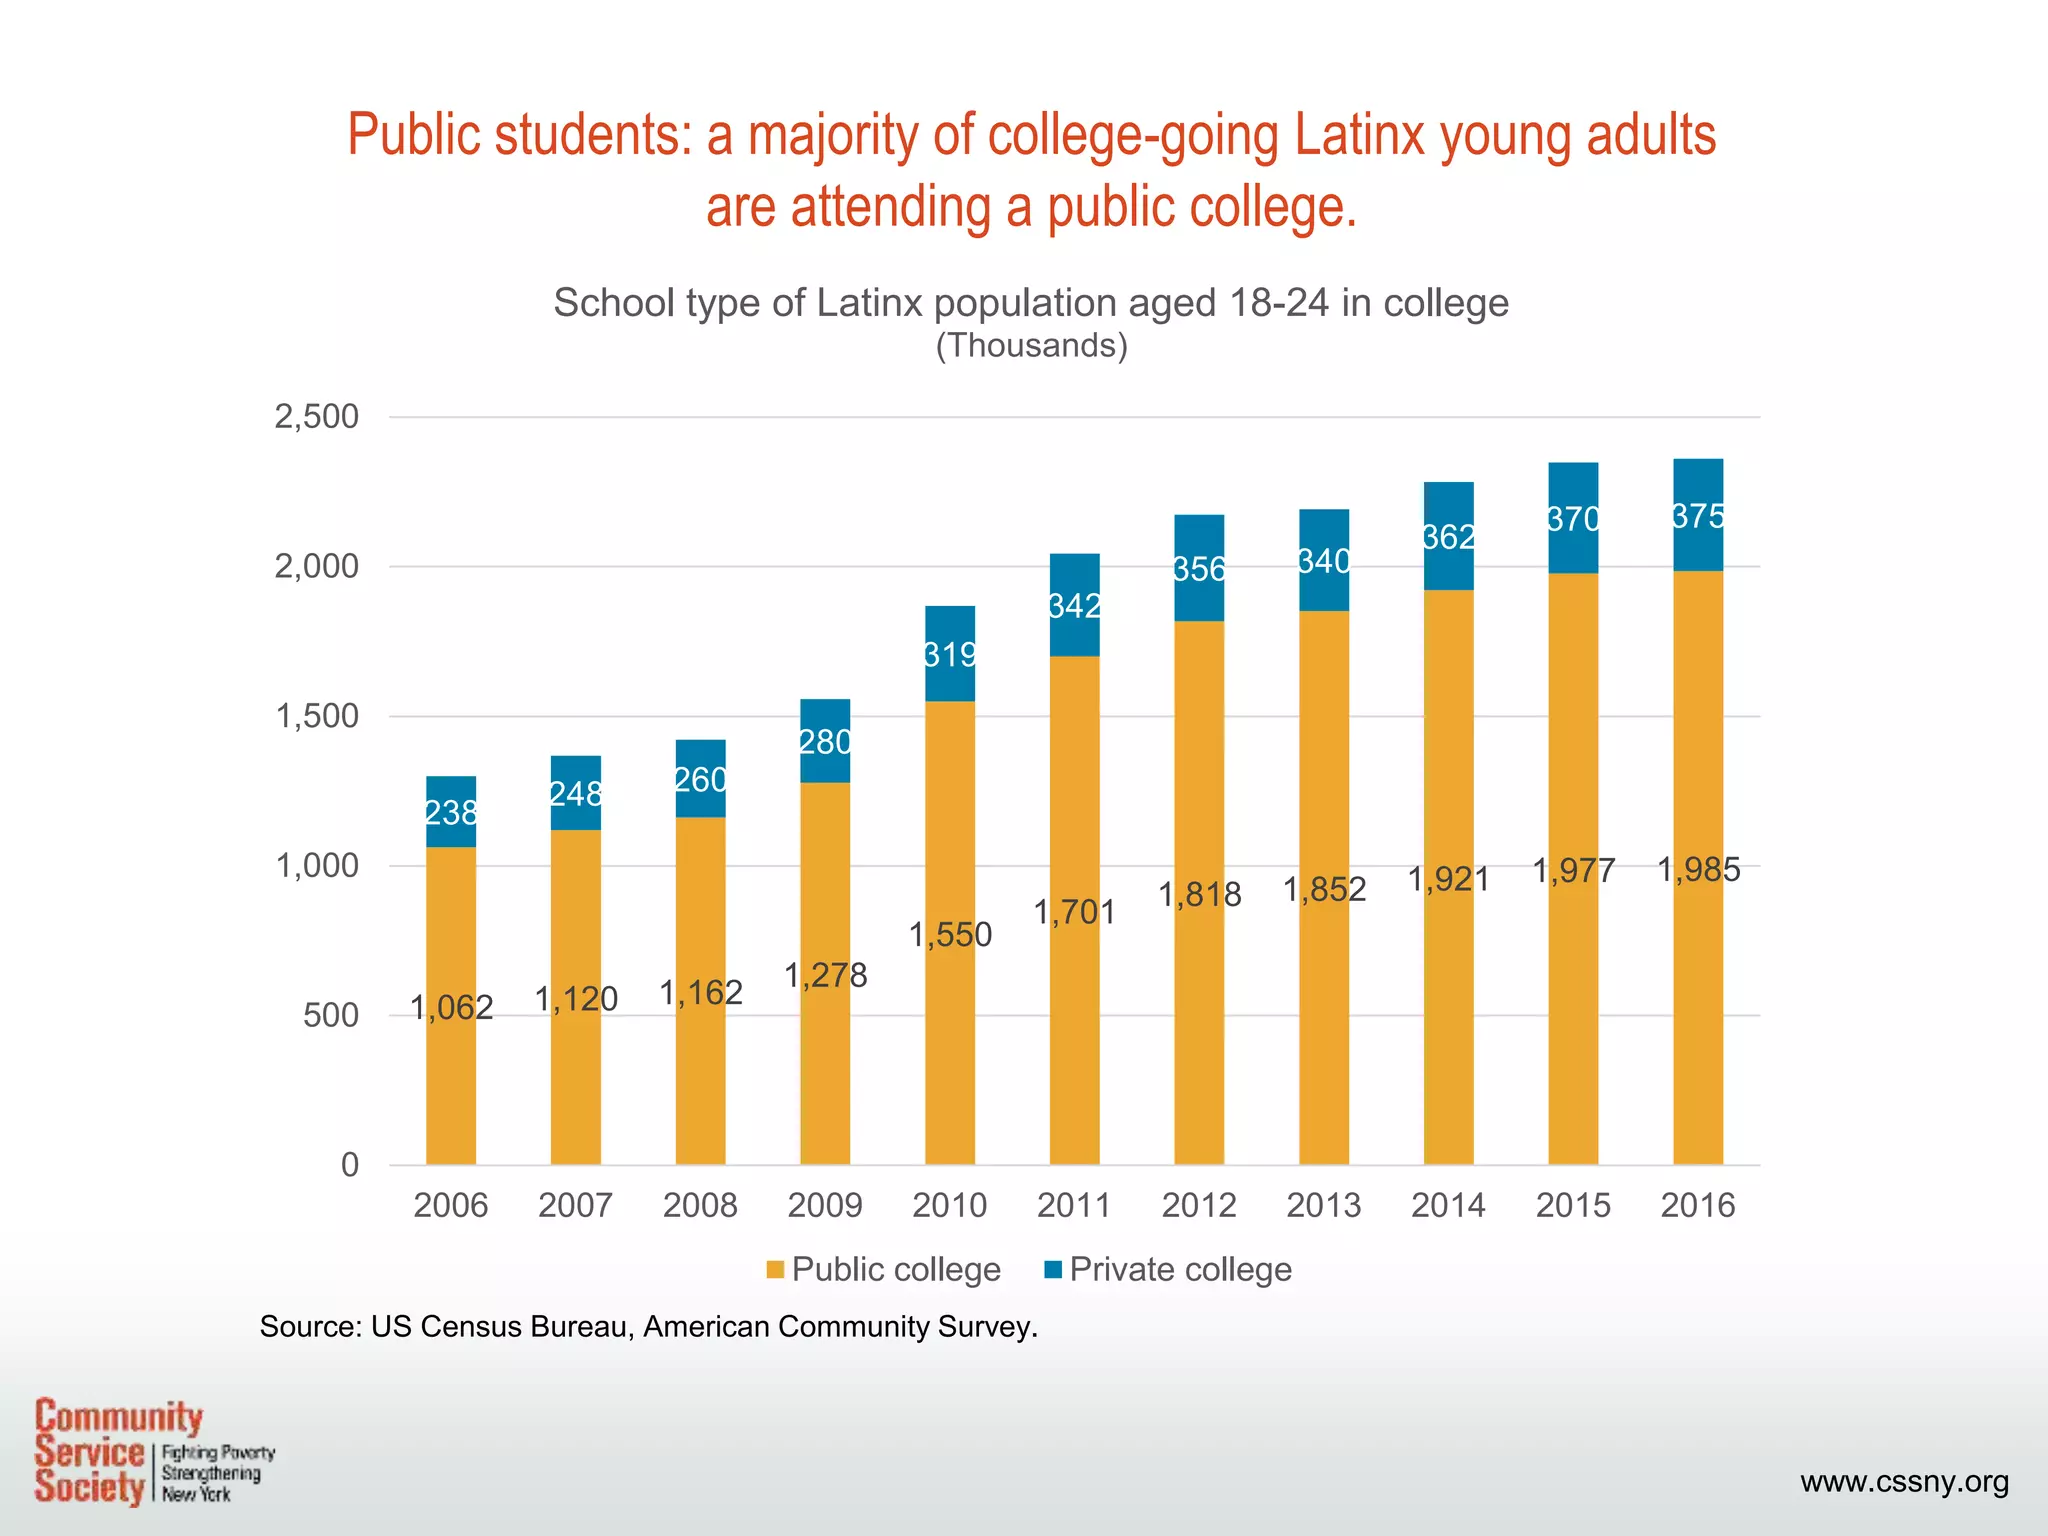
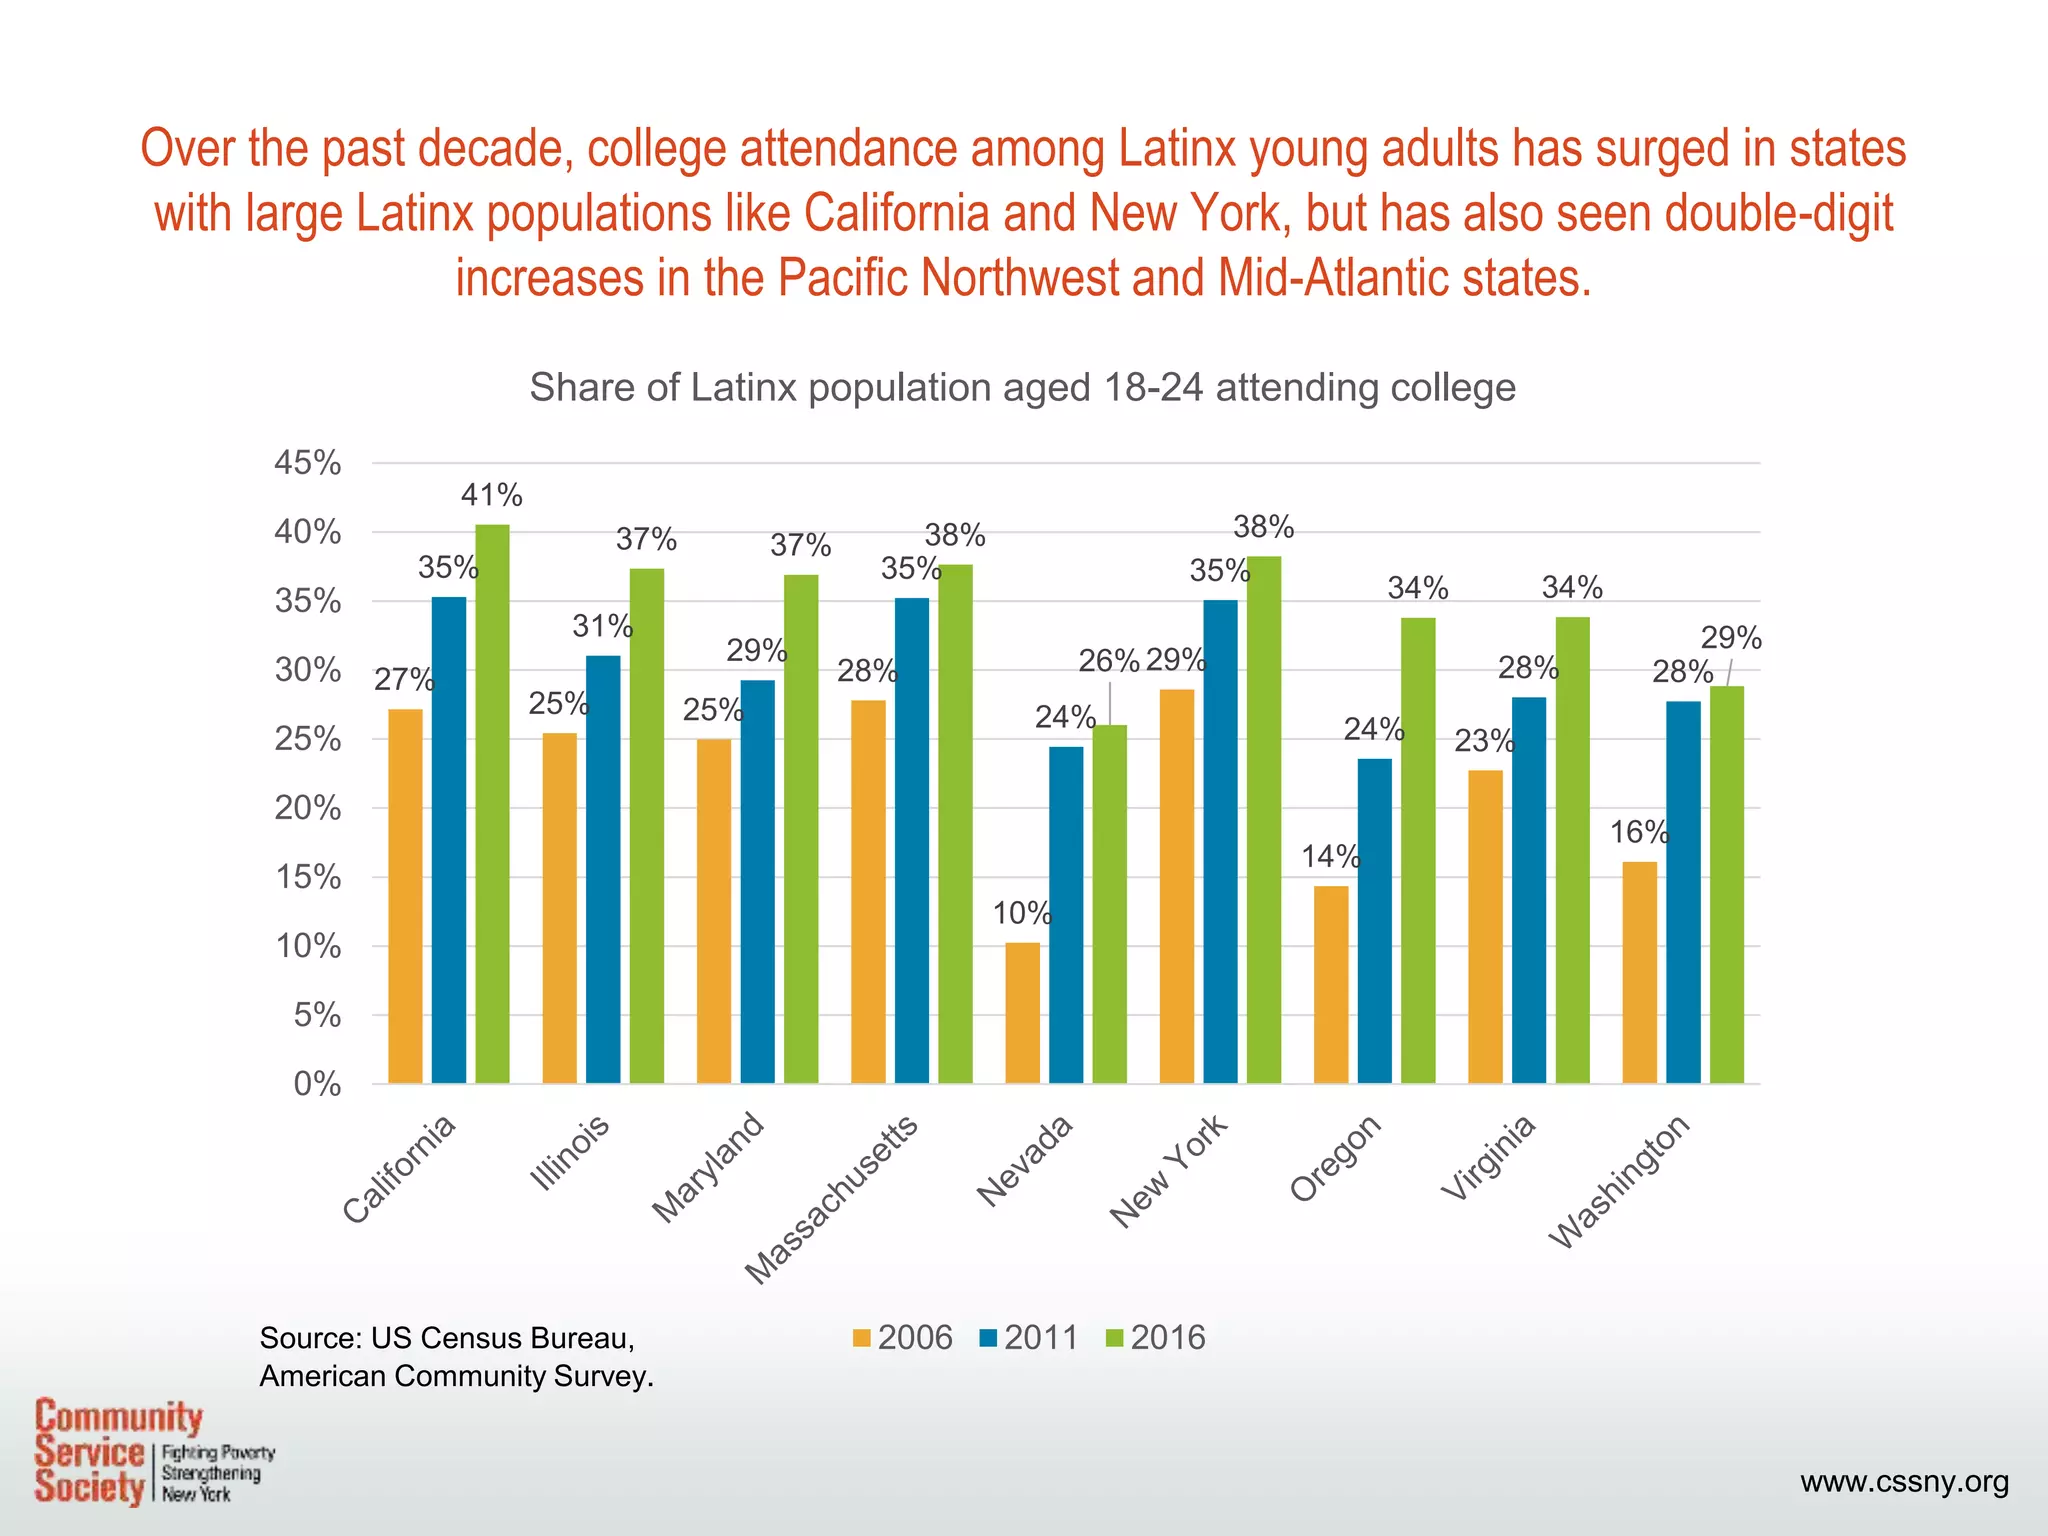
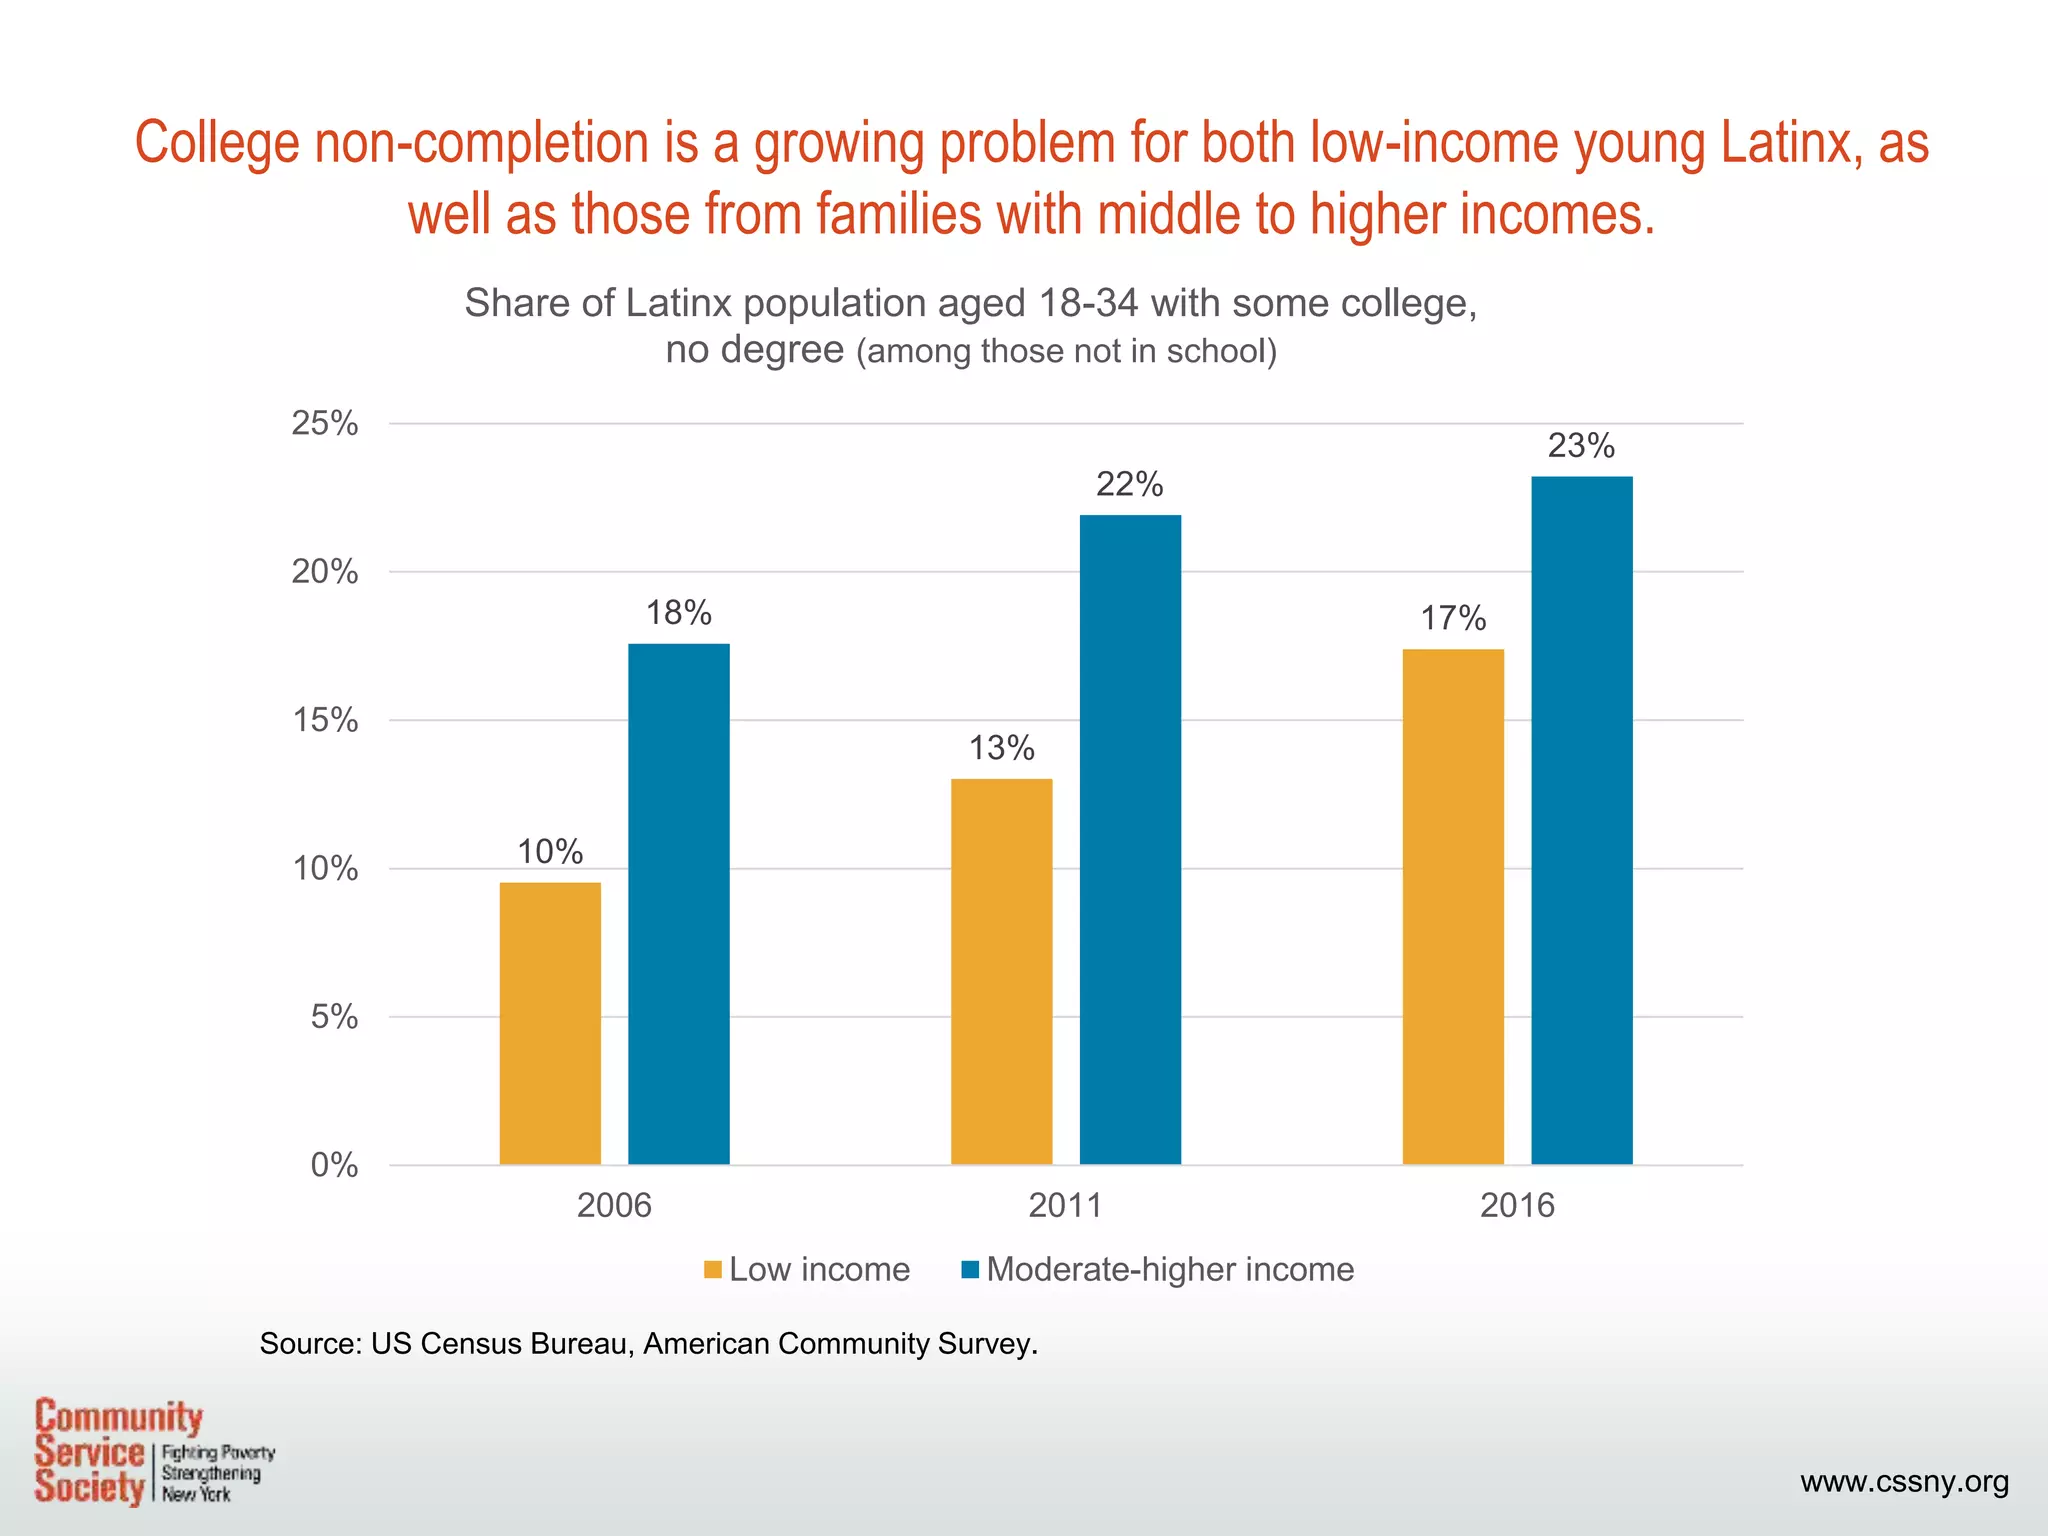
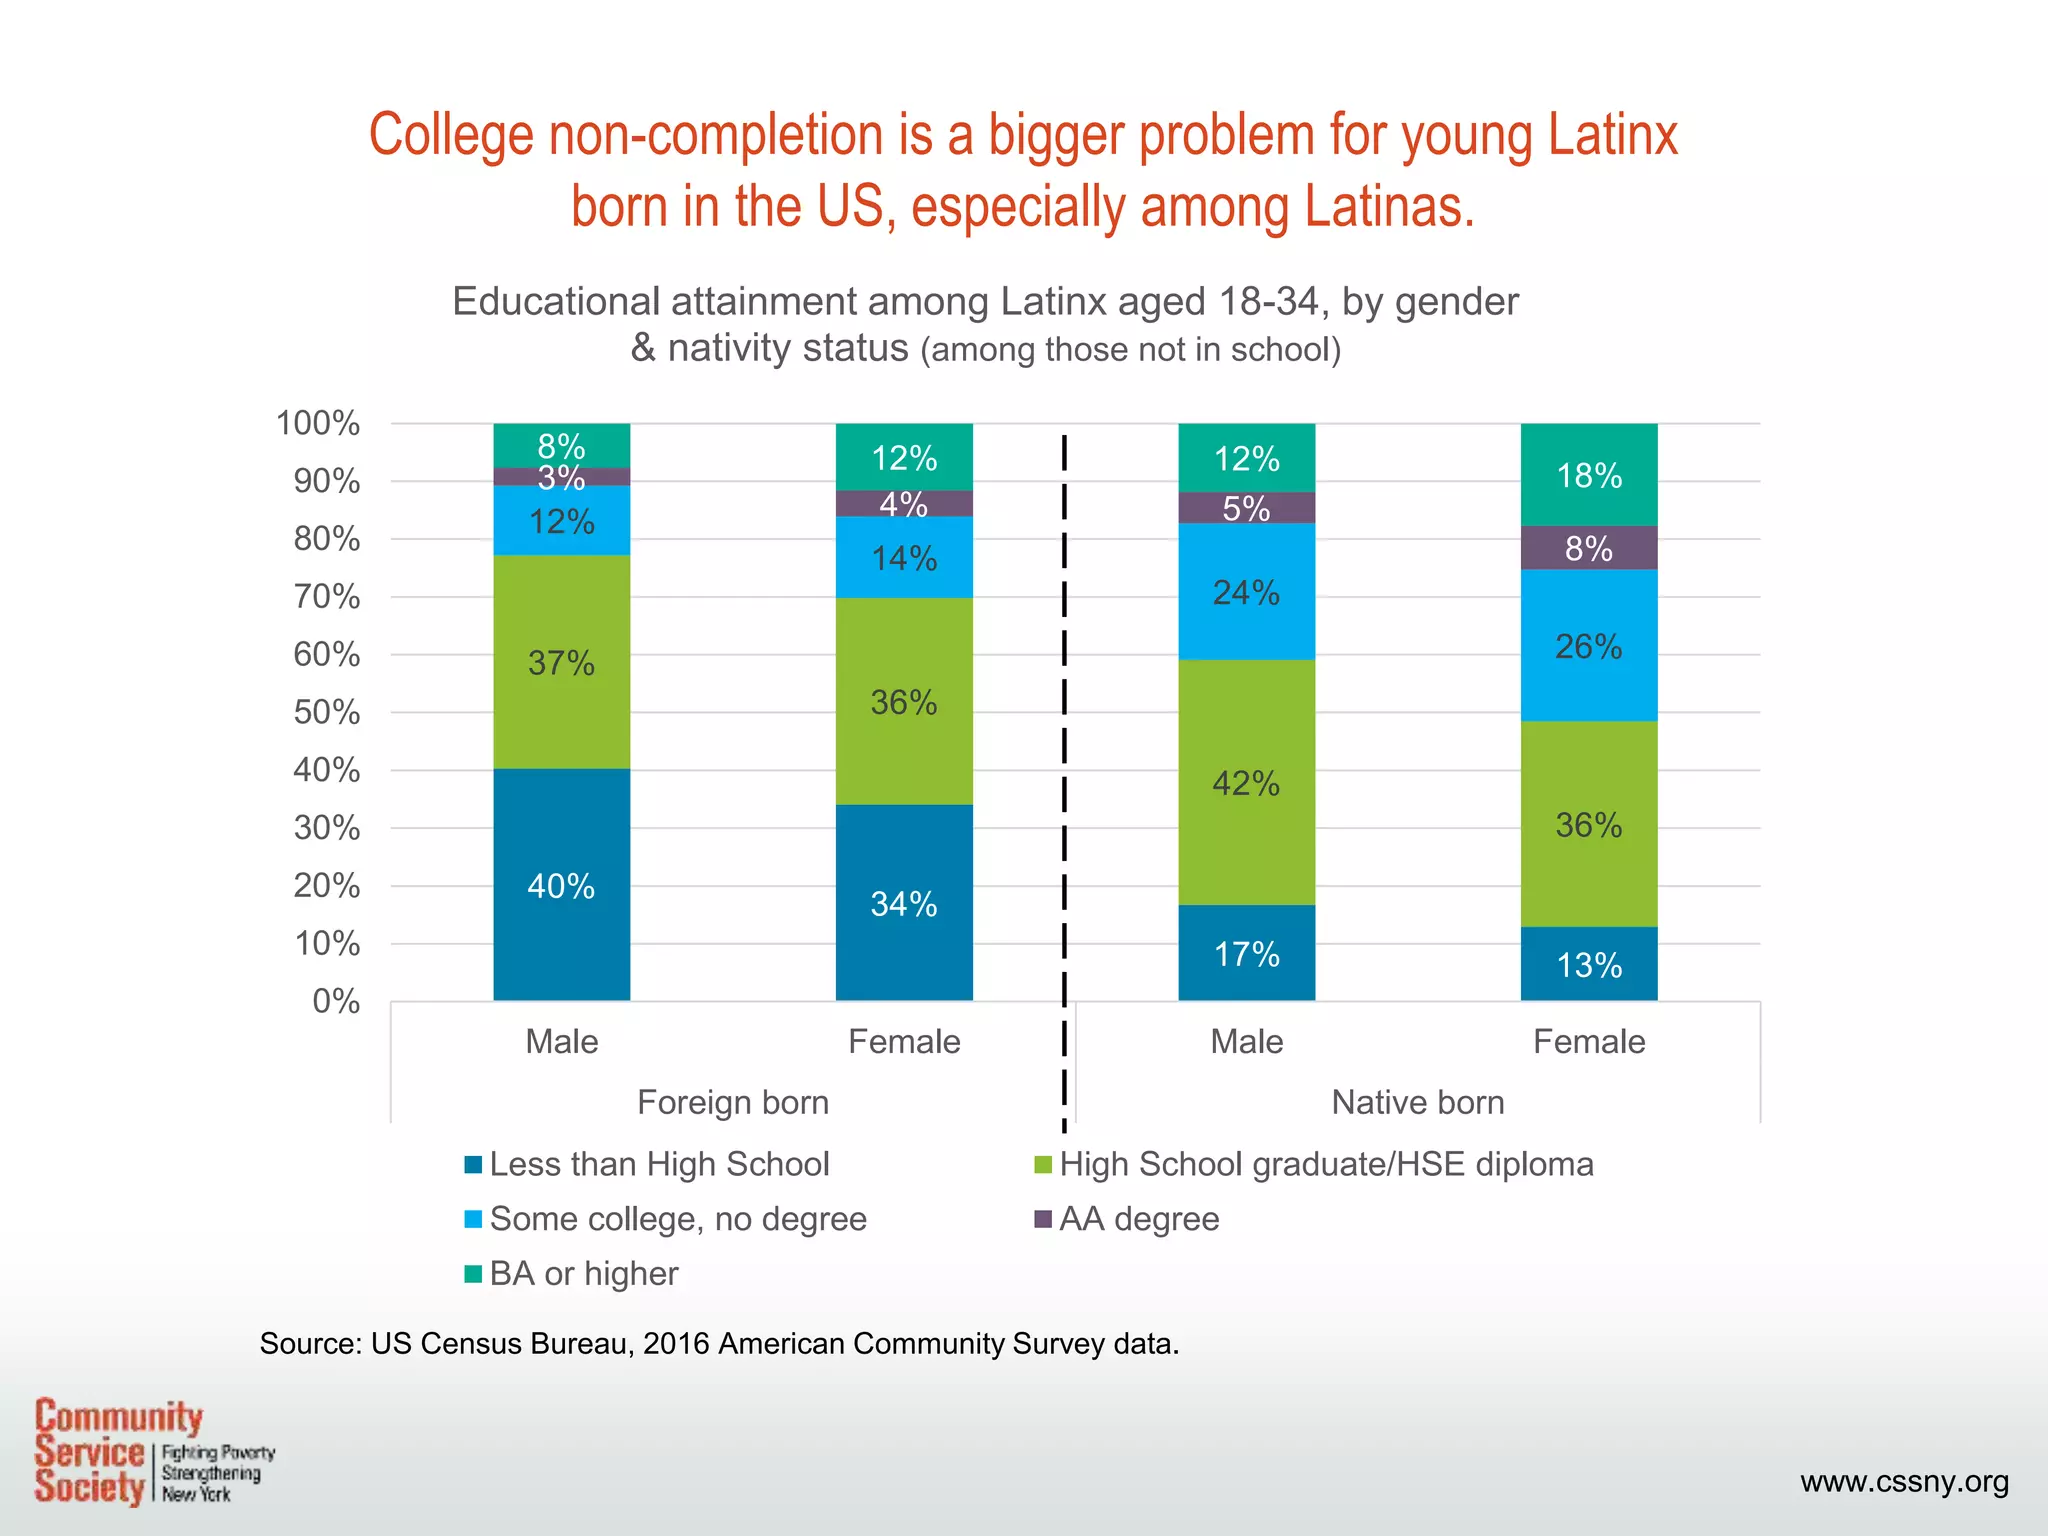
www.cssny.org
www.cssny.org
The number of Latinx young adults enrolled in college has increased
by 82 percent over the past decade.
Source: US Census Bureau, American Community Survey.
1.30
1.37
1.42
1.56
1.87
2.04
2.17 2.19
2.28
2.35 2.36
0.0
0.5
1.0
1.5
2.0
2.5
2006 2007 2008 2009 2010 2011 2012 2013 2014 2015 2016
Number of Latinx aged 18-24 attending college (Millions)
www.cssny.org
More than a third of Latinx young adults in the US are attending college, up from a
quarter a decade ago—no other subgroups show such growth.
Source: US Census Bureau, American Community Survey.
42%
31%
25%
55%
44%
36%
32%
58%
42%
35% 35%
58%
0%
10%
20%
30%
40%
50%
60%
70%
White Black Latinx Asian
Share of population aged 18-24 attending college
by race/ethnicity
2006 2011 2016
www.cssny.org
Native born: a majority of Latinx young adults enrolled in
college were born in the US.
Source: US Census Bureau, American Community Survey.
24% 23% 23% 21% 19% 19% 18% 18% 18% 18% 17% 17%
76% 77% 77% 79% 81% 81% 82% 82% 82% 82% 83% 83%
0%
10%
20%
30%
40%
50%
60%
70%
80%
90%
2005 2006 2007 2008 2009 2010 2011 2012 2013 2014 2015 2016
Nativity status of Latinx population aged 18-24
attending college
Foreign born Native born
www.cssny.org
The number of college-going Mexican young adults has nearly doubled over the
past decade, driving much of the growth in Latinx college enrollment.
Source: US Census Bureau, American Community Survey.
126
53
774
347
180
83
1,261
519
200
82
1,524
554
0
200
400
600
800
1,000
1,200
1,400
1,600
Puerto Rican Dominican Mexican Other Latino
College attendance among Latinx population aged 18-24
(Thousands)
2006 2011 2016
www.cssny.org
College attendance has risen for Latinx families across incomes, with a recent dip
for low-income families. This may be due to increasing college affordability
challenges.
Source: US Census Bureau, American Community Survey.
497 500 524
620
817
936
989 998
1,035
990 972
660
731 746
778
873
925
971 979
1,014
1,108 1,128
0
200
400
600
800
1,000
1,200
2006 2007 2008 2009 2010 2011 2012 2013 2014 2015 2016
Latinx population aged 18-24 attending college,
by income category (Thousands)
Low income Moderate-higher income
www.cssny.org
Public students: a majority of college-going Latinx young adults
are attending a public college.
Source: US Census Bureau, American Community Survey.
1,062 1,120 1,162
1,278
1,550
1,701
1,818 1,852 1,921 1,977 1,985
238
248 260
280
319
342
356 340
362
370 375
0
500
1,000
1,500
2,000
2,500
2006 2007 2008 2009 2010 2011 2012 2013 2014 2015 2016
School type of Latinx population aged 18-24 in college
(Thousands)
Public college Private college
www.cssny.org
Over the past decade, college attendance among Latinx young adults has surged in states
with large Latinx populations like California and New York, but has also seen double-digit
increases in the Pacific Northwest and Mid-Atlantic states.
Source: US Census Bureau,
American Community Survey.
27%
25% 25%
28%
10%
29%
14%
23%
16%
35%
31%
29%
35%
24%
35%
24%
28% 28%
41%
37% 37% 38%
26%
38%
34% 34%
29%
0%
5%
10%
15%
20%
25%
30%
35%
40%
45%
Share of Latinx population aged 18-24 attending college
2006 2011 2016
www.cssny.org
More HS grads, but more college non-completers: compared to a decade ago,
young Latinx are much less likely to have less than a HS degree. But college non-
completion is a growing problem.
Source: US Census Bureau, American Community Survey.
38%
36%
13%
4%
8%
32%
36%
18%
4%
9%
24%
38%
20%
5%
13%
0%
5%
10%
15%
20%
25%
30%
35%
40%
Less than High
School
High School
graduate/HSE
diploma
Some college, no
degree
Associate's
degree
BA degree or
higher
Educational attainment of Latinx population
Aged 18-34 (not in school)
2006 2011 2016
www.cssny.org
College non-completion is a growing problem for both low-income young Latinx, as
well as those from families with middle to higher incomes.
Source: US Census Bureau, American Community Survey.
10%
13%
17%18%
22%
23%
0%
5%
10%
15%
20%
25%
2006 2011 2016
Share of Latinx population aged 18-34 with some college,
no degree (among those not in school)
Low income Moderate-higher income
www.cssny.org
College non-completion is a bigger problem for young Latinx
born in the US, especially among Latinas.
Source: US Census Bureau, 2016 American Community Survey data.
40%
34%
17% 13%
37%
36%
42%
36%
12%
14%
24%
26%
3%
4% 5%
8%
8% 12% 12% 18%
0%
10%
20%
30%
40%
50%
60%
70%
80%
90%
100%
Male Female Male Female
Foreign born Native born
Educational attainment among Latinx aged 18-34, by gender
& nativity status (among those not in school)
Less than High School High School graduate/HSE diploma
Some college, no degree AA degree
BA or higher
www.cssny.org
College non-completion has become increasingly common among young Latinx
across the country, especially in the Pacific Northwest and states
along the US-Mexico border.
Source: US Census Bureau, American Community Survey.
14%
12%
19%
14%
15%
14%
12%
16%
13%
14%
22%
18%
20%
19%
15%
22%
16%
18%
16% 16%
23%
21%
25%
22%
24% 23%
19% 20%
18%
20%
0%
5%
10%
15%
20%
25%
30%
Share of Latinx population aged 18-34 with some college, no degree
(among those not in school)
2006 2011 2016

Promising gains, but barriers remain

  • 1.
  • 2.
    www.cssny.org The number ofLatinx young adults enrolled in college has increased by 82 percent over the past decade. Source: US Census Bureau, American Community Survey. 1.30 1.37 1.42 1.56 1.87 2.04 2.17 2.19 2.28 2.35 2.36 0.0 0.5 1.0 1.5 2.0 2.5 2006 2007 2008 2009 2010 2011 2012 2013 2014 2015 2016 Number of Latinx aged 18-24 attending college (Millions)
  • 3.
    www.cssny.org More than athird of Latinx young adults in the US are attending college, up from a quarter a decade ago—no other subgroups show such growth. Source: US Census Bureau, American Community Survey. 42% 31% 25% 55% 44% 36% 32% 58% 42% 35% 35% 58% 0% 10% 20% 30% 40% 50% 60% 70% White Black Latinx Asian Share of population aged 18-24 attending college by race/ethnicity 2006 2011 2016
  • 4.
    www.cssny.org Native born: amajority of Latinx young adults enrolled in college were born in the US. Source: US Census Bureau, American Community Survey. 24% 23% 23% 21% 19% 19% 18% 18% 18% 18% 17% 17% 76% 77% 77% 79% 81% 81% 82% 82% 82% 82% 83% 83% 0% 10% 20% 30% 40% 50% 60% 70% 80% 90% 2005 2006 2007 2008 2009 2010 2011 2012 2013 2014 2015 2016 Nativity status of Latinx population aged 18-24 attending college Foreign born Native born
  • 5.
    www.cssny.org The number ofcollege-going Mexican young adults has nearly doubled over the past decade, driving much of the growth in Latinx college enrollment. Source: US Census Bureau, American Community Survey. 126 53 774 347 180 83 1,261 519 200 82 1,524 554 0 200 400 600 800 1,000 1,200 1,400 1,600 Puerto Rican Dominican Mexican Other Latino College attendance among Latinx population aged 18-24 (Thousands) 2006 2011 2016
  • 6.
    www.cssny.org College attendance hasrisen for Latinx families across incomes, with a recent dip for low-income families. This may be due to increasing college affordability challenges. Source: US Census Bureau, American Community Survey. 497 500 524 620 817 936 989 998 1,035 990 972 660 731 746 778 873 925 971 979 1,014 1,108 1,128 0 200 400 600 800 1,000 1,200 2006 2007 2008 2009 2010 2011 2012 2013 2014 2015 2016 Latinx population aged 18-24 attending college, by income category (Thousands) Low income Moderate-higher income
  • 7.
    www.cssny.org Public students: amajority of college-going Latinx young adults are attending a public college. Source: US Census Bureau, American Community Survey. 1,062 1,120 1,162 1,278 1,550 1,701 1,818 1,852 1,921 1,977 1,985 238 248 260 280 319 342 356 340 362 370 375 0 500 1,000 1,500 2,000 2,500 2006 2007 2008 2009 2010 2011 2012 2013 2014 2015 2016 School type of Latinx population aged 18-24 in college (Thousands) Public college Private college
  • 8.
    www.cssny.org Over the pastdecade, college attendance among Latinx young adults has surged in states with large Latinx populations like California and New York, but has also seen double-digit increases in the Pacific Northwest and Mid-Atlantic states. Source: US Census Bureau, American Community Survey. 27% 25% 25% 28% 10% 29% 14% 23% 16% 35% 31% 29% 35% 24% 35% 24% 28% 28% 41% 37% 37% 38% 26% 38% 34% 34% 29% 0% 5% 10% 15% 20% 25% 30% 35% 40% 45% Share of Latinx population aged 18-24 attending college 2006 2011 2016
  • 9.
    www.cssny.org More HS grads,but more college non-completers: compared to a decade ago, young Latinx are much less likely to have less than a HS degree. But college non- completion is a growing problem. Source: US Census Bureau, American Community Survey. 38% 36% 13% 4% 8% 32% 36% 18% 4% 9% 24% 38% 20% 5% 13% 0% 5% 10% 15% 20% 25% 30% 35% 40% Less than High School High School graduate/HSE diploma Some college, no degree Associate's degree BA degree or higher Educational attainment of Latinx population Aged 18-34 (not in school) 2006 2011 2016
  • 10.
    www.cssny.org College non-completion isa growing problem for both low-income young Latinx, as well as those from families with middle to higher incomes. Source: US Census Bureau, American Community Survey. 10% 13% 17%18% 22% 23% 0% 5% 10% 15% 20% 25% 2006 2011 2016 Share of Latinx population aged 18-34 with some college, no degree (among those not in school) Low income Moderate-higher income
  • 11.
    www.cssny.org College non-completion isa bigger problem for young Latinx born in the US, especially among Latinas. Source: US Census Bureau, 2016 American Community Survey data. 40% 34% 17% 13% 37% 36% 42% 36% 12% 14% 24% 26% 3% 4% 5% 8% 8% 12% 12% 18% 0% 10% 20% 30% 40% 50% 60% 70% 80% 90% 100% Male Female Male Female Foreign born Native born Educational attainment among Latinx aged 18-34, by gender & nativity status (among those not in school) Less than High School High School graduate/HSE diploma Some college, no degree AA degree BA or higher
  • 12.
    www.cssny.org College non-completion hasbecome increasingly common among young Latinx across the country, especially in the Pacific Northwest and states along the US-Mexico border. Source: US Census Bureau, American Community Survey. 14% 12% 19% 14% 15% 14% 12% 16% 13% 14% 22% 18% 20% 19% 15% 22% 16% 18% 16% 16% 23% 21% 25% 22% 24% 23% 19% 20% 18% 20% 0% 5% 10% 15% 20% 25% 30% Share of Latinx population aged 18-34 with some college, no degree (among those not in school) 2006 2011 2016