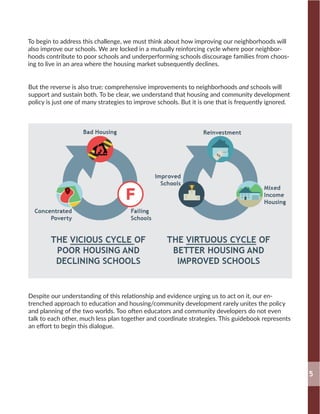
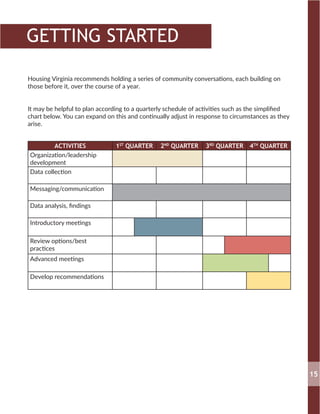
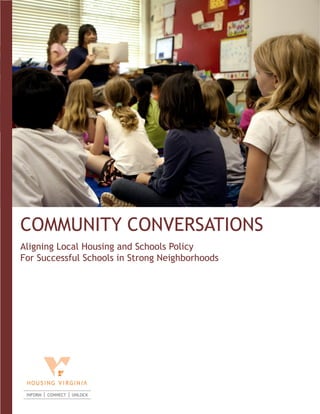
This document provides guidance for communities to have conversations about aligning local housing and school policies to promote successful schools and strong neighborhoods. It recommends a phased approach over a year, beginning with organizing leaders, collecting data on neighborhoods, housing and schools, and holding introductory meetings to discuss challenges and options. Subsequent phases include analyzing data, developing recommendations, and sustaining the housing-schools connection long-term. The goal is to forge partnerships and recommend strategies by considering best practices and shared aspirations. Framing the issues properly through inclusive language is important to engage communities on this emotional topic.
Chaired by Lydia A. Hollie, JD/MAED, the Long Beach Youth and Gang Violence Task Force, in collaboration with the Long Beach Weed and Seed Program Steering Committee, spearheaded efforts that led to the acquisition of $400,000 for the Long Beach Gang Reduction, Intervention and Prevention Project. This project was designed to address critical unmet community needs necessary to effectively address growing youth andgang violence through a youth-centered, community-wide approach. Project efforts are expected to reduce violent crimes, decrease the number of gang-related offenses, and thereby increase self-esteem and self-worth. In April 2008, the California Governor's Office awarded $400,000 to the city of Long Beach to advance these efforts. In February 2009, the Long Beach Youth and Gang Violence Task Force transitioned into the Long Beach CalGRIP Advisory Council with direct oversight of fund allocations and program outcomes.
3 Solutions to Support Greater Educational Equity Right NowDreamBox Learning
Investing more money, dedicating more people, and doing more to improve schools and support teachers is needed for educational equity, but here are 3 things you can do to support greater educational equity right now.
FACTS SCHOOL INTEGRATIONThe Benefits of SocioeconomicallyMargaritoWhitt221
FACTS SCHOOL INTEGRATION
The Benefits of Socioeconomically and Racially Integrated Schools and
Classrooms
APRIL 29, 2019
https://tcf.org/topics/education/school-integration/
https://tcf.org/
Research shows that racial and socioeconomic diversity in the classroom can provide students with a range of cognitive and
social benefits. And school policies around the country are beginning to catch up. Today, over 4 million students in America are
enrolled in school districts or charter schools with socioeconomic integration policies—a number that has more than doubled
since 2007.
Here’s why the growing momentum in favor of diversity in schools is good news for all students:
Academic and Cognitive Benefits
On average, students in socioeconomically and racially diverse schools—regardless of a student’s own economic status—have
stronger academic outcomes than students in schools with concentrated poverty.
Students in integrated schools have higher average test scores. On the 2011 National Assessment of Educational
Progress (NAEP) given to fourth graders in math, for example, low-income students attending more affluent schools scored
roughly two years of learning ahead of low-income students in high-poverty schools. Controlling carefully for students’
family background, another study found that students in mixed-income schools showed 30 percent more growth in test
scores over their four years in high school than peers with similar socioeconomic backgrounds in schools with concentrated
poverty.
Students in integrated schools are more likely to enroll in college. When comparing students with similar
socioeconomic backgrounds, those students at more affluent schools are 68 percent more likely to enroll at a four-year
college than their peers at high-poverty schools.
Students in integrated schools are less likely to drop out. Dropout rates are significantly higher for students in
segregated, high-poverty schools than for students in integrated schools. During the height of desegregation in the 1970s
and 1980s, dropout rates decreased for minority students, with the greatest decline in dropout rates occurring in districts
that had undergone the largest reductions in school segregation.
Integrated schools help to reduce racial achievement gaps. In fact, the racial achievement gap in K–12 education closed
more rapidly during the peak years of school desegregation in the 1970s and 1980s than it has overall in the decades that
followed—when many desegregation policies were dismantled. More recently, black and Latino students had smaller
achievement gaps with white students on the 2007 and 2009 NAEP when they were less likely to be stuck in high-poverty
school environments. The gap in SAT scores between black and white students continues to be larger in segregated
districts, and one study showed that change from complete segregation to complete integration in a district could reduce as
much as one quarter of the current SAT scor ...
Fighting Education Inequality: Segregation in K-12 Schooling & Legacy Preferences in Higher Education. A talk by Richard D. Kahlenberg, Senior Fellow, The Century Foundation , November 10, 2011 at the Education Law Association, Chicago, Illinois
EDD614ASSIGNMENTCASE2Trident International University .docxbudabrooks46239
EDD614ASSIGNMENTCASE2
Trident International University
James Newton
EDD 614
Assignment Case 2
Dr. James Hodges
February 10, 2020
“Impact of Poverty on the Education Success of Children”
Background
Education is one of the most fundamental rights across the world. However, access to education continues to vary cross different communities, cultures and ethnic backgrounds. Numerous studies have attempted to explore the causes of variations in access and successful educational outcomes across different groups of people. Riedi, Dawn and Kim (2017) state that learners with the capacity to deliver high academic performance exist in all income levels across the United States. Nonetheless, the success rates of learners from low-income backgrounds continue to be lower than their wealthy counterparts. While the dropout rates have reduced phenomenally from low-income neighborhoods, children from wealthy families still register the lowest dropout rates. Level of income coupled with gender factors may also play a role in school dropout rates or low academic performance for children from poor backgrounds. A longitudinal qualitative study undertaken by Ramanaik et al. (2018) found that for many poor families, girls’ domestic tasks came at the cost of schooling with greater concerns regarding the need to safeguard their sexual purity. Furthermore, with the rising desire of the girls’ educational and career goals, parents often encourage girls’ agencies to communicate openly both at home and in school. Children from poor households are also less motivated to work harder in school compared to their contemporaries from wealthy backgrounds. Friels (2016) observes that scholars have tried to make efforts towards exploring the influence of poverty on student success. According to Friels (2016), a combination of factors such as poverty, race and ethnicity have been the defining indicators of student academic attainment. For instance, African American children from low-income neighborhoods continue to face challenges such as low classroom attendance and dropout rates compared to their peers from financial stable backgrounds. In light of the above, this qualitative study will investigate the effects of poverty on educational success in children.
Research Problem
The indicators of academic achievements are often widely recognized across different sides of the scholarly divide. They include hard work, student competence and abilities, school culture, as well as teachers’ competencies. While these factors have been expansively identified and explored by scholars, one major area of research has often been overlooked: the extent to which poverty or level of income impacts educational outcomes for children. Renth, Buckley and Pucher (2015) observe that even though studies exist on this problematic area of knowledge, there have been minimal qualitative explorations on the influence of poverty on children’s educational outcomes. For instance, major qualit.
America’s education system is based on the assumption that barring illness or an extraordinary event, students are in class every weekday. So strong is this assumption that it is not even measured. Indeed, it is the rare state education department, school district or principal that can tell you how many students have missed 10 percent or more of the school year or in the previous year missed a month or more school − two common definitions of chronic absence.
Presentation by Richard D. Kahlenberg for the Looking Back, Moving Forward Conference - March 2013, University of Richmond and Virginia Commonwealth University
Omar FallatahEnglish 101 Mr. Andrew Vanden BosschePove.docxhopeaustin33688
Omar Fallatah
English 101
Mr. Andrew Vanden Bossche
Poverty has negatively affected the Education in America
There are almost 2,7 million
The most people who have effected by poverty are low income.
They extremely have a hard time to build their future. According to the New York Times, “Another 2.6 million people slipped into poverty in the United States last year. According to the Census Bureau reported , and the number of Americans living below the official poverty line, 46.2 million people, was the highest number in the 52 years the bureau has been publishing figures on it. And in new signs of distress among the middle class, median household incomes fell last year to levels last seen in 1996.Lower income families who have a large number of children will accord this problem .The households can't cover the home needing. They have not the all ability to cover the family needing. There are many issues that really impact these people. There is so much stuff for lower income to cover in united state. They must to buy car insurance, health insurance, school tuition and others households needing."
By the year 2020, the majority of students in America's public schools will be living in circumstances that will categorize them as at risk of educational failure. A person's education is closely linked to the individual's life chances, income, and well being"
(Battle and Lewis 2002). Moreover, in the last ten years, there was growing a huge gap between the top income class and the less income class
There are three issues which are the most effected the education in America. They are food supply, The lower income people can't provide enough food for themselves. The households are having a hard time to provide en enough food for their children. Drop-off in the reach of U.S. summer nutrition programs in 2010 and ongoing budget-cutting at state and local levels suggest that many schoolchildren in the United States will face another summer of hunger this year. According to a new report from the Food Research and Action Center, despite record numbers of children receiving free and reduced-price meals during the 2009-10 school years, participation in federal summer nutrition programs fell nationally in 2010. FRAC reports that in July 2010 only 15 children received nutrition aid for every 100 low-income students who received lunch during the 2009-10 school years. The food supply is really affected the kids to be success in their school. The way to solve this issue is must provide enough food that could be useful to a void . " One in eight Americans — 37 million — received emergency food help last year, up 46% from 2005, the nation's largest hunger-relief group reports today. Children are hit particularly hard, according to the report by Feeding America, a network of 203 food banks nationwide. One in five children, 14 million, received food from soup kitchens, food pantries and other agencies, up from 9 million in 2005, the year of the group's la.
CHAPTER 5 School Issues that Relate to At-Risk Children and Youth.docxchristinemaritza
CHAPTER 5: School Issues that Relate to At-Risk Children and Youth
· If families do not…Then schools must
· Provide roots for children…So they stand firm and grow,
· Provide wings for children…So they can fly.
· Broken roots and crippled wingsDestroy hope.
· And hope sees the invisible,Feels the intangible,And achieves the impossible.
CHAPTER OUTLINE
The Value of Education
Box 5.1 Separate and Unequal 15-Year-Olds
Research on Effective Schools
Variables in Research on School Effects
· Leadership behaviors
· Academic emphasis
· Teacher and staff factors
· Student involvement
· Community support
· Social capital
Definitional Issues in Research on School Effects
Case Study: The Diaz Family
· School culture
· Student climate
· Peer involvement
· Teacher climate
Box 5.2 Teacher Climate
Educational Structure: Schools and Classrooms
School Structure
School Choice
Charter Schools
Classroom Structure
Curriculum Issues
Conclusion
· In education, the term at risk refers primarily to students who are at risk of school failure. As we discussed earlier, at risk actually means much more than flunking reading or math, or even dropping out of school. Yet from an educator’s perspective, educational concerns define at-risk issues. School problems and dropout are linked to many other problems expressed by young people (Suh, Suh, & Houston, 2007; Henry et al., 2009; Rumberger & Ah Lim, 2008). The strong relationships between school difficulties and other problems, as well as evidence that educational involvement is a protective factor influencing resilience (Search Institute, 2006), highlight the pivotal position of schools. In schools, prevention efforts can reach the greatest number of young people; therefore, examining the educational environment is critical.
THE VALUE OF EDUCATION
There are a number of indicators of the value placed on education in the United States. News reports compare the scores of students in the United States and in other countries on tests in geography and spelling, math and science. These reports consistently favor students in other countries. They imply that learning in U.S. schools is somehow not quite up to par. Does a student’s ability to spell reflect his or her ability to think? Does recall of dates, locations, or facts indicate a student’s problem-solving skills? The answer to these questions is “No.” Learning is the act of acquiring knowledge or a skill through observation, experience, instruction, or study, yet these comparisons suggest a view of learning that reduces this complicated act to an isolated and mechanical process. In addition, these comparisons often fail to note that in the United States all children are expected to attend school through high school graduation, not just wealthy or middle-class urban or college-bound students.
How learning is valued is also reflected in the following statistics. In 2000, the average household income was about $55,000 (Census Bureau, 2001). Nearly 10 years later, the average teac ...
3. TABLE OF CONTENTS
INTRODUCTION
GETTING STARTED
PHASE ONE Organize, Recruit Leaders, and Initiate Process
PHASE TWO Frame the Issues and Launch the Conversation
PHASE THREE Widen the Circle and Share Recommendations
PHASE FOUR What Comes Next: Sustaining the Housing-Schools
Connection
GLOSSARY
3
15
19
26
33
35
36
5. One of the first questions Realtors® typically hear from potential home buyers is, “What school
district is this house in?” A family ready to buy a new home often narrows their search to select-
ed school districts.
In response to that demand, home
values in sought-after districts of
high performing schools rise to
levels that exclude all but the more
affluent families, and quality public
schools become a privilege. Neigh-
borhoods where people live less
by choice than by economic neces-
sity become known for struggling
schools that offer little promise of
greater opportunity.
At Housing Virginia, we see value in focusing on the interdependence of schools and neigh-
borhoods. The academic achievements of individual students and the cumulative performance
of their schools have as much to do with the neighborhoods, homes, and families beyond the
school building as with the teachers, curriculum, resources, and environment within it. Likewise,
for neighborhoods to thrive and have wide appeal, they must provide schools that demonstrate
success and earn parents’ confidence and trust.
3
INTRODUCTION
1
Jill Khaddur, Heather Schwartz, and Jennifer Turnham, Enterprise Community Partners, “Reconnecting Schools and Neighborhoods:
An introduction to school-centered community revitalization”, 2007, http://www.abtassociates.com/reports/64701.pdf
After family and school factors,
“...Neighborhood conditions [explain]
a smaller, but third-largest portion of
student performance.”
From Reconnecting Schools and Neighborhoods:
An introduction to school-centered community
revitalization1
6. Yet around the country and here in Virginia, we have habitually acclaimed individual schools and
whole systems that “succeed” or blamed those that “fail”. We accept that good neighborhoods
have highly ranked schools and that failing schools are in bad neighborhoods.
The stratified pattern of struggling students in low-performing schools within stressed, impover-
ished neighborhoods of low opportunity is intensifying and spreading.
4
2
Heather Schwartz, The Century Foundation, “Housing Policy is School Policy: Economically Integrative Housing Promotes Academic
Success in Montgomery County, MD”, 2010, https://tcf.org/assets/downloads/tcf-Schwartz.pdf
5 Ways Socioeconomically Diverse Neighborhoods
can Impact Schools2
:
1. Improved teacher quality and lower turnover
2. Safer, more stable school environment
3. Increased parent involvement and commitment
4. More positive teacher-student interactions with higher
expectations
5. Positively reinforcing peer interactions
7. To begin to address this challenge, we must think about how improving our neighborhoods will
also improve our schools. We are locked in a mutually reinforcing cycle where poor neighbor-
hoods contribute to poor schools and underperforming schools discourage families from choos-
ing to live in an area where the housing market subsequently declines.
Despite our understanding of this relationship and evidence urging us to act on it, our en-
trenched approach to education and housing/community development rarely unites the policy
and planning of the two worlds. Too often educators and community developers do not even
talk to each other, much less plan together and coordinate strategies. This guidebook represents
an effort to begin this dialogue.
5
But the reverse is also true: comprehensive improvements to neighborhoods and schools will
support and sustain both. To be clear, we understand that housing and community development
policy is just one of many strategies to improve schools. But it is one that is frequently ignored.
8. What We Know
Stable, thriving urban and suburban neighborhoods tend to have certain positive qualities in
common, what economists call the “housing bundle” - all the components that embody what we
call home.
The Center for
Housing Policy (the
research arm of the
National Housing
Conference) finds that
access to affordable
housing is a signifi-
cant contributor to a
student’s academic
performance.3
The most
fundamental is
the affordability
of quality hous-
ing, whether
owned or rented.
Repeated research
reviews over the past
ten years suggest a
strong correlation
between housing and
improved educational
outcomes.
6
3
Jeffrey Lubell and Maya Brennan, Center for Housing Policy, Enterprise Community Partners, “The Positive Impact of Affordable Housing
on Education”, 2007, https://s3.amazonaws.com/KSPProd/cache/documents/651/65111.pdf
9. 7
Research demonstrates that “in-school factors account for only a third or less of the variation of
test scores” between affluent and low-income students in the United States with a child’s family
and the neighborhood in which they live equally contributing to educational outcomes.
The socioeconomic achievement gap has
widened by 30 to 40 percent in the last half
century, paralleled since 2000 by an increase
in areas of concentrated poverty in our
communities.
More than 16 million American children are
growing up in impoverished households, half
of them in neighborhoods of concentrated
poverty where 30 percent or more of house-
holds are at or below the federal poverty
line.
The achievement gap between economically disadvantaged students and their counterparts in
more affluent neighborhoods and schools may be worse than the most commonly relied upon
measure has led us to believe.
Family
School
Neighborhood
10. Federal education laws, now ensconced in the Every Child Succeeds Act (ESSA), require states to
report National Assessment of Educational Progress (NAEP) scores separately for children iden-
tified as economically disadvantaged based on their eligibility for Free and Reduced Lunch (FRL).
The difference between those children’s scores and the scores of children who are not eligible
for subsidized meals defines “the achievement gap”.
Yet recent research from the University of
Michigan suggests that this default metric
is concealing a much greater vulnerability
for the smaller percentage of 8th
grade stu-
dents who had met FRL criteria every year
beginning in kindergarten.
In Michigan these “persistently disadvan-
taged” students were about three grade
levels behind their solidly middle class and
affluent peers, compared to a two- grade
level gap for all FRL-eligible 8th
graders.
According to national data, children consistently FRL-eligible throughout elementary and middle
school began kindergarten in households with incomes less than half that of their peers who
ultimately were only occasionally FRL-eligible.4
8
4
Susan Dynarski, “Why American Schools Are Even More Unequal Than We Thought”, Economic View, The New York Times, August 14,
2016, http://www.nytimes.com/2016/08/14/upshot/why-american-schools-are-even-more-unequal-than-we-thought.html?_r=0
In other words, the
poorest of the poor are
even further behind
academically than
students from families
closer to the middle
class periphery.
11. In 2015, approximately 40 percent of
Virginia’s 8th
grade students taking the
NAEP were identified as “economically
disadvantaged” based on FRL eligibility.
About 60 percent of them reached the
basic level in both reading and math
compared to almost 90 percent of their
wealthier, FRL- ineligible peers.
While neither the Michigan study nor our own data reveal anything about the neighborhoods
economically disadvantaged families live in, we may speculate that “persistently disadvantaged”
students from families with consistently very low incomes over many years are more likely to live
in neighborhoods of concentrated poverty and attend schools of low socioeconomic diversity.
Only 17 percent of them achieved proficiency in math and reading compared to an average
of 50 percent of ineligible students.5
Data on Virginia’s “persistently disadvantaged” students
comparable to that used in the Michigan study is not available, but Virginia’s substantial
achievement gap is likely also even more of a gulf for our own poorest of the poor.
9
5
Virginia Department of Education, Press Release, “Virginia Outscores Nation in Reading and Math”, Grade 8 Virginia
reading and math snapshots, http://www.doe.virginia.gov/news/news_releases/2015/10_oct28.shtml
FRL Eligible Students FRL Ineligible Students
Basic Level
Achieved
Proficiency
Achieved
Basic Level
Achieved
Proficiency
Achieved
60%
17%
90% 50%
12. The performance of schools serving
impoverished urban neighborhoods
validate the strong correlation between
areas of concentrated poverty and low
academic performance as represented
by Virginia’s Standards of Learning (SOL)
scores, graduation rates, and school
accredation status.
Virginia’s highest poverty schools rarely
make it above the state median for math
and English exams, have lower gradua-
tion rates, and are less likely to be fully
accredited than schools with greater
socioeconomic diversity.6
10
In 2014, 15.9 % of children
in Virginia were living in
poverty. This was a 7%
increase from 2013.
In 2014, 33 percent --
624,000 children -- came
from families burdened by
housing costs that
consumed more than 30
percent of their monthly
pre-tax income.
Poverty
(percentile rank)
90% or higher
11% to 89%
10% or below
% of elementary schools with
English SOL scores ABOVE
statewide median
High school graduation rates
ABOVE statewide median
Highest Poverty Schools Rarely Exceed State Median English SOL Test Scores
and Have Lower Graduation Rates (2012-13 School Year)
Source: JLARC staff analysis of data from Virginia Department of Education
6
Joint Legislative Audit and Review Commission, Report to the General Assembly and Governor of Virginia, “Low Performing Schools in
Urban High Poverty Communities”, 2014, http://jlarc.virginia.gov/pdfs/reports/Rpt454.pdf
13. Students from these low-opportunity neigh-
borhoods miss more days of school and are
more likely to change schools during a school
year than their more well-off peers,5
a symp-
tom of the household instability that itself is a
side effect of lack of quality, affordable hous-
ing in mixed-income neighborhoods.
Efforts to disrupt the trend of impoverished
children falling further behind as their families
become increasingly marginalized in low-
opportunity neighborhoods are beginning
to yield results that should not surprise us.
Low-income students attending socioeconom-
ically integrated schools within mixed-income
neighborhoods fare far better than their peers
in schools with a greater proportion of impov-
erished students within areas of concentrated
poverty.
Studies have found a well-defined link between student outcomes and their school’s socioeco-
nomic make-up, even when controlling for other factors, using more detailed socioeconomic
measures, or comparing students randomly assigned to schools.7
11
7
Halley Potter, “Boosting Achievement by Pursuing Diversity”, Educational Leadership, May 2013 Vol.70, Number 8, pgs. 38-43.
14. Reversing the Trend
We cannot achieve the goal of improving
educational opportunities and outcomes
with quick - but not necessarily lasting -
fixes that target schools while neglecting the
neighborhoods they mirror.
Nor will we foster vibrant, desirable neigh-
borhoods with ambitious redevelopment
initiatives that leave schools and education
decision-makers out of the planning.
Only by working together to invest
our time, creativity, and resources in
thoughtfully coordinated and comple-
mentary strategies that treat schools
and neighborhoods as the mutually
reinforcing system they are will we
fulfill the promise of public education
and strong, stable neighborhoods for
all Virginia’s children.
Many jurisdictions here and in other states have implemented their own initiatives and models
that aim to do just that, and we can learn from them.
12
15. The Role of the
Community Conversation
In 2014 Housing Virginia launched an
initiative to focus on the nexus of housing
and schools with two consecutive years of
symposia that brought together hundreds of
educators, housing and community develop-
ment professionals, and community leaders
to explore the crucial connection between
strengthening neighborhoods and improving
educational outcomes.
The next logical step was to bring the
discussion and problem-solving home
to the local level where most deci-
sions shaping schools and neighbor-
hoods are made in Virginia.
Virginia Delegate Betsy Carr (D-69th
District) speaks
with community leader and panelist Pastor Don Coleman
(Richmond City School Board Chair, 2015) at the 2015
Housing & Schools Symposium
Communities large and small use different conversation models to respond to challenges and
work through change without becoming hopelessly mired in conflict. The issues may be broad
or narrow, typical or unique.
In the case of adversity-plagued schools and neighborhoods in populous cities and suburbs, the
causes and consequences are nearly universal, but their uniquely historical, cultural, economic,
and political factors rule out a one size fits all approach even for jurisdictions within the same
region.
That’s why Housing Virginia wants to equip jurisdictions with the tools and resources to decide
for themselves how best to shape a dialogue that eliminates the artificial barrier between
education and community development and to engage in planning for better schools and
neighborhoods together.
13
16. What a Community Conversation is...
and What it isn’t
It is not a bull session, political debate, forum,
free-for-all, or a sales pitch for any agenda. It is a
structured and guided process designed to bring
together community leaders usually not found in
the same room, diffuse divisiveness, and inject
fresh thinking into long-standing problems.
In this case, it is not a meeting about schools or
one about community planning, but rather an
opportunity to knit those two together and re-
view possible solutions. These solutions are both
short term and long term, transformative and
incremental, easy to implement and challenging.
A menu of alternatives allows participants to find
the right mix for their community and the pace of
change that is realistic.
14
The goal of a community conversation is to find common ground, forge
partnerships, and recommend policy strategies based on shared aspirations,
best practices, and a commitment to innovation.
17. Housing Virginia recommends holding a series of community conversations, each building on
those before it, over the course of a year.
It may be helpful to plan according to a quarterly schedule of activities such as the simplified
chart below. You can expand on this and continually adjust in response to circumstances as they
arise.
ACTIVITIES 1ST
QUARTER 2ND
QUARTER 3RD
QUARTER 4TH
QUARTER
Organization/leadership
development
Data collection
Messaging/communication
Data analysis, findings
Introductory meetings
Review options/best
practices
Advanced meetings
Develop recommendations
15
GETTING STARTED
18. It’s impossible to overstate the importance of language
and communication style to the success of a community
conversation on this topic. Schools and neighborhood
development can be a highly emotional issue for par-
ents, teachers, and other community members. Strike the
wrong note in an invitation or opening presentation and
you risk losing the people you most need to reach.
Public relations professionals refer to this as
developing the right “frame” to present an ap-
proach to an issue, and its first step is to simply
consider the perspectives and perceptions of
others.
The message an audience receives depends as much on their individual beliefs, backgrounds,
and experiences as on the speaker’s intent and meaning. If you give careful consideration to the
language you use and the response it may provoke, you will be more likely to successfully deliver
a message with its intended meaning intact.
Decide early the story you want to tell and how to tell it. All your communication throughout
the process should be consistent with that story’s framework. Housing Virginia may be able to
provide support from public relations/communications professionals for this part of the process.
16
Some tips for message framing:
• Appeal to universal values
• Avoid insider jargon
• Steer clear of language with negative connotations
• Acknowledge challenges without any implication of fault
• Choose language that is inclusive, not alienating or potentially offensive
• Re-evaluate commonly used terms and consider alternatives
• Ask yourself: what is my intended meaning and does my way of expressing it convey
that meaning? Does it imply anything else?
What’s Your Story?
The importance of message framing and getting the
language right
19. The Tools You Need
NEIGHBORHOODS / HOUSING
• Distribution of assisted housing over-
laid with proximity to high opportunity
schools
• Changes in median home values
• % of households that are cost-burdened
• Indicators of housing quality
• % of households at or below federal
poverty line
• % of households with income below
$45,000
• Changes in areas of concentrated poverty
• Changes in rental/ownership patterns
SCHOOLS
• School demographics
• Absenteeism rates
• Suspension rates
Percentage of students...
• Receiving Free/Reduced Lunch for all
elementary schools
• Proficient/advanced proficient 3rd
grade
reading and math
• Enrolled in AP high school courses
• Taking SAT/ACT
• Graduating on time
SOLs: A blunt instrument we
can’t ignore
Virginia’s Standards of Learning and
standardized tests in general do not
have a big fan following. Most every-
one agrees that some form of test-
ing is an unavoidable component of
evaluating academic achievement but
that the tests themselves are flawed.
Efforts to reform testing and chang-
es in test administration inevitably
create challenges in comparing scores
over time.
Housing Virginia recognizes those
limitations and knows that SOL scores
are not a mirror held up to any child
or school. Yet they play a critical role:
parents with options consider SOL
scores and accredation status when
considering where to move or wheth-
er to enroll their child in a public
school, and SOL scores are a factor in
federal accountability that identifies
Priority, Focus, and Reward schools.8
We include SOL scores in our de-
mographic mapping, but we include
many other education-based mea-
sures to round out the picture.
Housing Virginia will provide its local community conversation partners with a demographic
picture of their jurisdiction - not just its current state, but how things are changing. Relevant
data and geographic mapping deliver compelling images that combine measures of educational
attainment and socioeconomic well-being.
Community conversation partners will receive a standard package of data and maps that
includes:
17
8
Virginia Department of Education, “Accountability and Virginia Schools”, http://www.doe.virginia.gov/statistics_reports/school_re-
port_card/accountability_guide.pdf
21. Organize, Recruit Leaders, and
Initiate Process
Begin as you mean to go on and don’t be in
a hurry to hold a community conversation
before you’re ready.
Take the time to determine your goals for a
community conversation and how best to
achieve them.
During PHASE ONE, you will:
1. Form a working group
2. Identify goals and core issues
3. Develop format for conversations
4. Recruit participants
5. Finalize schedule
6. Prepare for meetings
Who is at the Table?
Who is involved in the start of the conversation is a key strategic consideration. While the very
term “community conversation” may seem to imply the broadest participation, it is not to be
confused with a public forum.
You will want to structure your community
conversation to encourage focused attention
on your goal: gaining a better understanding of
how schools and neighborhoods mutually influ-
ence one another and developing community-
based strategies for nurturing both.
And you will want to make sure your partici-
pants include the most engaged leaders who
share this goal.
19
PHASE ONE
22. FORM YOUR STEERING COMMITTEE1.
Or “leadership team”, “planning committee”, “working group”, or something catchier. This is
a small, highly capable group of three to five people already motivated by a shared commit-
ment to address the interdependence of schools and neighborhoods.
The working group’s role is to plan and implement the community
conversation with support from others as needed.
• The group must be large enough to
avoid undue burden on one or two
individuals, yet nimble enough to make
decisions efficiently
• This is not the place to introduce a
person who may be confrontational or
divisive within the community or who
is running for elected office or planning
to do so - engagement with public officials is for later in the process
• Go beyond the “usual suspects” to bring new energy to the planning work
• Strive for broad representation from the business, nonprofit, faith, housing,
and education sectors
20
23. IDENTIFY GOALS AND CORE ISSUES,
FINE-TUNE YOUR MESSAGE
2.
In order to plan and conduct a community conversation that advances and articulates under-
standing of your community’s unique strengths and challenges, you will need to clarify and hone
what is up for discussion. You also will want to craft message guidelines to ensure consistency
throughout your community conversation process.
If this becomes a stumbling block, or your community is experiencing notable conflict around
these issues, Housing Virginia can recommend resources for assistance with message framing.
In addition:
• Review minutes or notes and reports from any
previous public meetings on education and
community revitalization. If the issue has been
subject to prior debate and activity, be sure you
thoroughly understand what has already hap-
pened before beginning a new process.
• Examine agendas from past planning commis-
sion and board of supervisors meetings for
relevant items and review minutes for public
comment, discussion, and decisions (in the case
of large or high profile projects, the information
likely will be familiar to working group mem-
bers)
• Consider the concerns and problems consis-
tently rising to the surface in the local media
and other venues
• Evaluate the evidence - formal and anecdotal - for dominant themes
• Identify broad, key issue areas to focus on. Some of these should be school-focused and
some neighborhood / housing-focused. The tendency will be for the group to default to a
traditional “schools” discussion, which you will want to balance with strong housing /
community development participation.
21
24. DEVELOP FORMAT FOR CONVERSATIONS3.
Housing Virginia envisions a series of conversations that
progress in scale while sharpening in focus. Beginning
with a small group having a broad dialogue, each conver-
sation expands the circle of participants and hones in on
specific solutions for their community.
There is no rigid, prescribed model to replicate because
communities need the flexibility to respond to external
events and unpredictable reactions to the conversation
process that may slow down or accelerate the pace or
warrant mid-course adjustments.
22
Basic format for each community conversation:
1. An introductory presentation to all participants that
buttresses school-neighborhood policy / planning alignment
and explains the community conversation framework
2. Small group discussion led by facilitators / conversation
leaders - allow participants to air concerns, ask questions,
and find common ground before moving on to evaluation of
possible strategies
3. Concluding summary and next steps with all participants
to inform the agenda for the next meeting
25. 4. IDENTIFY STAKEHOLDERS AND RECRUIT PARTICIPANTS
Be sure to reach beyond “the usual suspects” for an inclusive process that represents a true
cross-section of your community.
• Have members of the working group individually list key stakeholders and recommend
participants
• Together agree on key stakeholders and compile a list of participants to invite (and who is
the best person to make the invitation, which may be someone outside of the core working
group)
• Develop a script to consistently describe the community conversation and its value
• Invite people personally and follow up to confirm participation
• While you will want to include elected and appointed government bodies (i.e., Board of
Supervisors or City Council, Planning Commission) you will need to consider limitations on
their meetings and possibly identify one representative member with an alternate (such as
the chair)
23
Consider recruiting participants from:
*Chamber of Commerce, major employers
• Local planning staff
• Housing authorities
• Local businesses*
• Professional/
business associ-
ations
• Local funders
• Educator associations
• Mentoring groups
(Big Brothers/Sisters)
• PTAs, PTOs
• Child-centered non-
profits
• Health outreach
programs
• Social service
agencies
• Local health dept
• Pediatricians
• Civic groups / service
organizations
• Faith communities
• Ecumenical partners
• Cultural organizations
• Community centers
• Nonprofit housing providers
• Home Builders, Realtors®
26. CHOOSE LOCATION AND ARRANGE MEETINGS5.
Locations should be:
• Centrally located
• Widely perceived as part of the
community
• Low to no cost
• Accessible by public transportation to
a large group
• Served by ample parking
• Able to accommodate a presentation to
a large group
• Equipped with spaces that allow for
small group meetings without becoming
too noisy or distracting
The location of a community conversation is an influential factor on participation and effective-
ness. It needs to be accessible, welcoming, and comfortable (in every sense). Most essentially, it
should be a neutral space that is not associated with a specific stakeholder.
24
PREFERRED
Public libraries
Community centers
Places of worship
Recreation centers
Businesses
Other community institutions
NOT RECOMMENDED
Government buildings
Schools
Private clubs
Hotels & conference centers
27. 6. PREPARE FOR MEETING(S)
25
Organize materials (sign-in sheets, nametags, copies of handouts,
clipboards if space does not include tables, pens and pencils, flip
charts and markers, instructions for small group facilitators)
Develop presentation with resources from Housing Virginia
(See Phase Two)
Recruit your small group leaders. They do not have to be trained
facilitators, but some experience guiding group discussions is a
plus. Great listeners able to maintain objectivity and a schedule
are ideal.
Anticipate and arrange for all “housekeeping” details
Confirm participant RSVPs
Send meeting details and directions at least two weeks in ad-
vance with a follow-up two to three days prior to the scheduled
conversation
28. Frame the Issues and Launch the
Conversation
1. REGISTRATION
Decide small discussion group assignments in
advance based on confirmed participants.
As much as possible, balance groups with indi-
viduals representing different perspectives and
give consideration to individual personalities and
dynamics to the extent that your working group is
aware of them.
• To facilitate an efficient and timely start, have
more than one volunteer handle registration
• Make sure participants sign in and provide
contact information
• Provide participants with their small group
assignments and any materials they need for
small groups
• Make sure that small group meeting areas are
easy to find and conspicuously labeled
Assign tables ahead of time with numbered stickers on
participants’ name tags for quick and easy group assignments
26
PHASE TWO
29. Your presenter will also want to cover:
• An explanation of the purpose and process of the community conversation
• Ground rules for small group discussions
• Clear expectations of how information gathered will be shared and used
2. PLENARY PRESENTATION
The introductory presentation should be brief
and focus on the key elements of this new strat-
egy for linking school performance with neigh-
borhood / housing vitality.
One approach would be to have an educator
and a community development practitioner
share the presentation. This is a role(s) for your
working group’s most experienced and engaging
public speakers who can energize and inspire
participants. Carefully manage time devoted to
questions and stay on track.Both housing developers and members of the local School
Board speaking on a plenary panel discussion
Housing Virginia will provide a template for a standard presentation that will include:
• An overview of how schools and neighborhoods influence each other
• The educational benefits of mixed-income neighborhoods
• Up-to-date statistics on the economic and educational well-being of children in the
community
• Data and mapping specific to your jurisdiction that shows community and educational
status as well as trends
• Examples of promising or successful initiatives in other communities
27
30. 3. SMALL GROUP DISCUSSIONS
Here are some examples of guiding questions:
1. What are the top three reasons you live in this city/county?
2. What influenced your choice of neighborhood?
3. How would you describe your city/county to a newcomer?
4. Would you say your city/county is more or less stratified than 5 years ago, or about the same?
5. Do you feel that your neighborhood reflects the demographics of your city/county?
6. If you have school-aged children and any of them are in public schools, what are your reasons
for enrolling in our public schools?
7. If your children have never attended your public schools, what influenced that decision?
8. If you have a child that was enrolled in public school, but you have since chosen to home-
school or enroll in private school, what contributed to that decision?
1. Shared values
2. Community and school strengths
3. Obstacles and challenges
4. Community and school needs
5. Review and rank possible
strategies
We recommend you assign to each small group a conversation leader whose role is to steer the
discussion without participating in it. Small groups may include independent exercises, working
in pairs, and sharing information with the group.
How you structure this process and what tools you use will be up to you, but you will want to go
after this kind of information:
28
31. FIG. 1-A EXAMPLE POLICY MATRIX FOR EDUCATION
Your work group will develop a matrix of policy options to consider and discuss during the
community conversations. The options in the matrix will include both short- and long- term
strategies that are school- or neighborhood-focused and others that combine strategies. The
following is an example of such a matrix.
Please note that this is just one example of a set of policy matrices. Each community should
develop their own strategies that fit best within their local context. This is by no means an
exhaustive list of policies from which to choose. In fact, Housing Virginia encourages partici-
pants to research and include relevant policies beyond those listed here.
SHORT TERM EDUCATION LONG TERM EDUCATION
Develop and support new regional mag-
net schools and/or magnet schools within
divisions
Develop and support a system of regional
magnet schools
Develop and support voluntary diversity
and equity plans within demographically
changing school divisions
Develop and support voluntary regional diver-
sity and equity education plan
Pilot inter-district transfer program with
diversity and equity priorities
Develop and sustain inter-district transfer
program with diversity and equity priorities
Support school closure and zoning pro-
cesses that include diversity and equity as
guiding principles and priorities
Every Child Succeeds Act (ESSA) advocacy
- add diversity to accountability framework,
integration as a Title I intervention
29
32. FIG. 1-B EXAMPLE POLICY MATRIX FOR HOUSING
SHORT TERM HOUSING LONG TERM HOUSING
Additional vouchers for Moving to Oppor-
tunity in communities where concentra-
tions of poverty exist. Create strategies to
target high opportunity school attendance
zones by using measures such as HUD’s
Proficiency Index.
Expand housing mobility programs - target
families with young children and help them
move to higher opportunity schools. Add
schools as part of the metric.
Provide more counseling and support services
to high poverty families that move to commu-
nities of opportunity.
Provide state tax credits to private land-
lords in high performing school zones that
will accept housing vouchers.
Build a “good schools” preference into the
awards system for affordable housing pro-
grams such as the Low Income Housing Tax
Credit (LIHTC). Build stronger connections
between LIHTC and Affirmatively Furthering
Fair Housing (AFFH) strategies. State alloca-
tion plan (QAP) for tax credits should provide
a high priority for locating new family devel-
opment in school districts or zones that have
low poverty and good performance. General
presumption against awarding credits to
housing in high poverty areas unless there is
a broad-based plan for community improve-
ment and mixed income housing.
Provide “case management” support to
voucher families with children who are
seeking to relocate to high performing
school districts.
Implement Inclusionary Housing Policies in
suburban communities that encourage and fa-
cilitiate the production of affordable housing.
Examples are affordable dwelling unit (ADU)
ordinances, proactive zoning for affordable
housing, establishing affordability targets, etc.
Create a state level work group to follow
up on the joint letter from HUD, DOT and
DOE on policy coordination.
Strengthen state comp plan requirements
- especially with regard to the “affordable
housing” component.
Use AFFH HUD data to assess and track
progress in jurisdictions meeting goals to
deconcentrate poverty / create affordable
housing in low poverty communities. Create
a scorecard / rating by locality.
30
33. FIG. 1-C EXAMPLE POLICY MATRIX FOR JOINT POLICIES
SHORT TERM EDUCATION AND HOUSING LONG TERM EDUCATION AND HOUSING
Pilot collaborative structures for school
and housing officials to work together (e.g.,
creation of executive offices/departments,
task forces or commissions, appoint local
housing official to sit on school boards and
vice versa, regional planning commissions,
quarterly exchanges). Implement at both
local and regional levels.
Create a new governing agency or position
responsible for helping to bridge school-hous-
ing worlds. Bring resources and expertise
together. Help communities be proactive and
engage in processes related to new schools/
development and zoning/housing develop-
ment earlier. Such efforts should be at both
the local and regional scale.
Set regional and local goals for diversity in
schools and housing.
Build plans for HUD’s Affirmatively Furthering
Fair Housing (AFFH) requirement that ties
new housing opportunity and quality schools
together.
State and local school organizations should
consider housing patterns in their decisions
about school construction and location of
new schools. Housing entities at state and
local levels should be thinking intentionally
about where schools are located and what
kinds of schools they are when making
housing program decisions.
Target housing and community development
resources to the revitalization of communities
surrounding low performing schools - attract
middle income families back to these neigh-
borhoods.
Discussion of school boundary lines should
take into account residential patterns of
race and poverty.
Develop and implement best practices for co-
ordination and joint planning between hous-
ing authorities and schools in the redevelop-
ment of older public housing communities.
Create a subcabinet work group in Virginia
for the Secretary of Commerce and Trade
and the Secretary of Education - including
DHCD, VHDA and DOE (expand Children’s
Cabinet Working Group) to develop state
strategies.
Target some state housing resources to the
redevelopment of older public housing and
other existing affordable housing when com-
bined with school improvement strategies.
Create a new state housing tax credit that
is tied to schools (i.e., affordable housing in
communities of opportunity and market rate
housing in revitalization areas)
31
34. 4. CLOSING
• Have each small group leader briefly
summarize their discussion
• Explain clearly your next steps and
what participants can expect according
to your timeline
• Welcome any follow-up questions or
comments and make sure to provide
your preferred contact name and meth-
od
• Thank your participants and acknowl-
edge their investment of time and
energy and their commitment to your
community
• Within a few days follow up with an
e-mail to all participants and ask for
feedback which you may use to fine-
tune remaining conversations
Bring discussion groups back together for the conclusion to your conversation.
32
35. Widen the Circle and Share
Recommendations
Now is the time for broad public
engagement. Hold meetings that
are open to the public and/or ar-
range for agenda time at PTA and
neighborhood/civic association
meetings. Use these occasions to
make your case.
After each community conver-
sation, take the time to organize
and store all original materials.
Being used to telling the story of
your process will be important.
Synthesizing the results of your conversations into a
bundle of recommendations has two parts: building
community support and delivering to local decision-
makers. Skipping or skimping on the first step will limit
or even eliminate the effectiveness of the second step.
Without the favor of citizens who will be most directly
impacted - parents and neighbors - your proposals will
lack credibility.
Putting the results of your community conversation into
the hands and before the eyes of local decision-makers
moves your process into the arena of action. How you
present your recommendations and in what form will
influence the attention they receive and the role your
steering committee and the new movement for schools
and neighborhoods takes in your locality.
Suggestions for preparing recommendations:
1. Do not use a single lengthy, text-heavy report
2. Consider multiple formats (i.e., one-page summary, slide
set, full report)
3. Make the evaluation of strategies the centerpiece of
your results
4. Emphasize those policy best practices that have support
from all areas of your jurisdiction, but do not omit any
apparent neighborhood-specific preferences
5. Synthesize and condense themes as accurately and
succinctly as possible. Do not leave summarizing of
concerns or comments to just one member of your com-
mittee, and have others review any summaries. Consider
including all verbatim comments in an appendix or not-
ing that they are available.
33
PHASE THREE
36. Strategic Considerations:
1. Be sure to follow up each community conver-
sation with communication to participants.
Keep them updated on your progress and
share your recommendations with all par-
ticipants at the same time you release them
formally.
2. Decide the best approach to take with elected
officials. If you decide to present your recom-
mendations to your Planning Commission,
Board of Supervisors, and School Board as an agenda item at a work session or a regular
meeting, you will need to arrange for this in advance.
3. Consider what other key groups are appropriate for a formal presentation, such as your local
Chamber of Commerce and Realtors® Association.
Preparing for media attention and expanded
communications
Your steering committee should consider the following:
1. When is the right time to publicly announce results and
recommendations?
2. Who is the best spokesperson to consistently serve as
your public representative and contact?
3. What traditional media outlets (local, regional) will you
target?
4. Will you employ social media?
5. What are your key messages and supporting evidence?
6. How will you respond - or not respond - to criticism or
attacks?
As a part of this process you will need to create and distribute talking points that summarize your
core message.
34
37. What Comes Next:
Sustaining the Housing-Schools Connection
A community conversation is not an end in itself; if it is successful, it is just the beginning as inertia
turns to momentum. To plan for progress:
The ultimate goal is to enact changes in policies for both educa-
tion and community development. Every process will lead to a
different strategy.
But the key is to sustain forward momentum - whether incre-
mental opportunities to seize low-hanging fruit or transforma-
tional change - and to always develop a clear set of next steps
and a time frame for action.
35
PHASE FOUR
Listen to all responses of your
findings and be sure you
understand them clearly.
Don’t dismiss doubts or
differing opinions, welcome critics
to the ongoing conversation
Perservere and take action
on what is achievable in
the short-term
Develop a game plan for mid-
term and long-term objectives
Continue to meet regularly as
a steering committee
Nurture new stakeholder
relationships
Respond as a steering commit-
tee to community issues and
proposals as they arise
38. Affirmatively Furthering Fair Housing (AFFH) Rule
The AFFH Final Rule includes a requirement for certain HUD grantees (Public Housing Author-
ities and Community Development Block Grant Consolidated Planning agencies) to conduct an
Assessment of Fair Housing (AFH) planning process. The AFH planning process will help com-
munities analyze challenges to fair housing choice and establish their own goals and priorities to
address the fair housing barriers in their community.
Affordable Housing
In general, housing for which the occupant(s) is/are paying no more than 30 percent of his or her
gross income for housing costs, including utilities.
Children’s Cabinet of Virginia
Established in 2014 by Governor McAuliffe, the Children’s Cabinet aims to eradicate the
achievement gap in schools in high poverty communities, improve early childhood care and edu-
cation, increase access to basic needs (housing, healthcare, proper nutrition), improve outcomes
for youth transitioning into and out of Virginia’s juvenile justice, mental health, and foster care
systems, and increase workforce opportunities for parents.
Every Child Succeeds Act (ESSA)
This 2015 bipartisan measure reauthorized the 50-year-old Elementary and Secondary Educa-
tion Act (ESEA), the national education law and longstanding commitment to equal opportuni-
ty for all students. The previous version of the law, the No Child Left Behind (NCLB) Act, was
enacted in 2002.
Extremely Low-Income Household
Households with incomes below 30 percent of the area median income.
Federal Poverty Level (FPL)
A measure of income issued every year by the Department of Health and Human Services. Fed-
eral poverty levels are used to determine eligibility for certain programs and benefits. In 2016,
the FPL for a family of 4 is $24,300.
Focus School
A Focus School is a Title I school that has room for improvement in areas that are specific to the
school, in terms of either very low graduation rates or very wide in-school or statewide profi-
ciency gaps.
Free and Reduced Lunch (FRL)
A student from a household with an income at or below 130 percent of the poverty income
threshold is eligible for free lunch. A student from a household with an income between 130
percent and up to 185 percent of the poverty threshold is eligible for reduced price lunch under
the National School Lunch Program (NSLP).
36
GLOSSARY
39. 37
High-Opportunity Neighborhoods
Neighborhoods with variables indicative of high opportunity, such as the availability of sustain-
able employment, high-performing schools, a safe environment, and safe neighborhoods.
Low-Income Household
Households whose combined income does not exceed 80 percent of the median family income
for the area.
Low-Opportunity Neighborhoods
Neighborhoods with variables indicative of impediments to opportunity, such as high neighbor-
hood poverty, poorly performing schools, high crime rates, and high unemployment rates.
Mixed-Income Development
A type of development that includes families at various income levels. Mixed- income develop-
ments are intended to promote de-concentration of poverty and give lower- income households
access to improved amenities.
Moving to Opportunity (for Fair Housing) Program
MTO is a 10-year HUD research demonstration that combines tenant-based rental assistance
with housing counseling to help very low-income families move from poverty-stricken urban
areas to low-poverty neighborhoods.
National Assessment of Educational Progress (NAEP)
The largest nationally representative and continuing assessment in mathematics, reading,
science, writing, the arts, civics, economics, geography, U.S. history, and in Technology and
Engineering Literacy (TEL).
National School Lunch Program (NSLP)
The National School Lunch Program is a federally assisted meal program operating in public and
nonprofit private schools and residential child care institutions.
Priority School
A Priority school is a school that has been identified as among the lowest-performing five
percent of Title I schools in the state over a number of years, or any non-Title I school that would
otherwise have met the same criteria.
Reward School
A Reward School is a school with outstanding student achievement or growth over a number of
years in terms of performance or progress over a number of years.
School Proficiency Index
The HUD School Proficiency Index uses school-level data on the performance of fourth grade
students on state exams to describe which neighborhoods have high-performing elementary
schools and which are near lower performing elementary schools.
Very Low-Income Household
Households whose incomes do not exceed 50 percent of the median area income for the area.