Key data and statistics on the TV and digital media industry in Canada
•
1 like•181 views

This document is a dashboard report analyzing trends in digital media in Canada from 2012-2016. It summarizes data on: - Increasing penetration rates of smartphones, tablets, and connected TVs over time. - A shift in television consumption from traditional broadcast TV to online viewing on various devices like tablets and smartphones. - Growth in the number of subscribers and revenues for internet service providers and broadcasting distributors. - The relative sizes of key screen-based industries like television, film, games and their contributions to the Canadian economy. - Rising adoption of online streaming services like Netflix and a shift of advertising dollars from traditional TV to digital platforms like the internet.

Recommended
More Related Content
Similar to Key data and statistics on the TV and digital media industry in Canada
Similar to Key data and statistics on the TV and digital media industry in Canada (20)
Recently uploaded
Recently uploaded (20)
Key data and statistics on the TV and digital media industry in Canada
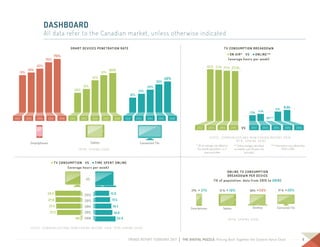
- 1. 4TRENDS REPORT FEBRUARY 2017 | THE DIGITAL PUZZLE: Piecing Back Together the Content Value Chain DASHBOARD All data refer to the Canadian market, unless otherwise indicated (MTM, Spring 2016) SMART DEVICES PENETRATION RATE Tablets Connected TVsSmartphones 56% 62% 51% 70% 75% 2013 20142012 2015 2016 31% 42% 26% 51% 54% 2013 20142012 2015 2016 21% 28% 18% 36% 40% 2013 20142012 2015 2016 (MTM, Spring 2016) SMART DEVICES PENETRATION RATE Tablets Connected TVsSmartphones 56% 62% 51% 70% 75% 2013 20142012 2015 2016 31% 42% 26% 51% 54% 2013 20142012 2015 2016 21% 28% 18% 36% 40% 2013 20142012 2015 2016 (MTM, Spring 2016) SMART DEVICES PENETRATION RATE Tablets Connected TVsSmartphones 56% 62% 51% 70% 75% 2013 20142012 2015 2016 31% 42% 26% 51% 54% 2013 20142012 2015 2016 21% 28% 18% 36% 40% 2013 20142012 2015 2016 SMART DEVICES PENETRATION RATE ( M T M , S P R I N G 2 0 1 6 ) 6.1h 6.6h 3.9h 4.5h ND*** 2012 (CRTC, Communications Monitoring Report 2016; MTM Spring 2016) TV CONSUMPTION BREAKDOWN: (average hours per week) ON AIR* VS ONLINE** 27.2h28.2h 27.9h 27.4h 2013 20142012 2015 2013 2014 20152012 2016 VS * On air average calculated on the overall populations, i.e. 2 years and older ** Online average calculated on weekly users 18 years old and older *** Information not collected by MTM in 2014 TV CONSUMPTION BREAKDOWN •ON AIR* VS •ONLINE** (average hours per week) ( C R T C , C O M M U N I C AT I O N S M O N I T O R I N G R E P O R T 2 0 1 6 ; M T M , S P R I N G 2 0 1 6 ) * On air average calculated on the overall populations, i.e. 2 years and older ** Online average calculated on weekly users 18 years old and older *** Information not collected by MTM in 2014 VS ONLINE TV CONSUMPTION BREAKDOWN PER DEVICE (% of population, data from 2015 to 2016) ( M T M , S P R I N G 2 0 1 6 ) (MTM, Spring 2016) ONLINE TV CONSUMPTION BREAKDOWN PER DEVICE Tablets Connected TVsDesktop Smartphones 30% 29%→ 17% 21%→ → →17 % 20% 17 % 19% (% of population, data from 2014 to 2015) (MTM, Spring 2016) ONLINE TV CONSUMPTION BREAKDOWN PER DEVICE Tablets Connected TVsDesktop Smartphones 30% 29%→ 17% 21%→ → →17 % 20% 17 % 19% (% of population, data from 2014 to 2015) ( C R T C , C O M M U N I C AT I O N S M O N I T O R I N G R E P O R T 2 0 1 6 ; M T M , S P R I N G 2 0 1 6 ) •TV CONSUMPTION VS •TIME SPENT ONLINE (average hours per week) (CRTC, Communications Monitoring Report 2016; MTM Spring 2016) TV CONSUMPTION VS TIME SPENT ONLINE (average hours per week) 2016 2012 2013 2014 2015 22.8 15.8 17.5 18.4 19.627.2 28.2 27.9 27.4 ND wwwVS 6.1h 6.6h 3.9h 4.5h ND*** 2012 (CRTC, Communications Monitoring Report 2016; MTM Spring 2016) TV CONSUMPTION BREAKDOWN: (average hours per week) ON AIR* VS ONLINE** 27.2h28.2h 27.9h 27.4h 2013 20142012 2015 2013 2014 20152012 2016 VS * On air average calculated on the overall populations, i.e. 2 years and older ** Online average calculated on weekly users 18 years old and older *** Information not collected by MTM in 2014
- 2. 5TRENDS REPORT FEBRUARY 2017 | THE DIGITAL PUZZLE: Piecing Back Together the Content Value Chain DASHBOARD (continued) All data refer to the Canadian market, unless otherwise indicated BROADCASTING DISTRIBUTION UNDERTAKINGS •Subscribers (thousands) • Revenues ($M) SIZE OF PRINCIPAL SCREEN-BASED ECONOMIES INTERNET SERVICE PROVIDERS •Subscribers (thousands) • Revenues ($M) ( C R T C , C O M M U N I C AT I O N S M O N I T O R I N G R E P O R T 2 0 1 6 ) In its most recent report, the CRTC reviewed its numbers from 2011 to 2014. This chart reflects the new data. ( C R T C , C O M M U N I C AT I O N S M O N I T O R I N G R E P O R T 2 0 1 6 ) ( C M P A , P R O F I L E 2 0 1 5 ; C R T C , C O M M U N I C AT I O N S M O N I T O R I N G R E P O R T 2 0 1 6 ; E S A C A N A D A , E S S E N T I A L FA C T S A B O U T T H E C A N A D I A N V I D E O G A M E I N D U S T R Y, 2 0 1 6 ) (CRTC, Communications Monitoring Report 2016) Subscribers (thousands) Revenues ($ millions) $8 561 $8 794 $8 930 $8 918 $8 459 2012 2013 2014 20152011 2012 2013 2014 20152011 $7 196 $7 725$6 791 $9 249 $8 414 BROADCASTING DISTRIBUTION UNDERTAKINGS Subscribers (thousands) Revenues ($ millions) (CRTC, Communications Monitoring Report 2016) In its most recent report, the CRTC reviewed its numbers from 2011 to 2014. This chart reflects the new data. INTERNET SERVICE PROVIDERS 11 517 11 405 11 529 11 397 11 247 11 630 12 019 11 25110 99110 671 (CRTC, Communications Monitoring Report 2016) Subscribers (thousands) Revenues ($ millions) $8 561 $8 794 $8 930 $8 918 $8 459 2012 2013 2014 20152011 2012 2013 2014 20152011 $7 196 $7 725$6 791 $9 249 $8 414 BROADCASTING DISTRIBUTION UNDERTAKINGS Subscribers (thousands) Revenues ($ millions) (CRTC, Communications Monitoring Report 2016) In its most recent report, the CRTC reviewed its numbers from 2011 to 2014. This chart reflects the new data. INTERNET SERVICE PROVIDERS 11 517 11 405 11 529 11 397 11 247 11 630 12 019 11 25110 99110 671 SIZE OF PRINCIPAL SCREEN-BASED ECONOMIES TV Production $2.6B TV Broadcast $17.9B (CMPA, Profile 2015 ; CRTC, Communications Monitoring Report 2016 ; ESA Canada, Essential Facts About the Canadian Video Game Industry 2016) Games $3.0B Cinema $349M
- 3. 6TRENDS REPORT FEBRUARY 2017 | THE DIGITAL PUZZLE: Piecing Back Together the Content Value Chain 6TRENDS REPORT FEBRUARY 2017 | THE DIGITAL PUZZLE: Piecing Back Together the Content Value Chain DASHBOARD (continued) All data refer to the Canadian market, unless otherwise indicated (MTM, Spring 2016) NETFLIX SUBSCRIBERS 47% 39% 41% 33% 19% 12% 44% 38% 16% National average Anglophones Francophones 32% 28% 9% 48% 42% 20% Spring 2016Fall 2016Spring 2014 Spring 2015Fall 2014 ADVERTISING SPENDING $4 604 $3 220$3 387 $3 387 $3 241 $3 467 $901 $1 243 $1 609 $1 845 $2 279 $2 674 $3 085 $3 525 $3 793 $3 600 $M $3 000 $2 400 $1 800 $1 200 0 2014 20152006 2007 2008 2009 2010 2011 2012 2013 $600 InternetTV vs (IAB Canada, Canadian Internet Advertising Revenue Survey 2015-2016) $4 800 $4 200 ADVERTISING SPENDING • TV vs • Internet NETFLIX SUBSCRIBERS • National average • Anglophones • Francophones ( I A B C A N A D A , C A N A D I A N I N T E R N E T A D V E R T I S I N G R E V E N U E S U R V E Y 2 0 1 5 - 2 0 1 6 ) ( M T M , S P R I N G 2 0 1 6 )