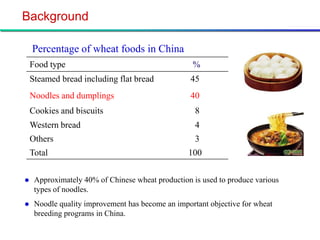
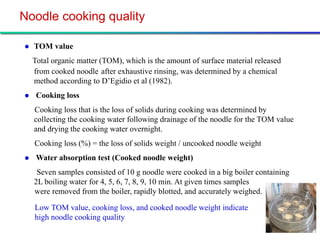
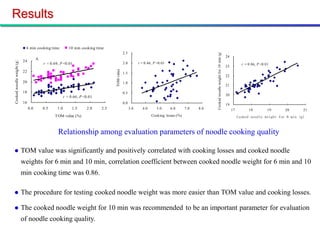
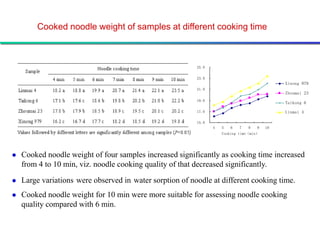
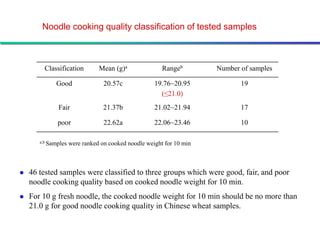
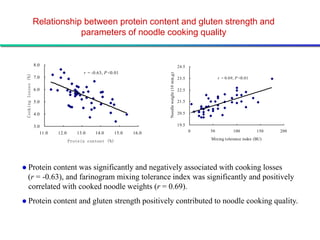
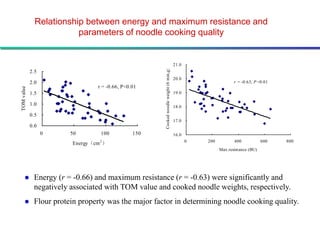
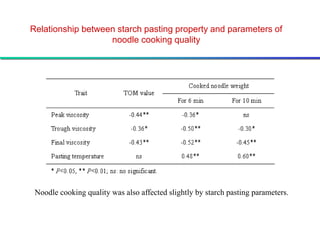
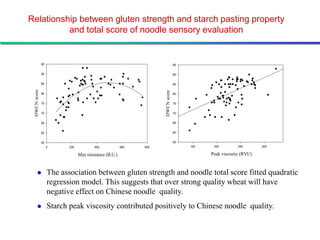
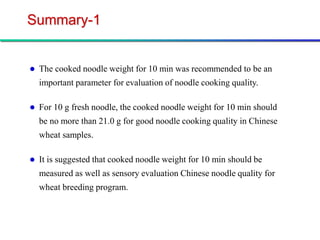
Cooking Quality of Chinese Fresh Noodle


          Yan Zhang, Zhonghu He
       Institute of Crop Science, CAAS
Outline

   Background
   Materials and Methods
   Results
       Evaluation parameters for cooking quality of Chinese fresh noodle

       Traits associated with cooking quality of Chinese fresh noodle

   Summary
Background

    Percentage of wheat foods in China
    Food type                                      %
    Steamed bread including flat bread             45
    Noodles and dumplings                          40
    Cookies and biscuits                            8
    Western bread                                   4
    Others                                          3
    Total                                         100


    Approximately 40% of Chinese wheat production is used to produce various
     types of noodles.
    Noodle quality improvement has become an important objective for wheat
     breeding programs in China.
Percentage of various noodles consumed in China


Type                                             %
Fresh noodle (home made)                         33
Dry noodle (machine made)                        24
Instant noodle (machine made)                    21
Fresh noodle (machine made available at store)   13
Extended alkaline noodle (La Mian)               5
Extended noodle (Helu)                           2
Frozen noodle and others                         2
Total                                            100
Sensory evaluation parameters and quality performance of
Chinese fresh noodle
            Parameter          Full score   Criterion
            Color              15           Bright and creamy
            Appearance         10           flat and speckless surface
            Firmness           20           medium firmness

            Viscoelasticity    30           Elastic, cohesive, and no stick
                                            to teeth when chewed
            Smoothness         15           Smooth when eaten
            Taste              10           aromatic taste
            Total              100

    Good Chinese fresh noodle quality is characterized with bright creamy color, flat
     and speckless surface, and good eating quality such as medium firmness, elastic
     and cohesive, smooth, and aromatic taste.
    The texture and eating quality together with color are important parameters for
     Chinese noodle quality.
Consumer demand

   Chinese noodles are typically served in hot soup in China.
    Most consumers prefer noodles that retain a degree of
    firmness and elasticity in the soup.
   It is common for poor quality noodles to become soft and
    “mushy” quickly when served in hot soup and overcooking.
    The time gap between cooking and consumption of the
    noodle obviously affects noodle eating quality.
   The requirement for resistance to softening of noodle in hot
    soup and retaining noodle firmness after overcooking is also
    high in China.
   Noodle cooking quality improvement is an important
    objective for improving the overall noodle quality in
    Chinese wheat cultivars.
Progress in noodle cooking quality

   Some foreign studies have focused on assessing the relationships between different
    technological and chemical variables and pasta cooking quality. Pasta cooking
    quality can be expressed in terms of stickiness, firmness, overcooking tolerance,
    water absorption, cooking loss, and TOM value.

   Chinese reports indicate that protein property and starch content are significantly
    correlated with evaluation parameters for noodle cooking quality such as TOM value,
    cooking loss, and water absorption. But it is still not clear which parameter is more
    suitable for evaluation noodle cooking quality in Chinese wheat breeding programs.

   The aim of this study were to understand the relationship between flour
    compositional characteristics and noodle cooking quality and to determine
    evaluation parameter for noodle cooking quality in Chinese wheat breeding
    programs.
Materials

        Origin              Number
        Beijing             8
        Hebei               4
        Shandong            20
        Henan               12
        Shannxi             2
        Total               46


   46 Chinese winter cultivars and advanced lines were used in this study.

   Harvested grain samples were free of sprouting damage.
Testing methods

   Grain quality
     Hardness
     Protein content
     60% flour yield


   Flour quality
     Ash content               〔
     Farinograph parameters    AACC method
     Extensograph parameters
     RVA parameters
Noodle preparation


       Mix       →→         Sheet   →→   Rest   →→   Re-sheet


    Adjusting →→ Re-sheet and cut →→ Cooking    →→   Evaluation

Zhang, et al., Euphytica, 2005
Noodle cooking quality

   TOM value
    Total organic matter (TOM), which is the amount of surface material released
    from cooked noodle after exhaustive rinsing, was determined by a chemical
    method according to D’Egidio et al (1982).
    Cooking loss
    Cooking loss that is the loss of solids during cooking was determined by
    collecting the cooking water following drainage of the noodle for the TOM value
    and drying the cooking water overnight.
    Cooking loss (%) = the loss of solids weight / uncooked noodle weight
    Water absorption test (Cooked noodle weight)
     Seven samples consisted of 10 g noodle were cooked in a big boiler containing
    2L boiling water for 4, 5, 6, 7, 8, 9, 10 min. At given times samples
    were removed from the boiler, rapidly blotted, and accurately weighed.

    Low TOM value, cooking loss, and cooked noodle weight indicate
    high noodle cooking quality
Results

                            6 min cooking time             10 min cooking time
                                                                                              2.5


                                                                                                                                                   Cooked noodle weight for 10 min (g)
                                                                                                                                                                                         24
                                      A
                           24
Cooked noodle weight (g)


                                          r = 0.69, P <0.01                                   2.0         r = 0.46, P <0.01                                                                          r = 0.86, P <0.01
                                                                                                                                                                                         23


                                                                                  TOM value
                           22                                                                 1.5
                                                                                                                                                                                         22
                           20                                                                 1.0
                                                                                                                                                                                         21
                           18                                                                 0.5
                                                                                                                                                                                         20
                                                        r = 0.66, P <0.01
                           16                                                                 0.0                                                                                        19
                                0.0       0.5     1.0        1.5     2.0    2.5                     3.0     4.0      5.0      6.0      7.0   8.0                                              17         18          19    20       21
                                                T OM value (%)                                                    Cooking losses (%)                                                               Cooked noodle weight for 6 min (g)


                                                  Relationship among evaluation parameters of noodle cooking quality

                          TOM value was significantly and positively correlated with cooking losses and cooked noodle
                           weights for 6 min and 10 min, correlation coefficient between cooked noodle weight for 6 min and 10
                           min cooking time was 0.86.

                          The procedure for testing cooked noodle weight was more easier than TOM value and cooking losses.

                          The cooked noodle weight for 10 min was recommended to be an important parameter for evaluation
                           of noodle cooking quality.
Cooked noodle weight of samples at different cooking time


                                                                                   25.0


                                                        cooked noodle weight (g)
                                                                                   23.0
                                                                                                                       Xinong 979
                                                                                   21.0
                                                                                                                       Zhoumai 23
                                                                                   19.0
                                                                                                                       Taikong 6
                                                                                   17.0                                Linmai 4

                                                                                   15.0
                                                                                          4   5   6   7   8   9   10
                                                                                              Cooking time(min)


   Cooked noodle weight of four samples increased significantly as cooking time increased
    from 4 to 10 min, viz. noodle cooking quality of that decreased significantly.

   Large variations were observed in water sorption of noodle at different cooking time.
   Cooked noodle weight for 10 min were more suitable for assessing noodle cooking
    quality compared with 6 min.
Noodle cooking quality classification of tested samples


         Classification         Mean (g)a               Rangeb        Number of samples

             Good                 20.57c             19.76~20.95             19
                                                       (≤21.0)
              Fair                21.37b             21.02~21.94             17

              poor                22.62a             22.06~23.46             10

       a,b Samples   were ranked on cooked noodle weight for 10 min


   46 tested samples were classified to three groups which were good, fair, and poor
    noodle cooking quality based on cooked noodle weight for 10 min.
   For 10 g fresh noodle, the cooked noodle weight for 10 min should be no more than
    21.0 g for good noodle cooking quality in Chinese wheat samples.
Relationship between protein content and gluten strength and
                                  parameters of noodle cooking quality


                      8.0                                                                              24.5
                                              r = -0.63, P <0.01


                                                                            Noodle weight (10 min,g)
 Cooking losses (%)


                      7.0                                                                              23.5            r = 0.69, P <0.01

                      6.0                                                                              22.5

                      5.0                                                                              21.5


                      4.0                                                                              20.5


                      3.0                                                                              19.5
                         11.0    12.0      13.0    14.0       15.0   16.0                                     0   50           100         150   200
                                                                                                                  Mixing tolerance index (BU)
                                        Protein content (%)


 Protein       content was significantly and negatively associated with cooking losses
       (r = -0.63), and farinogram mixing tolerance index was significantly and positively
       correlated with cooked noodle weights (r = 0.69).
 Protein                       content and gluten strength positively contributed to noodle cooking quality.
Relationship between energy and maximum resistance and
                         parameters of noodle cooking quality


                                                                                       21.0


                                                      Cooked noodle weight (6 min,g)
            2.5
                                                                                       20.0
            2.0                                                                                                r = -0.63, P <0.01
                                 r = -0.66, P<0.01
TOM value


            1.5                                                                        19.0

            1.0                                                                        18.0
            0.5
                                                                                       17.0
            0.0
                  0     50        100           150                                    16.0
                                                                                              0   200          400            600   800
                        Energy(cm 2 )
                                                                                                        Max.resistance (BU)


            Energy (r = -0.66) and maximum resistance (r = -0.63) were significantly and
             negatively associated with TOM value and cooked noodle weights, respectively.
            Flour protein property was the major factor in determining noodle cooking quality.
Relationship between starch pasting property and parameters of
                   noodle cooking quality


 Noodle cooking quality was also affected slightly by starch pasting parameters.
Relationship between gluten strength and starch pasting property
          and total score of noodle sensory evaluation


              95                                                                 95

              90                                                                 90

              85                                                                 85
 DWCN score


                                                                    DWCN score
              80                                                                 80


              75                                                                 75


              70                                                                 70


              65                                                                 65


              60                                                                 60


              55                                                                 55
                   0      200           400             600   800                     150    200         250       300

                                Max resistance (B.U.)                                       Peak viscosity (RVU)


                  The association between gluten strength and noodle total score fitted quadratic
                   regression model. This suggests that over strong quality wheat will have
                   negative effect on Chinese noodle quality.
                  Starch peak viscosity contributed positively to Chinese noodle quality.
Summary-1


   The cooked noodle weight for 10 min was recommended to be an
    important parameter for evaluation of noodle cooking quality.

   For 10 g fresh noodle, the cooked noodle weight for 10 min should
    be no more than 21.0 g for good noodle cooking quality in Chinese
    wheat samples.

   It is suggested that cooked noodle weight for 10 min should be
    measured as well as sensory evaluation Chinese noodle quality for
    wheat breeding program.
Summary-2


   Flour protein property was the major factor in determining noodle
    cooking quality.

   Noodle cooking quality was also affected slightly by starch pasting
    parameters.

   Flour with medium protein content, medium to strong gluten
    strength, and starch high peak viscosity are desirable for Chinese
    noodle quality.
Acknowledgement


   Prof. Jun Yan , Dr. Yonggui Xiao, and
    Mr. Desen Wang , providing wheat samples

   Funding from the national natural science
    foundation of China (31171547) and an
    international collaboration project on wheat
    improvement from Chinese Ministry of
    Agriculture (2011-G3)
Thank you for your attention


          谢谢!

Cooking Quality of Chinese Fresh Noodle

  • 1.
    Cooking Quality ofChinese Fresh Noodle Yan Zhang, Zhonghu He Institute of Crop Science, CAAS
  • 2.
    Outline  Background  Materials and Methods  Results  Evaluation parameters for cooking quality of Chinese fresh noodle  Traits associated with cooking quality of Chinese fresh noodle  Summary
  • 3.
    Background Percentage of wheat foods in China Food type % Steamed bread including flat bread 45 Noodles and dumplings 40 Cookies and biscuits 8 Western bread 4 Others 3 Total 100  Approximately 40% of Chinese wheat production is used to produce various types of noodles.  Noodle quality improvement has become an important objective for wheat breeding programs in China.
  • 4.
    Percentage of variousnoodles consumed in China Type % Fresh noodle (home made) 33 Dry noodle (machine made) 24 Instant noodle (machine made) 21 Fresh noodle (machine made available at store) 13 Extended alkaline noodle (La Mian) 5 Extended noodle (Helu) 2 Frozen noodle and others 2 Total 100
  • 5.
    Sensory evaluation parametersand quality performance of Chinese fresh noodle Parameter Full score Criterion Color 15 Bright and creamy Appearance 10 flat and speckless surface Firmness 20 medium firmness Viscoelasticity 30 Elastic, cohesive, and no stick to teeth when chewed Smoothness 15 Smooth when eaten Taste 10 aromatic taste Total 100  Good Chinese fresh noodle quality is characterized with bright creamy color, flat and speckless surface, and good eating quality such as medium firmness, elastic and cohesive, smooth, and aromatic taste.  The texture and eating quality together with color are important parameters for Chinese noodle quality.
  • 6.
    Consumer demand  Chinese noodles are typically served in hot soup in China. Most consumers prefer noodles that retain a degree of firmness and elasticity in the soup.  It is common for poor quality noodles to become soft and “mushy” quickly when served in hot soup and overcooking. The time gap between cooking and consumption of the noodle obviously affects noodle eating quality.  The requirement for resistance to softening of noodle in hot soup and retaining noodle firmness after overcooking is also high in China.  Noodle cooking quality improvement is an important objective for improving the overall noodle quality in Chinese wheat cultivars.
  • 7.
    Progress in noodlecooking quality  Some foreign studies have focused on assessing the relationships between different technological and chemical variables and pasta cooking quality. Pasta cooking quality can be expressed in terms of stickiness, firmness, overcooking tolerance, water absorption, cooking loss, and TOM value.  Chinese reports indicate that protein property and starch content are significantly correlated with evaluation parameters for noodle cooking quality such as TOM value, cooking loss, and water absorption. But it is still not clear which parameter is more suitable for evaluation noodle cooking quality in Chinese wheat breeding programs.  The aim of this study were to understand the relationship between flour compositional characteristics and noodle cooking quality and to determine evaluation parameter for noodle cooking quality in Chinese wheat breeding programs.
  • 8.
    Materials Origin Number Beijing 8 Hebei 4 Shandong 20 Henan 12 Shannxi 2 Total 46  46 Chinese winter cultivars and advanced lines were used in this study.  Harvested grain samples were free of sprouting damage.
  • 9.
    Testing methods  Grain quality Hardness Protein content 60% flour yield  Flour quality Ash content 〔 Farinograph parameters AACC method Extensograph parameters RVA parameters
  • 10.
    Noodle preparation Mix →→ Sheet →→ Rest →→ Re-sheet Adjusting →→ Re-sheet and cut →→ Cooking →→ Evaluation Zhang, et al., Euphytica, 2005
  • 11.
    Noodle cooking quality  TOM value Total organic matter (TOM), which is the amount of surface material released from cooked noodle after exhaustive rinsing, was determined by a chemical method according to D’Egidio et al (1982).  Cooking loss Cooking loss that is the loss of solids during cooking was determined by collecting the cooking water following drainage of the noodle for the TOM value and drying the cooking water overnight. Cooking loss (%) = the loss of solids weight / uncooked noodle weight  Water absorption test (Cooked noodle weight) Seven samples consisted of 10 g noodle were cooked in a big boiler containing 2L boiling water for 4, 5, 6, 7, 8, 9, 10 min. At given times samples were removed from the boiler, rapidly blotted, and accurately weighed. Low TOM value, cooking loss, and cooked noodle weight indicate high noodle cooking quality
  • 12.
    Results 6 min cooking time 10 min cooking time 2.5 Cooked noodle weight for 10 min (g) 24 A 24 Cooked noodle weight (g) r = 0.69, P <0.01 2.0 r = 0.46, P <0.01 r = 0.86, P <0.01 23 TOM value 22 1.5 22 20 1.0 21 18 0.5 20 r = 0.66, P <0.01 16 0.0 19 0.0 0.5 1.0 1.5 2.0 2.5 3.0 4.0 5.0 6.0 7.0 8.0 17 18 19 20 21 T OM value (%) Cooking losses (%) Cooked noodle weight for 6 min (g) Relationship among evaluation parameters of noodle cooking quality  TOM value was significantly and positively correlated with cooking losses and cooked noodle weights for 6 min and 10 min, correlation coefficient between cooked noodle weight for 6 min and 10 min cooking time was 0.86.  The procedure for testing cooked noodle weight was more easier than TOM value and cooking losses.  The cooked noodle weight for 10 min was recommended to be an important parameter for evaluation of noodle cooking quality.
  • 13.
    Cooked noodle weightof samples at different cooking time 25.0 cooked noodle weight (g) 23.0 Xinong 979 21.0 Zhoumai 23 19.0 Taikong 6 17.0 Linmai 4 15.0 4 5 6 7 8 9 10 Cooking time(min)  Cooked noodle weight of four samples increased significantly as cooking time increased from 4 to 10 min, viz. noodle cooking quality of that decreased significantly.  Large variations were observed in water sorption of noodle at different cooking time.  Cooked noodle weight for 10 min were more suitable for assessing noodle cooking quality compared with 6 min.
  • 14.
    Noodle cooking qualityclassification of tested samples Classification Mean (g)a Rangeb Number of samples Good 20.57c 19.76~20.95 19 (≤21.0) Fair 21.37b 21.02~21.94 17 poor 22.62a 22.06~23.46 10 a,b Samples were ranked on cooked noodle weight for 10 min  46 tested samples were classified to three groups which were good, fair, and poor noodle cooking quality based on cooked noodle weight for 10 min.  For 10 g fresh noodle, the cooked noodle weight for 10 min should be no more than 21.0 g for good noodle cooking quality in Chinese wheat samples.
  • 15.
    Relationship between proteincontent and gluten strength and parameters of noodle cooking quality 8.0 24.5 r = -0.63, P <0.01 Noodle weight (10 min,g) Cooking losses (%) 7.0 23.5 r = 0.69, P <0.01 6.0 22.5 5.0 21.5 4.0 20.5 3.0 19.5 11.0 12.0 13.0 14.0 15.0 16.0 0 50 100 150 200 Mixing tolerance index (BU) Protein content (%)  Protein content was significantly and negatively associated with cooking losses (r = -0.63), and farinogram mixing tolerance index was significantly and positively correlated with cooked noodle weights (r = 0.69).  Protein content and gluten strength positively contributed to noodle cooking quality.
  • 16.
    Relationship between energyand maximum resistance and parameters of noodle cooking quality 21.0 Cooked noodle weight (6 min,g) 2.5 20.0 2.0 r = -0.63, P <0.01 r = -0.66, P<0.01 TOM value 1.5 19.0 1.0 18.0 0.5 17.0 0.0 0 50 100 150 16.0 0 200 400 600 800 Energy(cm 2 ) Max.resistance (BU)  Energy (r = -0.66) and maximum resistance (r = -0.63) were significantly and negatively associated with TOM value and cooked noodle weights, respectively.  Flour protein property was the major factor in determining noodle cooking quality.
  • 17.
    Relationship between starchpasting property and parameters of noodle cooking quality Noodle cooking quality was also affected slightly by starch pasting parameters.
  • 18.
    Relationship between glutenstrength and starch pasting property and total score of noodle sensory evaluation 95 95 90 90 85 85 DWCN score DWCN score 80 80 75 75 70 70 65 65 60 60 55 55 0 200 400 600 800 150 200 250 300 Max resistance (B.U.) Peak viscosity (RVU)  The association between gluten strength and noodle total score fitted quadratic regression model. This suggests that over strong quality wheat will have negative effect on Chinese noodle quality.  Starch peak viscosity contributed positively to Chinese noodle quality.
  • 19.
    Summary-1  The cooked noodle weight for 10 min was recommended to be an important parameter for evaluation of noodle cooking quality.  For 10 g fresh noodle, the cooked noodle weight for 10 min should be no more than 21.0 g for good noodle cooking quality in Chinese wheat samples.  It is suggested that cooked noodle weight for 10 min should be measured as well as sensory evaluation Chinese noodle quality for wheat breeding program.
  • 20.
    Summary-2  Flour protein property was the major factor in determining noodle cooking quality.  Noodle cooking quality was also affected slightly by starch pasting parameters.  Flour with medium protein content, medium to strong gluten strength, and starch high peak viscosity are desirable for Chinese noodle quality.
  • 21.
    Acknowledgement  Prof. Jun Yan , Dr. Yonggui Xiao, and Mr. Desen Wang , providing wheat samples  Funding from the national natural science foundation of China (31171547) and an international collaboration project on wheat improvement from Chinese Ministry of Agriculture (2011-G3)
  • 22.
    Thank you foryour attention 谢谢!