1. Queen Mary Trading & Investment Society
Energy Market Round-up (February 2nd, 2015)
1
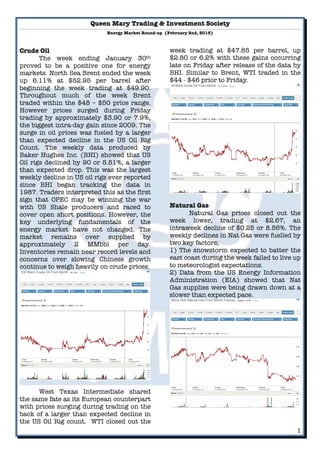
Crude Oil
The week ending January 30th
proved to be a positive one for energy
markets. North Sea Brent ended the week
up 6.11% at $52.95 per barrel after
beginning the week trading at $49.90.
Throughout much of the week Brent
traded within the $48 – $50 price range.
However prices surged during Friday
trading by approximately $3.90 or 7.9%,
the biggest intra-day gain since 2009. The
surge in oil prices was fueled by a larger
than expected decline in the US Oil Rig
Count. The weekly data produced by
Baker Hughes Inc. (BHI) showed that US
Oil rigs declined by 90 or 5.51%, a larger
than expected drop. This was the largest
weekly decline in US oil rigs ever reported
since BHI began tracking the data in
1987. Traders interpreted this as the first
sign that OPEC may be winning the war
with US Shale producers and raced to
cover open short positions. However, the
key underlying fundamentals of the
energy market have not changed. The
market remains over supplied by
approximately 2 MMbbl per day.
Inventories remain near record levels and
concerns over slowing Chinese growth
continue to weigh heavily on crude prices.
West Texas Intermediate shared
the same fate as its European counterpart
with prices surging during trading on the
back of a larger than expected decline in
the US Oil Rig count. WTI closed out the
week trading at $47.85 per barrel, up
$2.80 or 6.2% with these gains occurring
late on Friday after release of the data by
BHI. Similar to Brent, WTI traded in the
$44 - $46 prior to Friday.
Natural Gas
Natural Gas prices closed out the
week lower, trading at $2.67, an
intraweek decline of $0.25 or 8.56%. The
weekly declines in Nat Gas were fuelled by
two key factors;
1) The snowstorm expected to batter the
east coast during the week failed to live up
to meteorologist expectations.
2) Data from the US Energy Information
Administration (EIA) showed that Nat
Gas supplies were being drawn down at a
slower than expected pace.
2. Queen Mary Trading & Investment Society
Energy Market Round-up (February 2nd, 2015)
2
Revenge of the Oil Workers? - On Sunday
February 1st the United Steelworkers
Union (USW), a large union
representative for workers in the US Oil &
Gas Industry began strike action at 9 US
refinery and chemical plant sites. The
strike action resulted after negotiations
between the union and the
energy/petrochemicals industry led by
Royal Dutch Shell broke down. The
refineries involved in the strike at present
can produce approximately 1.82 MMbbl
of fuel per day, approximately 10% of
total US capacity. It has also been
reported that more refineries are
standing by to join the strike action.
Notably, USW has not called a national
strike since 1980, when that stoppage
lasted for 3 months.
This could have major implications
for prices on distillates such as gasoline in
the near future, dependent upon how long
the negotiations take and whether the
Union decides to take a more aggressive
stance.
One step closer to Keystone
The US senate, currently controlled by
republican passed a bill to approve the
Keystone XL pipeline. The proposed
Keystone XL pipeline is expected to
transport oil from the Alberta Oil Sands in
Canada to Nebraska and increase supply
into US refineries by 830K barrels per
day. The action by the US senate is in an
effort to bypass the administration
review, which has been on going for the
past 6 years. While this will not have any
impact on energy prices in the short-term,
approval of the pipeline would eventually
increase overall supplies of crude oil stock
available to refineries in the Gulf and
reduce America’s need for imports crude
from Middle Eastern and South American
countries. Supporting its goal of complete
energy independence.
Sustained low prices continue to hurt US oil
producers. The latest BHI rig count figures shown
above highlight how acutely US shale Oil
producers are feeling the pinch of cheap oil, with
the rapid decline in oil rigs.
The EIA reported total natural gas in storage at
2,543 billion cubic feet (Bcf), a WoW decline of
approximately 3.6%. Presently stocks of nat gas
are 324 Bcf higher than last year same time.
Created by - Brad Kellman, QMTIS Energy
Analyst