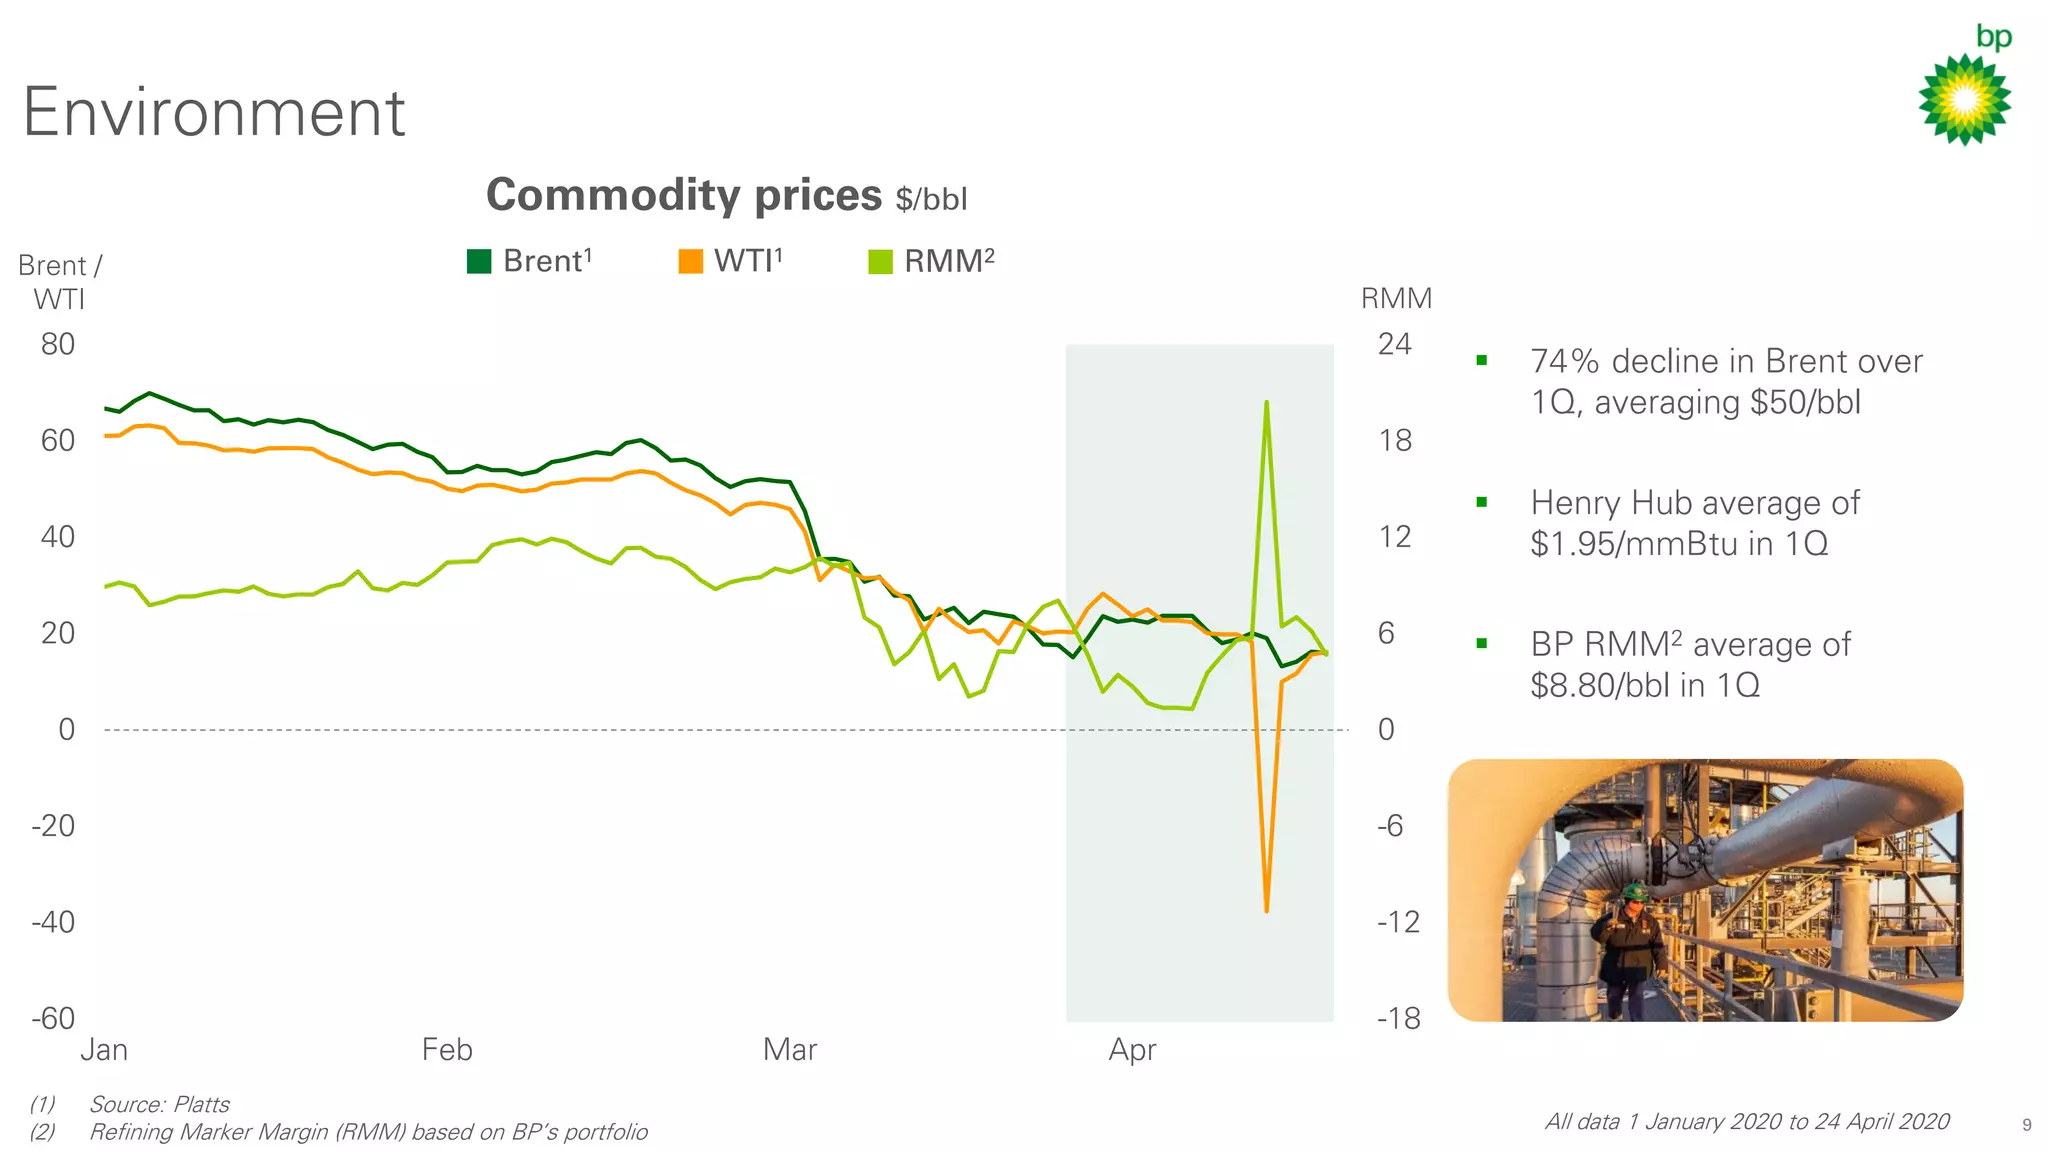
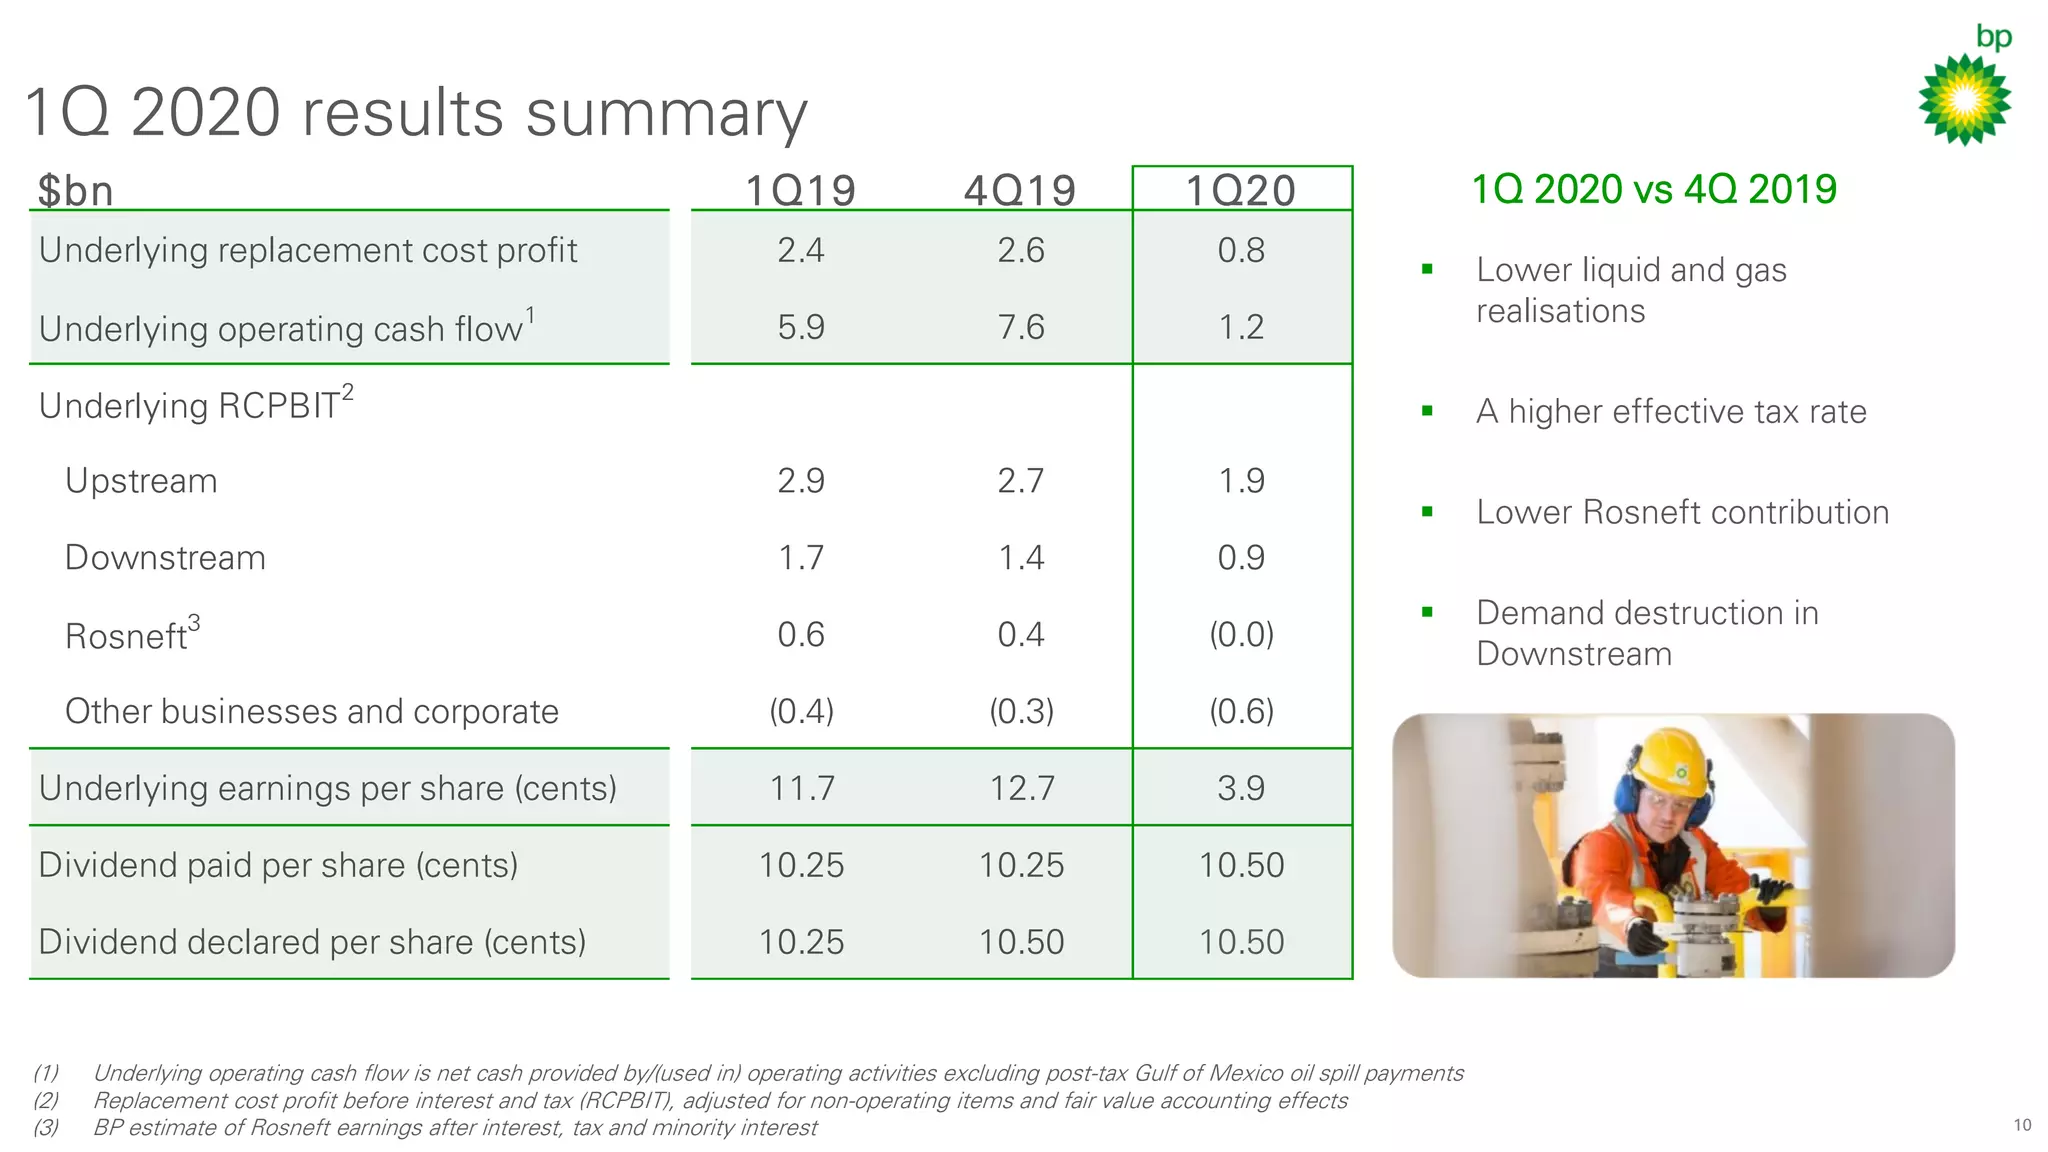
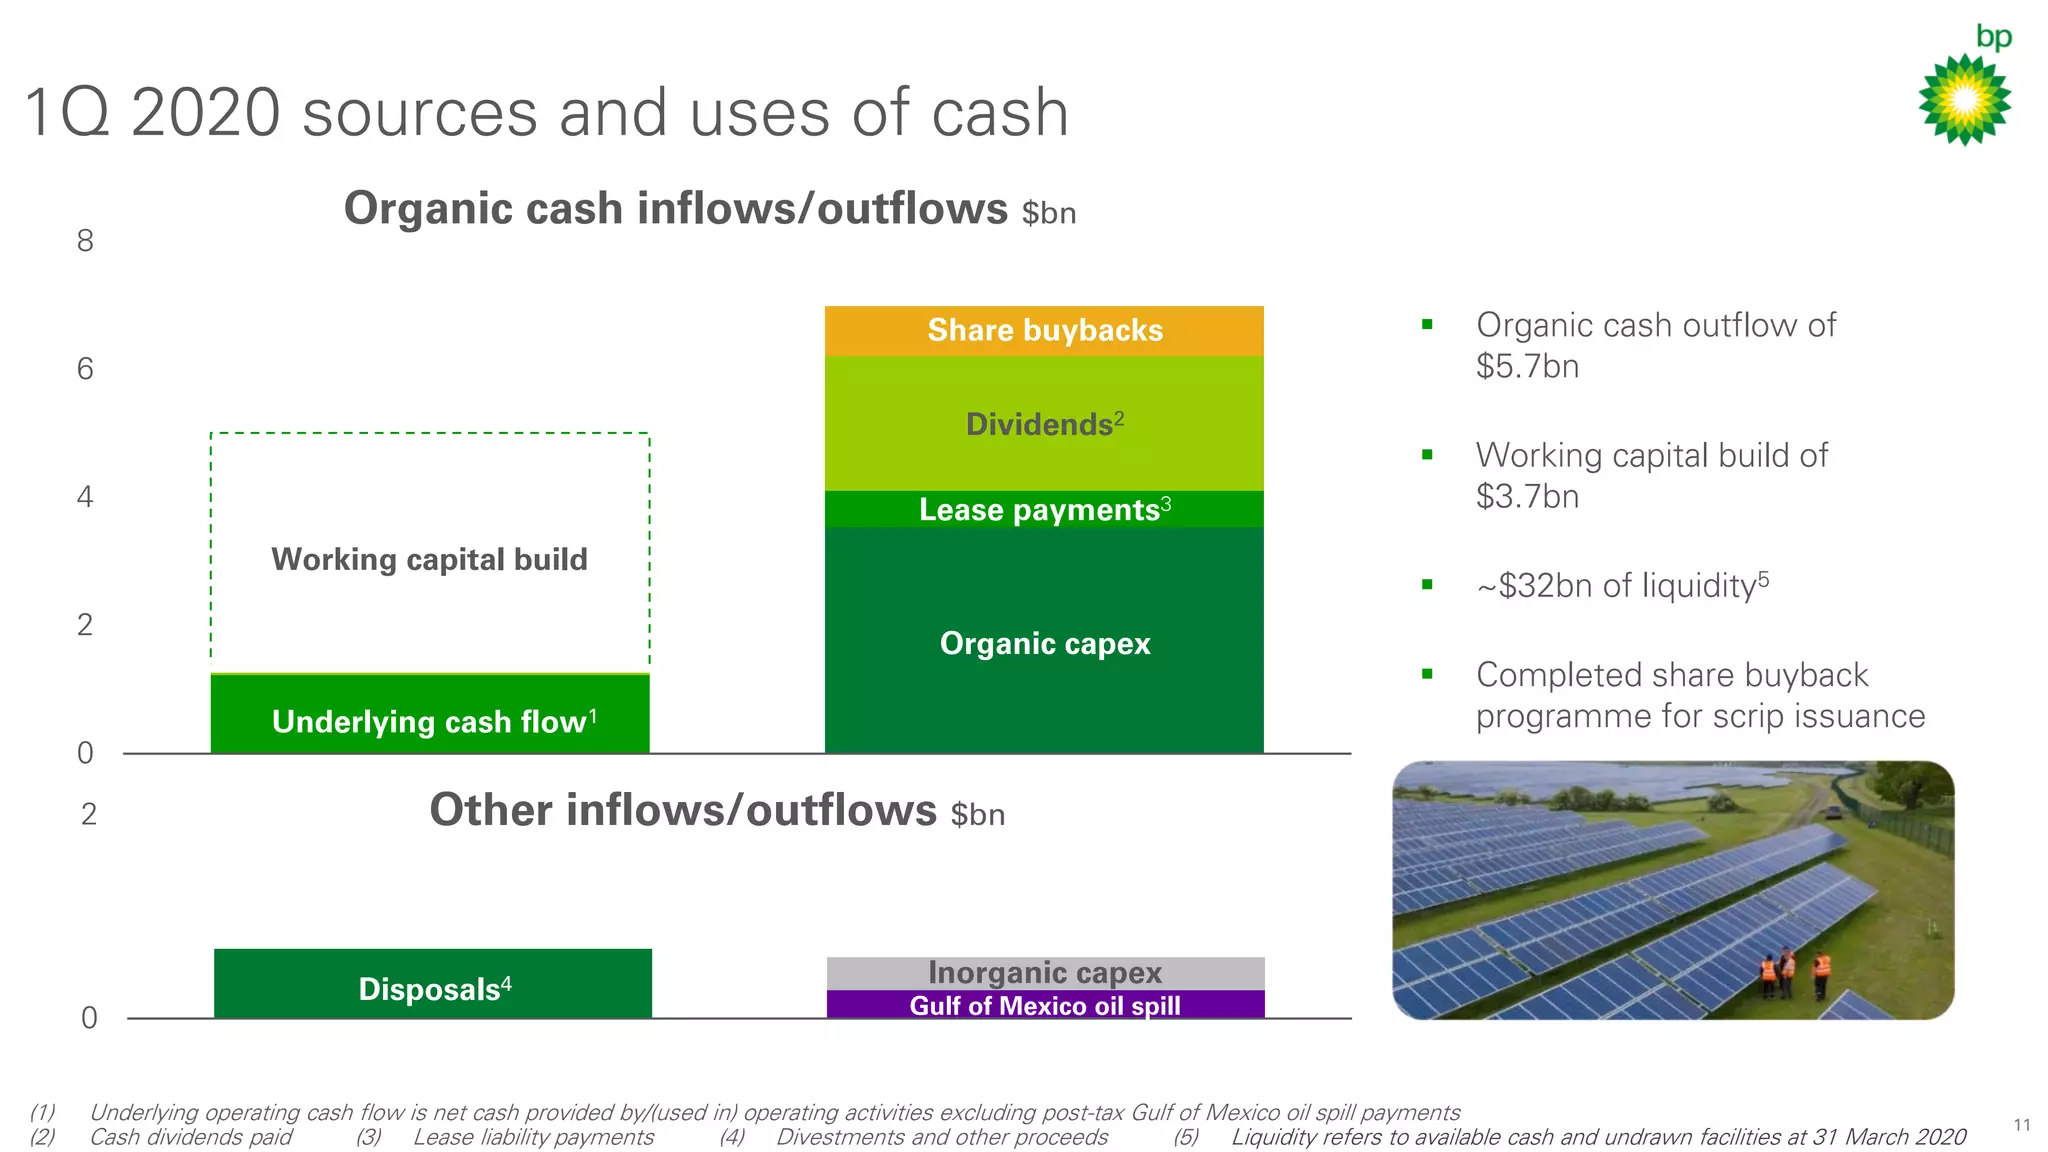
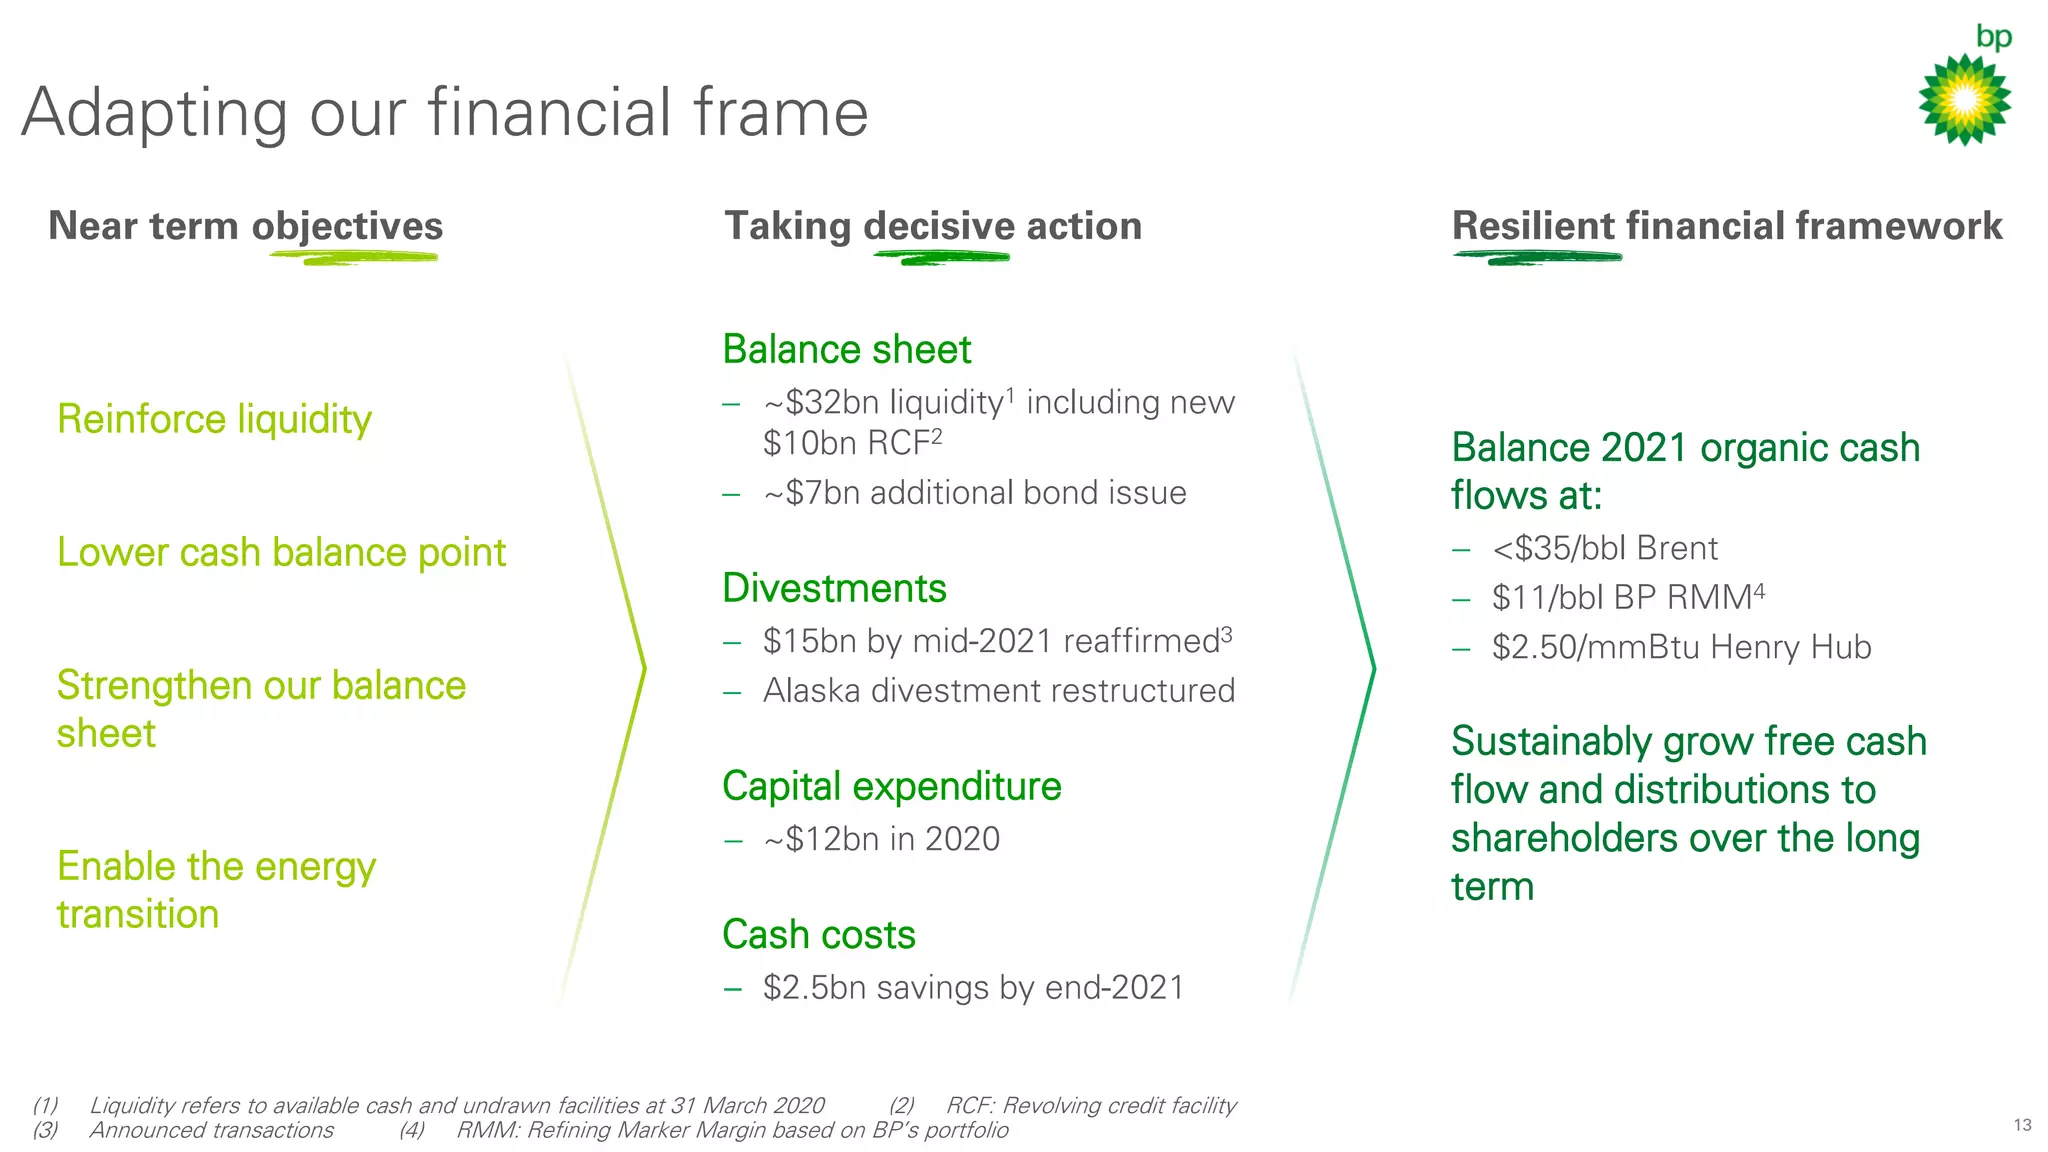
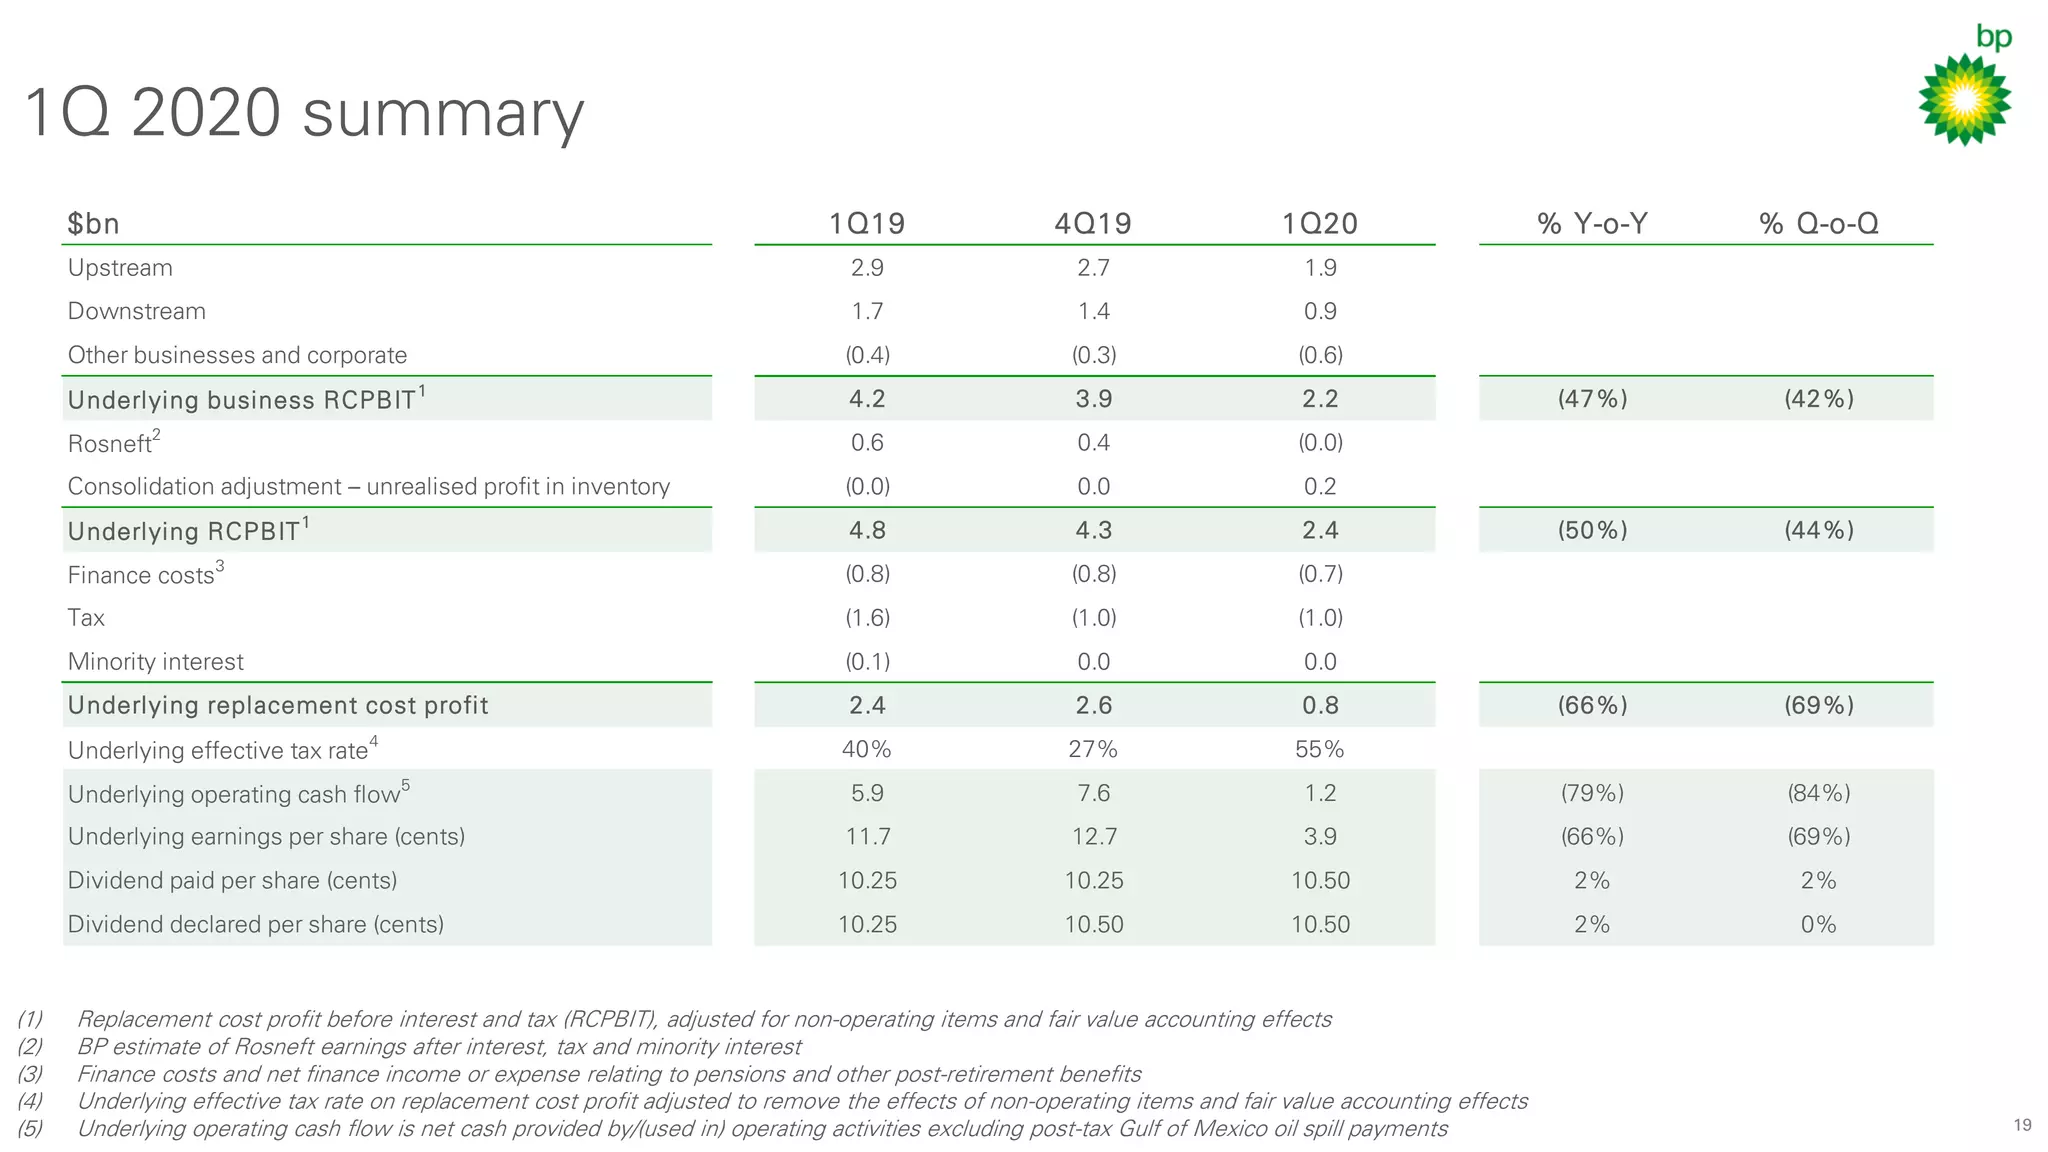
3. 3
Cautionary statement
Forward-looking statements - cautionary statement
In order to utilize the ‘safe harbor’ provisions of the United States Private Securities Litigation Reform Act of 1995 (the ‘PSLRA’) and the general doctrine of cautionary statements, BP is providing the following cautionary
statement. This presentation and the associated slides and discussion contain forward-looking statements – that is, statements related to future, not past events and circumstances – with respect to the financial condition,
results of operations and business of BP and certain of the expectations, intentions, plans and objectives of BP with respect to these items, in particular statements regarding expectations related to the world economy,
future oil and gas prices and global energy supply and demand, including with respect to the COVID-19 pandemic including its risks, impacts, consequences and challenges and BP’s response; plans and expectations
relating to BP’s net zero ambition; plans and expectations relating to the financial framework and the investor proposition, focus on safety, the operational impact of COVID-19, commitment regarding employee job security,
the divestment programme including expectations with respect to completion of transactions and the timing and amount of proceeds of agreed disposals (including the announced sale of our Alaskan business to Hilcorp),
reductions in organic capital expenditure and reductions in production due to capex interventions and cash cost savings; plans and expectations with respect to the amount of capital expenditure in 2020; plans and
expectations to maintain and reinforce the liquidity position, drive the cash balance point lower in 2021 and to rebalance sources and uses of cash at a Brent price of below $35 per barrel, a Henry Hub price of $2.50 per
million BTUs and a refining marker margin of $11 per barrel in 2021; plans and expectations to strengthen the balance sheet and enable the energy transition; plans and expectations with respect to the implementation and
impact of cost-saving measures, including to achieve $2.5 billion in cost savings by the end of 2021 on a base of 2019; plans and expectations with respect to the reinvention and reorganization of BP; expectations regarding
demand for BP’s products in the Upstream and Downstream; expectations regarding OPEC plus supply cuts and their impact on the supply imbalance; expectations regarding Upstream reported production in the second
quarter of and full year 2020; expectations regarding the Downstream refining margins, utilisation and light-heavy crude spreads; expectations regarding BP’s strategic plan and financial frame including organic capital
expenditure, organic free cash flow and operating cash flow, Rosneft contribution, Gulf of Mexico oil spill payments and the 2020 underlying effective tax rate; expectations with respect to unsold product balances, late
receivables, and working capital; plans to invest around $500 million in low-carbon activities in 2020; plans and expectations regarding the long-term commitment to sustainably growing free cash flow and distributions to
shareholders; expectations for net debt levels and gearing to remain above the 20-30% range into 2021 and for gearing to trend down over time; and plans and expectations with respect to quarterly dividends.
By their nature, forward-looking statements involve risk and uncertainty because they relate to events and depend on circumstances that will or may occur in the future and are outside the control of BP. Actual results may
differ materially from those expressed in such statements, depending on a variety of factors, including: the extent and duration of the impact of current market conditions including the significant drop in the oil price, the
impact of COVID-19, overall global economic and business conditions impacting our business and demand for our products as well as the specific factors identified in the discussions accompanying such forward-looking
statements; the receipt of relevant third party and/or regulatory approvals; the timing and level of maintenance and/or turnaround activity; the timing and volume of refinery additions and outages; the timing of bringing new
fields onstream; the timing, quantum and nature of certain acquisitions and divestments; future levels of industry product supply, demand and pricing, including supply growth in North America; OPEC quota restrictions;
PSA and TSC effects; operational and safety problems; potential lapses in product quality; economic and financial market conditions generally or in various countries and regions; political stability and economic growth in
relevant areas of the world; changes in laws and governmental regulations; regulatory or legal actions including the types of enforcement action pursued and the nature of remedies sought or imposed; the actions of
prosecutors, regulatory authorities and courts; delays in the processes for resolving claims; amounts ultimately payable and timing of payments relating to the Gulf of Mexico oil spill; exchange rate fluctuations; development
and use of new technology; recruitment and retention of a skilled workforce; the success or otherwise of partnering; the actions of competitors, trading partners, contractors, subcontractors, creditors, rating agencies and
others; our access to future credit resources; business disruption and crisis management; the impact on our reputation of ethical misconduct and non-compliance with regulatory obligations; trading losses; major uninsured
losses; decisions by Rosneft’s management and board of directors; the amount of Rosneft’s contribution to BP’s earnings; the actions of contractors; natural disasters and adverse weather conditions; changes in public
expectations and other changes to business conditions; wars and acts of terrorism; cyber-attacks or sabotage; and other factors discussed under “Risk factors” in BP Annual Report and Form 20-F 2019 as filed with the US
Securities and Exchange Commission.
Reconciliations to GAAP - This presentation also contains financial information which is not presented in accordance with generally accepted accounting principles (GAAP). A quantitative reconciliation of this information to
the most directly comparable financial measure calculated and presented in accordance with GAAP can be found on our website at www.bp.com.
Tables and projections in this presentation are BP projections unless otherwise stated.
April 2020
9. 9
Environment
Commodity prices $/bbl
(1) Source: Platts
(2) Refining Marker Margin (RMM) based on BP’s portfolio All data 1 January 2020 to 24 April 2020
-18
-12
-6
0
6
12
18
24
-60
-40
-20
0
20
40
60
80
Jan Feb Mar Apr
▪ 74% decline in Brent over
1Q, averaging $50/bbl
▪ Henry Hub average of
$1.95/mmBtu in 1Q
▪ BP RMM2 average of
$8.80/bbl in 1Q
Brent1 RMM2
Brent /
WTI RMM
WTI1
10. 10
1Q 2020 vs 4Q 2019
▪ Lower liquid and gas
realisations
▪ A higher effective tax rate
▪ Lower Rosneft contribution
▪ Demand destruction in
Downstream
$bn 1Q19 4Q19 1Q20
Underlying replacement cost profit 2.4 2.6 0.8
Underlying operating cash flow
1
5.9 7.6 1.2
Underlying RCPBIT2
Upstream 2.9 2.7 1.9
Downstream 1.7 1.4 0.9
Rosneft
3
0.6 0.4 (0.0)
Other businesses and corporate (0.4) (0.3) (0.6)
Underlying earnings per share (cents) 11.7 12.7 3.9
Dividend paid per share (cents) 10.25 10.25 10.50
Dividend declared per share (cents) 10.25 10.50 10.50
1Q 2020 results summary
(1) Underlying operating cash flow is net cash provided by/(used in) operating activities excluding post-tax Gulf of Mexico oil spill payments
(2) Replacement cost profit before interest and tax (RCPBIT), adjusted for non-operating items and fair value accounting effects
(3) BP estimate of Rosneft earnings after interest, tax and minority interest
11. 11
▪ Organic cash outflow of
$5.7bn
▪ Working capital build of
$3.7bn
▪ ~$32bn of liquidity5
▪ Completed share buyback
programme for scrip issuance
0
2
4
6
8
0
2
1Q 2020 sources and uses of cash
Organic cash inflows/outflows $bn
Other inflows/outflows $bn
(1) Underlying operating cash flow is net cash provided by/(used in) operating activities excluding post-tax Gulf of Mexico oil spill payments
(2) Cash dividends paid (3) Lease liability payments (4) Divestments and other proceeds (5) Liquidity refers to available cash and undrawn facilities at 31 March 2020
Underlying cash flow1
Organic capex
Dividends2
Disposals4
Gulf of Mexico oil spill
Inorganic capex
Share buybacks
Lease payments3
Working capital build
13. 13
Adapting our financial frame
Balance 2021 organic cash
flows at:
− <$35/bbl Brent
− $11/bbl BP RMM4
− $2.50/mmBtu Henry Hub
Sustainably grow free cash
flow and distributions to
shareholders over the long
term
(1) Liquidity refers to available cash and undrawn facilities at 31 March 2020 (2) RCF: Revolving credit facility
(3) Announced transactions (4) RMM: Refining Marker Margin based on BP’s portfolio
Near term objectives Taking decisive action Resilient financial framework
Reinforce liquidity
Lower cash balance point
Strengthen our balance
sheet
Enable the energy
transition
Balance sheet
− ~$32bn liquidity1 including new
$10bn RCF2
− ~$7bn additional bond issue
Divestments
− $15bn by mid-2021 reaffirmed3
− Alaska divestment restructured
Capital expenditure
− ~$12bn in 2020
Cash costs
– $2.5bn savings by end-2021
14. 14
2020 guidance
Upstream production
excluding Rosneft
Lower than
20191
Organic capital
expenditure
~$12bn
DD&A
Slightly below
2019
Gulf of Mexico oil spill
payments
<$1bn
OB&C2 underlying
quarterly charge
~$350m
Second quarter
(1) Underlying production. The actual reported number will depend on divestments, OPEC quotas, and other factors (2) OB&C: Other business and corporate
Upstream
Lower reported production subject to:
▪ Significant uncertainties around implementation of OPEC+ restrictions
▪ Price impacts on entitlement volumes
▪ Divestments
▪ Market restrictions given lack of demand for oil; and
▪ COVID-19 operational impacts
Downstream
▪ Significantly lower product demand in European and North American
marketing businesses
▪ Reduced refinery utilisation due to lower demand
▪ Significantly lower industry refining margins; and
▪ A lower level of North American heavy crude discounts
Full year
19. 19
1Q 2020 summary
(1) Replacement cost profit before interest and tax (RCPBIT), adjusted for non-operating items and fair value accounting effects
(2) BP estimate of Rosneft earnings after interest, tax and minority interest
(3) Finance costs and net finance income or expense relating to pensions and other post-retirement benefits
(4) Underlying effective tax rate on replacement cost profit adjusted to remove the effects of non-operating items and fair value accounting effects
(5) Underlying operating cash flow is net cash provided by/(used in) operating activities excluding post-tax Gulf of Mexico oil spill payments
$bn 1Q19 4Q19 1Q20 % Y-o-Y % Q-o-Q
Upstream 2.9 2.7 1.9
Downstream 1.7 1.4 0.9
Other businesses and corporate (0.4) (0.3) (0.6)
Underlying business RCPBIT1
4.2 3.9 2.2 (47%) (42%)
Rosneft2
0.6 0.4 (0.0)
Consolidation adjustment – unrealised profit in inventory (0.0) 0.0 0.2
Underlying RCPBIT
1
4.8 4.3 2.4 (50%) (44%)
Finance costs3
(0.8) (0.8) (0.7)
Tax (1.6) (1.0) (1.0)
Minority interest (0.1) 0.0 0.0
Underlying replacement cost profit 2.4 2.6 0.8 (66%) (69%)
Underlying effective tax rate4
40% 27% 55%
Underlying operating cash flow5
5.9 7.6 1.2 (79%) (84%)
Underlying earnings per share (cents) 11.7 12.7 3.9 (66%) (69%)
Dividend paid per share (cents) 10.25 10.25 10.50 2% 2%
Dividend declared per share (cents) 10.25 10.50 10.50 2% 0%
20. 20
1500
2000
2500
3000
3500
4000
1Q19 2Q19 3Q19 4Q19 1Q20
Upstream
Underlying RCPBIT3 $bn
(1) Group reported oil and gas production including Rosneft
(2) Realisations based on sales of consolidated subsidiaries only, excluding equity-accounted entities
(3) Replacement cost profit before interest and tax (RCPBIT), adjusted for non-operating items and fair value accounting effects
Volume mboed
Group production1
Upstream production
excluding Rosneft
2.9
3.4
2.1
2.7
1.9
0.0
1.0
2.0
3.0
4.0
5.0
1Q19 2Q19 3Q19 4Q19 1Q20
Non-US US Total
Realisations2 1Q19 4Q19 1Q20
Liquids ($/bbl) 56 56 47
Gas ($/mcf) 4.0 3.1 2.8
1Q 2020 vs 4Q 2019
▪ Lower liquids and gas realisations
Partially offset by
▪ Very strong gas marketing and trading
21. 21
1.7
1.4
1.9
1.4
0.9
0.0
0.5
1.0
1.5
2.0
1Q19 2Q19 3Q19 4Q19 1Q20
Fuels Lubricants Petrochemicals Total96%
Refining availability1
4Q19: 96%
Downstream
(1) BP-operated refining availability
(2) Replacement cost profit before interest and tax (RCPBIT), adjusted for non-operating items and fair value accounting effects
Underlying RCPBIT2 $bn
Refining
environment
1Q19 4Q19 1Q20
RMM ($/bbl) 10.2 12.4 8.8
1Q 2020 vs 4Q 2019
▪ Lower industry refining margins;
▪ Weaker fuels and lubricants demand driven by
COVID-19 impacts
Partially offset by
▪ Wider heavy crude oil discounts; and
▪ A lower level of turnaround activity
22. 22
-0.2
0.0
0.2
0.4
0.6
0.8
1.0
1Q19 2Q19 3Q19 4Q19 1Q20
Rosneft
(1) On a replacement cost basis and adjusted for non-operating items; 1Q20 represents BP estimate
(2) From 2018, represents BP’s share of 50% of Rosneft’s IFRS net profit, 2017 includes full year 2016 dividend and dividend relating to first half of 2017
(3) Average daily production for 1Q20
0.0
0.2
0.4
0.6
0.8
1.0
2017 2018 2019
Dividend paid
BP share of Rosneft dividend2 $bnBP share of underlying net income1 $bn
1.1mmboed
BP share of Rosneft production3