Meta-Analysis in Ayurveda
•
0 likes•243 views

This document discusses meta-analysis and network meta-analysis in Ayurveda. It defines meta-analysis as a systematic literature review using statistical methods to aggregate findings from multiple related studies. Network meta-analysis extends this concept by including indirect treatment comparisons across different interventions studied. The document provides examples of outcomes that can be analyzed and models used. It also discusses integrating real-world evidence from non-clinical sources with randomized clinical trial data to better predict real-world results.

Recommended
More Related Content
What's hot
What's hot (20)
Similar to Meta-Analysis in Ayurveda
Similar to Meta-Analysis in Ayurveda (20)
More from Ayurdata
More from Ayurdata (20)
Recently uploaded
Recently uploaded (20)
Meta-Analysis in Ayurveda
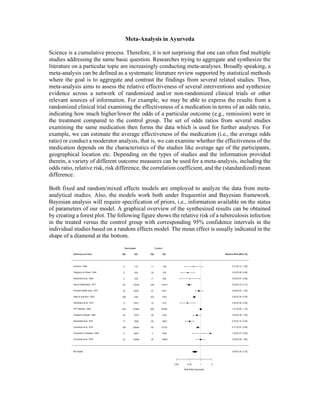
- 1. Meta-Analysis in Ayurveda Science is a cumulative process. Therefore, it is not surprising that one can often find multiple studies addressing the same basic question. Researches trying to aggregate and synthesize the literature on a particular topic are increasingly conducting meta-analyses. Broadly speaking, a meta-analysis can be defined as a systematic literature review supported by statistical methods where the goal is to aggregate and contrast the findings from several related studies. Thus, meta-analysis aims to assess the relative effectiveness of several interventions and synthesize evidence across a network of randomized and/or non-randomized clinical trials or other relevant sources of information. For example, we may be able to express the results from a randomized clinical trial examining the effectiveness of a medication in terms of an odds ratio, indicating how much higher/lower the odds of a particular outcome (e.g., remission) were in the treatment compared to the control group. The set of odds ratios from several studies examining the same medication then forms the data which is used for further analyses. For example, we can estimate the average effectiveness of the medication (i.e., the average odds ratio) or conduct a moderator analysis, that is, we can examine whether the effectiveness of the medication depends on the characteristics of the studies like average age of the participants, geographical location etc. Depending on the types of studies and the information provided therein, a variety of different outcome measures can be used for a meta-analysis, including the odds ratio, relative risk, risk difference, the correlation coefficient, and the (standardized) mean difference. Both fixed and random/mixed effects models are employed to analyze the data from meta- analytical studies. Also, the models work both under frequentist and Bayesian framework. Bayesian analysis will require specification of priors, i.e., information available on the status of parameters of our model. A graphical overview of the synthesized results can be obtained by creating a forest plot. The following figure shows the relative risk of a tuberculosis infection in the treated versus the control group with corresponding 95% confidence intervals in the individual studies based on a random effects model. The mean effect is usually indicated in the shape of a diamond at the bottom.
- 2. Network meta-analysis (NMA) extends traditional meta-analysis concept by including multiple pairwise comparisons across a range of interventions across studies. With a network meta- analysis, the relative effectiveness of two treatments can be estimated even if no studies directly compare them (indirect comparisons). It provides direct evidence which comes from studies directly randomizing treatments of interest and indirect evidence which comes from studies comparing treatments of interest with a common comparator. Direct and indirect treatment comparisons are also popularly referred to as mixed treatment comparisons (MTC). For instance, with two independent trials with treatments H and Q against Placebo (P), it is possible to make indirect comparisons between H and Q based on NMA. If a direct comparison between H and Q is available, this information can then be combined with indirect comparison to produce stronger evidence. NMA involves certain assumptions like the following: Similarity: Clinical and methodological homogeneity with respect to effect modifiers. Transitivity: Requires that sets of ABdirect and BCdirect studies are similar in distributions of effect modifiers, for a valid indirect comparison (say ACindirect ). Consistency: Occurs when subtraction equation, (ACindirect = ABdirect – BCdirect ) is supported by the data. Inconsistency: Refers to the degree of disagreement between source specific treatment effects (e.g., moderate vs severe illness) and is measured by the difference between direct and indirect estimates (ACdirect - ACindirect ) beyond what can be explained by chance. Heterogeneity: Refers to the degree of disagreement between study-specific treatment effects beyond what is explained by chance variability. We can see the overall structure of treatment comparisons in our network through a netgraph. We can see that the edges have a different thickness, which corresponds to how often we find this specific comparison in our network. We see that Rosiglitazone has been compared to Placebo in many trials (Note: short names are used in the graph). We also see the one multi- arm trial in our network, which is represented by the blue triangle in our network. This is the study Willms2003, which compared Meformin, Acarbose and Placebo.
- 3. The estimates of direct and indirect evidence could be of the following form. comparison k prop nma direct indir. Diff z p-value acar:benf 0 0 -0.1106 . -0.1106 . . . acar:metf 1 0.28 0.2850 0.2000 0.3182 -0.1182 -0.21 0.8368 acar:migl 0 0 0.1079 . 0.1079 . . . acar:piog 0 0 0.2873 . 0.2873 . . . acar:plac 2 0.65 -0.8418 -0.8567 -0.8138 -0.0429 -0.08 0.9338 acar:rosi 0 0 0.3917 . 0.3917 . . . acar:sita 0 0 -0.2718 . -0.2718 . . . acar:sulf 1 0.53 -0.4252 -0.4000 -0.4538 0.0538 0.10 0.9194 acar:vild 0 0 -0.1418 . -0.1418 . . . Legend: comparison - Treatment comparison k - Number of studies providing direct evidence prop - Direct evidence proportion nma - Estimated treatment effect (MD) in network meta-analysis direct - Estimated treatment effect (MD) derived from direct evidence indir. Estimated treatment effect (MD) derived from indirect evidence Diff - Difference between direct and indirect treatment estimates z - z-value of test for disagreement (direct versus indirect) p-value - p-value of test for disagreement (direct versus indirect) The important information here is in the P-value column. If the value in this column is P<0.05, there is a significant disagreement (inconsistency) between the direct and indirect estimate. We see in the output that there are indeed a few comparisons showing significant inconsistency between direct and indirect evidence when using the random effects model. Researchers are also increasingly using real world evidence (RWE) for synthesizing information from nonclinical sources with information from regular randomized clinical trials (RCT). Real world evidence (RWE) can include non-randomized studies, electronic health records, disease registries, and claims data but are not limited to these. Although RCTs are considered the most reliable source of information on relative treatment effects, their strictly experimental setting and inclusion criteria may limit their ability to predict results in real-world clinical practice. RWE is increasingly used due to its greater potential for generalizability to clinical practice than RCT findings. However, RWE is associated with selection bias due to the absence of randomization. The transition of findings from RCT towards RWE is depicted in the following figure.
- 4. FDA recognizes Real-World Data (RWD) as data relating to patient health status and/or the delivery of health care routinely collected from a variety of sources. The reliability of RWD, RWD sources, and resultant analyses are assessed by evaluating several factors as how the data were collected and that data quality and integrity are sufficient (data assurance). With respect to analyzing the RWE data, all the methods of NMA can be utilized to both analyze and integrate with data from randomized clinical trials provided we have an initial estimate of the treatment effect and its variance from each individual source of evidence. --- Jayaraman, AyurData PS: This article has been posted to inform the readers of the possibility of this important mode of investigation and encourage them to initiate such projects in respect of ayurvedic formulations.