SlideShare a Scribd company logo
1 of 5
Download to read offline
SPECIAL ARTICLE: STATISTICS IN ONCOLOGY SERIES
Guidelines for Statistical Reporting in Medical
Journals
Fang-Shu Ou, PhD,a,
* Jennifer G. Le-Rademacher, PhD,a
Karla V. Ballman, PhD,b
Alex A. Adjei, MD, PhD,c
Sumithra J. Mandrekar, PhDa
a
Department of Health Sciences Research, Mayo Clinic, Rochester, Minnesota
b
Department of Health Care Policy and Research, Weill Cornell Medical College, Ithaca, New York
c
Department of Oncology, Mayo Clinic, Rochester, Minnesota
Received 15 April 2020; revised 10 August 2020; accepted 14 August 2020
Available online - 25 August 2020
ABSTRACT
Statistical methods are essential in medical research. They
are used for data analysis and drawing appropriate con-
clusions. Clarity and accuracy of statistical reporting in
medical journals can enhance readers’ understanding of the
research conducted and the results obtained. In this
manuscript, we provide guidelines for statistical reporting
in medical journals for authors to consider, with a focus on
the Journal of Thoracic Oncology.
Ó 2020 International Association for the Study of Lung
Cancer. Published by Elsevier Inc. All rights reserved.
Keywords: Statistical results; Reporting; Presenting; p value;
Medical journals
Introduction
High-quality reporting of statistical methods and
results is essential for reviewers and readers to evaluate
the quality and credibility of evidence presented in a
manuscript. To help authors adhere to best practices,
many journals1-4
now provide detailed guidelines.
Specific guidelines are also available, such as the
CONSORT statement5
for randomized clinical trials, the
Strengthening the Reporting of Observational Studies in
Epidemiology statement6
for observational studies, the
STARD initiative7
for diagnostic accuracy studies, and
Preferred Reporting Items for Systematic Reviews and
Meta-Analyses statement for meta-analyses8
(see the
Enhancing the Quality and Transparency of Health
Research Network9
for a comprehensive listing of
study type–specific reporting guidelines). These guide-
lines aim to improve the clarity of presented methods
and results and standardize statistical reporting to
enhance comparability with similar research. Here, we
present guidelines for authors to consider when drafting
manuscripts for the Journal of Thoracic Oncology.
Guidelines on Statistical Reporting
In the Methods Section
The principle of writing the methods section is that it
should “describe statistical methods with enough detail
to enable a knowledgeable reader with access to the
original data to judge its appropriateness for the study
and to verify the reported results.”10
To achieve this goal, the statistical design of the study
should be described, including the objectives of the
study and patient population or patient selection. Clin-
ical trial design parameters, such as type I error
(including the choice of a one-sided or two-sided test),
study power, primary end point, effect size, and assumed
accrual rate, are needed for readers to judge the validity
of the sample size and the number of events required.
Additional details on the randomization scheme, planned
interim analyses, primary end point, and analysis
method (including population definitions) are also
necessary. For an observational study, one should
mention whether the study is designed for hypothesis
testing or hypothesis generation. Good practice dictates
that the statistical analysis plan should be determined
before conducting the analysis. This plan should include
*Corresponding author.
Disclosure: The authors declare no conflict of interest.
Address for correspondence: Fang-Shu Ou, PhD, Department of Health
Sciences Research, Mayo Clinic, 200 First Street SW, Rochester, MN
55905. E-mail: ou.fang-shu@mayo.edu
ª 2020 International Association for the Study of Lung Cancer.
Published by Elsevier Inc. All rights reserved.
ISSN: 1556-0864
https://doi.org/10.1016/j.jtho.2020.08.019
Journal of Thoracic Oncology Vol. 15 No. 11: 1722–6
the level of significance that will be used in the study,
which means the threshold below which a p value would
indicate statistical significance. In addition, the plan
should specify whether there will be p value adjustment
for multiple comparisons and the rationale for the
decision.
The method(s) for handling missing data should also
be specified. If a data-driven variable selection was
conducted, the methods employed should be described
and accompanied by sufficient details of the steps taken
in the process (e.g., variables initially used in the variable
selection process, the threshold p value in a stepwise
selection, or tuning parameter selection in a machine
learning method). For Bayesian analyses or more com-
plex statistical analyses, sufficient details should be
provided in an appendix so that interested readers can
fully understand the methods used for the study.
Finally, the analysis software and version should be
included because they may use different optimization
and numerical routines, which produce slightly different
results. For a clinical trial, the clinical trial number
should be listed accompanied by the trial protocol, if
required by the journal.
In the Results Section
Patient Characteristics Table. The first table in the
results section usually summarizes the baseline charac-
teristics of the study population. If there is only one
group of patients in the study, this table only has a single
column of summarized data. However, if the main
objective is to compare across identified groups, each
group should have its own column. Baseline variables
measured on each patient are listed as rows. This table
should include all key baseline variables that define the
study population in terms of demographics, comorbid-
ities and history, and disease characteristics along with
prognostic variables associated with the primary
outcome. Continuous variables should be summarized
with mean and SD. If the distribution of value is skewed,
it is recommended that the median and range (minimum
and maximum values) or the interquartile range (lower
quartile and upper quartile values) should be included.
Categorical values should be reported as the count and
percentages for each level of the variable. If there are
missing observations, the number of patients with
missing data should be recorded for both continuous and
categorical variables. When the number of missing
values is negligible, then the percentage of missing
category do not need to be calculated, and the denomi-
nator for percentage calculations should not include
missing values.
If patients were randomized to the groups being
compared, the p value should not be included in the
patient characteristics table for the comparison across
groups because any differences observed between the
groups is random. However, if the study is an observa-
tional study, a p value comparing the value of a specific
variable across the groups (using an appropriate statis-
tical test) should be included for each variable in the
table. For data that are for a subset of randomized pa-
tients, such as quality of life or biomarker substudies
that contain only patients who consented to the sub-
study, the randomization no longer holds, and it cannot
be assumed that differences between the groups are
because of chance. If the subset contains less than 90%
of the originally randomized patients, it is recommended
that p values be provided in the patient characteristic
table.
p Value. The p value is the probability of obtaining a
result at least as extreme as what was observed when
the null hypothesis is true.11
A small p value usually
means that the difference found in a study is unlikely
because of chance alone.12
When results are reported,
the magnitude of the difference between groups should
be reported along with the p value. Differences between
groups should be estimated with a point estimate (e.g.,
absolute differences in means or proportions, ORs, or
hazard ratios, whichever is the most appropriate for the
outcomes) and confidence interval (CI). The precise p
value should be reported rather than stating that it is
less than the level of significance or that it is not sig-
nificant. Generally, it is acceptable to report p values to
two decimal places (round to the nearest 100th) when
greater than 0.01; three decimal places (round to the
nearest 1000th) when less than 0.01. If a p value is quite
small, then it is acceptable to report it as a p value less
than 0.001. The p values arising from genome-wide as-
sociation studies or other high-dimensional data ana-
lyses should follow guidelines specific for those
methods.13
Two-sided p values should be reported
except when study designs explicitly assume a one-sided
p value. Recently, the American Statistical Association14
and other groups of the scientific community called for
less emphasis on p values. As a result, we recommend
reporting p values only when proper type I error con-
trols are in place and strongly discourage p values for
secondary and subgroup analyses in which point esti-
mates and CIs are preferred. Finally, if there is a pre-
specified level of significance, a result is either
statistically significant or not. The word trend should
only be used in a statistical test for trends in the data and
not to describe a p value that is close to the prespecified
level of significance.
Reporting of Categorical Outcomes. Categorical out-
comes such as response to treatment and occurrence of
adverse events are common in clinical studies.
November 2020 Guidelines for Statistical Reporting 1723
Categorical outcomes are summarized by frequencies
and percentages. CIs should be reported along with the
point estimates. It is important to clearly state the de-
nominator used for estimation. When the denominator is
the same for all categorical outcomes being reported, it is
sufficient to state the denominator once and clarify that
it is used for all subsequent outcomes; otherwise, it is
important to specify the denominator used in computing
the estimate for each outcome. When reporting com-
parisons of categorical outcomes among groups of pa-
tients, specify the statistical test used—for example, the
chi-square test, Fisher’s exact test, or the Z-test with or
without continuity correction. It is good practice to
include the same number of decimal places for all
percentages. We recommend reporting the percentage
with one decimal place (e.g., 12.3%) when the denomi-
nator is larger than 200.2
Forest Plots Are a Good Way to Present Subgroup
Analysis. Forest plot is a common graphical method of
illustrating treatment effects across all subgroups of in-
terest at one glance.15
It is meant as a visual aid rather
than an inferential tool. An informative forest plot should
include point estimates, CIs, and the sample sizes
(including the number of events when applicable) for
each subgroup so the readers can judge the precision of
the estimated effects. Including subgroup p values in
forest plots are strongly discouraged when trials are not
powered to detect the treatment effect in subgroups. If
hypothesis tests for specific subgroups are prespecified,
the trial design should be appropriately powered and
should account for the number of hypothesis tests
considered in the trial.
Another strongly discouraged practice is to include p
values for interaction tests in forest plots for subgroup
analysis.4
It is important to distinguish between sub-
group analyses and interaction tests. An interaction test
is a formal statistical test to evaluate whether the
treatment effect is influenced by other patient charac-
teristics (factor of interest). The test is conducted by a
regression model that includes the treatment, the factor
of interest, and an interaction term between the two
variables using the full patient set. This is in contrast
with subgroup analysis in which the treatment effect is
evaluated separately for each subgroup of patients, one
at a time, making it impossible to formally compare the
treatment effects among subgroups of patients.
Survival Analysis. Overall survival (OS) is a common
outcome used in clinical studies to judge the effective-
ness of a new treatment or the prognostic effect of a
baseline factor. OS data consist of two components that
need to be clearly defined. The first component is the
time interval starting from the time of origin (the time
from which OS is being measured) to the time of death or
of the last follow-up. The second component is an indi-
cator of whether the patient died or was alive at that last
time point. OS data can be summarized in multiple ways.
Kaplan-Meier curves16
are the most common visual
summary for survival data, and Table 1 includes some
suggestions to consider when plotting Kaplan-Meier
curves with an example in Figure 1. Another quantity
that is often reported with survival data is the median
time that patients were followed in the study. The me-
dian follow-up time should be estimated using the
Kaplan-Meier estimator with the event, and the
Table 1. Good Practices to Consider When Plotting Kaplan-Meier Curves
Domain Recommendations
Horizontal axis  The horizontal axis should be labeled with the time unit corresponding to the tick marks along the axis (see ❶ in Fig. 1).
 If possible, specify the time of origin in the label. For example, “Months from starting treatment” (see ❷ in Fig. 1).
 The numbers of patients at risk at various time points should be included at the bottom of the plot along the horizontal
axis (see ❸ in Fig. 1).
Summary
statistics
 Include the number of events out of the total number of patients at risk at the time of origin for each group, which are
represented by a curve in the plot (see ❹ in Fig. 1).
 The median survival time and survival probability at a clinically meaningful time point for each group could be included
(see ❺ in Fig. 1).
 If there is interest in illustrating the survival probabilities at multiple time points, this information can be included in a
separate table to avoid overcrowding the plot (see ❻ in Fig. 1).
Others  It is good practice to consider truncating the plot when the number of at risk is small, unless all patients are followed up
until the end of the protocol-specified follow-up duration (see ❼ in Fig. 1).
 Censored observations could be indicated in the plot with a special symbol (see ❽ in Fig. 1).
 Be judicious with including p values in the plot. If reporting results from a randomized trial comparing survival between
treatment arms using the log-rank test, it is okay to include the log-rank p value in the plot. If the survival comparison is
based on other tests such as comparison of the survival probabilities at a fixed time point, or a comparison based on the
Cox model adjusting for other covariates (as often is the case with observational studies), clearly state the statistical
test used to obtain the p value; or better yet, do not include a p value in the plot. If a p value is included, denote
whether it is one-sided or two-sided (see ❾ in Fig. 1).
1724 Ou et al Journal of Thoracic Oncology Vol. 15 No. 11
censoring indicator reversed.17
This method provides a
more appropriate estimate of the median follow-up time
than the crude median follow-up time of survivors.
Additional guidelines on time-to-event analysis will be
discussed in another manuscript in this special series.
Prognostic and Predictive Biomarkers in Oncology
Studies. In studies that evaluate treatment impact, the
goals may include discovering prognostic or predictive
biomarkers. Prognostic biomarkers identify patients who
have better outcomes regardless of treatment, whereas
predictive biomarkers identify patients who benefit from
treatment (versus those who do not). Illustrating that
there is a statistically significant association between the
biomarker and the outcome is sufficient to declare a
biomarker as prognostic. In contrast, to declare a
biomarker as predictive, it must be illustrated that the
biomarker status and treatment interaction term is
statistically significant.18,19
Because the interaction be-
tween the biomarker status and treatment is required
for modeling, a single-arm trial or a trial with biomarker-
selected patients is inappropriate for the evaluation of
predictive biomarkers.
In the Conclusion Section and the Interpretation
of Statistical Results
p Value Greater Than 0.05 Does Not Mean Equiv-
alence. Care must be taken to ensure that conclusions
are supported by the results of the study. If a p value is
not statistically significant, it can only be concluded that
no difference between the groups was observed. A non-
statistically significant p value does not support the
conclusion that the two groups are similar; this can only
be concluded if the study were designed to evaluate
equivalence (please refer to the article on clinical versus
statistical significance in this special series).20
Event/Total Median
(95% CI)a
Survival EsƟmates
(95% CI)a
Group
Group A 155/200 2.2 (1.9–2.6) 2 years: 55.0 (48.3–62.6%)
4 years: 25.7 (19.7–33.5%)
Group B 118/200 3.3 (2.5–4.5) 2 years: 59.3 (52.5–67.0%)
4 years: 42.2 (35.0–51.0%)
❺
❽
❾
Figure 1. A Kaplan-Meier plot of OS for two groups of patients. Refer to Table 1 for details about ❶ to ❾. A SAS macro is
available to generate the Kaplan-Meier plot revealed (please refer to https://communities.sas.com/t5/SAS-Communities-
Library/Kaplan-Meier-Survival-Plotting-Macro-NEWSURV/ta-p/479747). a
Kaplan-Meier method. CI, confidence interval; KM,
Kaplan-Meier; OS, overall survival.
November 2020 Guidelines for Statistical Reporting 1725
Observational Study: Discuss Potential Bias and Un-
measured Confounder. Care is needed when making
conclusions from observational studies. A single obser-
vational study is not sufficient to establish causation or
to state that a variable impacts (influences) the outcome
when the p value for the association is statistically sig-
nificant. The p value only measures the likelihood that
the differences are because of chance, assuming that the
groups are the same on all other factors. If there are
imbalances between the groups owing to biases and
unmeasured confounders, this could impact the p value;
for example, the p value may be statistically significant
because of differences between the groups that are
associated with the potential confounders, even though
the group itself is not associated with the outcome.
Hence, for observational study designs, an observed as-
sociation or difference between groups that are statisti-
cally significant could reflect the following: (1) a true
difference or association, (2) underlying biases and un-
measured confounding, or (3) a combination of (1) and
(2). The study conclusions need to properly reflect this.
Conclusions
In this manuscript, we provide guidelines for authors
to consider when reporting statistical results in medical
manuscripts. These guidelines are not exhaustive, but
they cover many common outcomes and statistical
methods used in clinical studies. We strongly encourage
authors who submit manuscripts to the Journal of
Thoracic Oncology to use these guidelines to improve the
clarity of their reported methods and results.
Acknowledgments
This work was partially supported by the National In-
stitutes of Health grant P30CA15083 (Mayo Compre-
hensive Cancer Center grant) and U10CA180882
(Alliance for Clinical Trials in Oncology Statistics and
Data Management grant).
References
1. Journal of Clinical Oncology. Manuscript guidelines.
https://ascopubs.org/jco/authors/manuscript-guidelines.
Accessed April 10, 2020.
2. Annals of Internal Medicine. Information for authors:
general statistical guidance. https://www.acpjournals.
org/journal/aim/authors/statistical-guidance. Accessed
April 10, 2020.
3. JAMA Network. Statistical methods and data presenta-
tion. https://jamanetwork.com/journals/jama/pages/
instructions-for-authors#SecStatisticalMethodsandData
Presentation. Accessed April 10, 2020.
4. The New England Journal of Medicine. New manuscripts.
https://www.nejm.org/author-center/new-manuscripts.
Accessed April 10, 2020.
5. Schulz KF, Altman DG, Moher D, CONSORT Group.
CONSORT 2010 statement: updated guidelines for
reporting parallel group randomised trials. Trials.
2010;11:32.
6. von Elm E, Altman DG, Egger M, et al. The Strengthening
the Reporting of Observational Studies in Epidemiology
(STROBE) statement: guidelines for reporting observa-
tional studies. Lancet. 2007;370:1453–1457.
7. Cohen JF, Korevaar DA, Altman DG, et al. STARD 2015
guidelines for reporting diagnostic accuracy studies:
explanation and elaboration. BMJ Open. 2016;6:
e012799.
8. Moher D, Liberati A, Tetzlaff J, Altman DG, PRISMA
Group. Preferred reporting items for systematic reviews
and meta-analyses: the PRISMA statement. Ann Intern
Med. 2009;151:264–269. W64.
9. EQUATOR Network. https://www.equator-network.org/.
Accessed July 30, 2020.
10. International Committee of Medical Journal Editors.
Preparing a manuscript for Submission to a medical
journal. http://www.icmje.org/recommendations/browse/
manuscript-preparation/preparing-for-submission.html.
Accessed April 10, 2020.
11. Greenland S, Senn SJ, Rothman KJ, et al. Statistical
tests, p values, confidence intervals, and power: a guide
to misinterpretations. Eur J Epidemiol. 2016;31:337–
350.
12. NIH, National Cancer Institute. NCI dictionary: p-value.
https://www.cancer.gov/publications/dictionaries/cancer-
terms/def/p-value. April 15, 2020.
13. Fadista J, Manning AK, Florez JC, Groop L. The (in)
famous GWAS P-value threshold revisited and
updated for low-frequency variants. Eur J Hum Genet.
2016;24:1202–1205.
14. Wasserstein RL, Lazar NA. The ASA statement on p-
values: context, process, and purpose. Am Stat.
2016;70:129–133.
15. Cuzick J. Forest plots and the interpretation of sub-
groups. Lancet. 2005;365:1308.
16. Kaplan EL, Meier P. Nonparametric estimation from
incomplete observations. J Am Stat Assoc. 1958;53:
457–481.
17. Schemper M, Smith TL. A note on quantifying follow-up
in studies of failure time. Control Clin Trials.
1996;17:343–346.
18. Ballman KV. Biomarker: predictive or prognostic? J Clin
Oncol. 2015;33:3968–3971.
19. Renfro LA, Mallick H, An MW, Sargent DJ, Mandrekar SJ.
Clinical trial designs incorporating predictive bio-
markers. Cancer Treat Rev. 2016;43:74–82.
20. Dahlberg SE, Korn EL, Le-Rademacher J, Mandrekar SJ.
Clinical versus statistical significance in studies of
thoracic malignancies. J Thorac Oncol. 2020;15:
1406–1408.
1726 Ou et al Journal of Thoracic Oncology Vol. 15 No. 11

More Related Content

What's hot

2018 ASH guidelines for management of venous thromboembolism prophylaxis fo...
2018 ASH guidelines for management of venous thromboembolism   prophylaxis fo...2018 ASH guidelines for management of venous thromboembolism   prophylaxis fo...
2018 ASH guidelines for management of venous thromboembolism prophylaxis fo...Vinh Pham Nguyen
 
SAJOG PUBLICATION 2015 - K N Lohlun
SAJOG PUBLICATION 2015 - K N LohlunSAJOG PUBLICATION 2015 - K N Lohlun
SAJOG PUBLICATION 2015 - K N LohlunKim Lohlun
 
Clinical research ( Medical stat. concepts)
Clinical research ( Medical stat. concepts)Clinical research ( Medical stat. concepts)
Clinical research ( Medical stat. concepts)Mohamed Fahmy Dehim
 
Critical appraisal of randomized clinical trials
Critical appraisal of randomized clinical trialsCritical appraisal of randomized clinical trials
Critical appraisal of randomized clinical trialsSamir Haffar
 
Moving toward comprehensive
Moving toward comprehensiveMoving toward comprehensive
Moving toward comprehensivedrucsamal
 
Surrogate endpoints: a regulatory review
Surrogate endpoints: a regulatory reviewSurrogate endpoints: a regulatory review
Surrogate endpoints: a regulatory reviewTim Felgate
 
How to write your synopsis
How to write your synopsisHow to write your synopsis
How to write your synopsisDr-Maryam Khan
 
An overview of clinical research the lay of the land
An overview of clinical research   the lay of the  landAn overview of clinical research   the lay of the  land
An overview of clinical research the lay of the landEfrain Ariel Romero Zepeda
 
unmatched case control studies
unmatched case control studiesunmatched case control studies
unmatched case control studiesMrinmoy Bharadwaz
 
How to display your data
How to display your dataHow to display your data
How to display your dataSamir Haffar
 
Outpatient management of fever and neutropenia in adults treated for malignan...
Outpatient management of fever and neutropenia in adults treated for malignan...Outpatient management of fever and neutropenia in adults treated for malignan...
Outpatient management of fever and neutropenia in adults treated for malignan...marcela maria morinigo kober
 
dual antiplatelet in stroke meta analysis
dual antiplatelet in stroke meta analysisdual antiplatelet in stroke meta analysis
dual antiplatelet in stroke meta analysisGovind Madhaw
 
Measurement of outcomes in epidemiology
Measurement of outcomes in epidemiologyMeasurement of outcomes in epidemiology
Measurement of outcomes in epidemiologyDr. Ankit Gaur
 

What's hot (20)

2018 ASH guidelines for management of venous thromboembolism prophylaxis fo...
2018 ASH guidelines for management of venous thromboembolism   prophylaxis fo...2018 ASH guidelines for management of venous thromboembolism   prophylaxis fo...
2018 ASH guidelines for management of venous thromboembolism prophylaxis fo...
 
SAJOG PUBLICATION 2015 - K N Lohlun
SAJOG PUBLICATION 2015 - K N LohlunSAJOG PUBLICATION 2015 - K N Lohlun
SAJOG PUBLICATION 2015 - K N Lohlun
 
Zoellner_AnnofHem
Zoellner_AnnofHemZoellner_AnnofHem
Zoellner_AnnofHem
 
AE poster
AE posterAE poster
AE poster
 
Clinical research ( Medical stat. concepts)
Clinical research ( Medical stat. concepts)Clinical research ( Medical stat. concepts)
Clinical research ( Medical stat. concepts)
 
Nódulos pulmonares
Nódulos pulmonares Nódulos pulmonares
Nódulos pulmonares
 
Spn chest 2003
Spn chest 2003Spn chest 2003
Spn chest 2003
 
Critical appraisal of randomized clinical trials
Critical appraisal of randomized clinical trialsCritical appraisal of randomized clinical trials
Critical appraisal of randomized clinical trials
 
Moving toward comprehensive
Moving toward comprehensiveMoving toward comprehensive
Moving toward comprehensive
 
Epcm l18-19 assessing tests
Epcm  l18-19 assessing testsEpcm  l18-19 assessing tests
Epcm l18-19 assessing tests
 
Surrogate endpoints: a regulatory review
Surrogate endpoints: a regulatory reviewSurrogate endpoints: a regulatory review
Surrogate endpoints: a regulatory review
 
How to write your synopsis
How to write your synopsisHow to write your synopsis
How to write your synopsis
 
An overview of clinical research the lay of the land
An overview of clinical research   the lay of the  landAn overview of clinical research   the lay of the  land
An overview of clinical research the lay of the land
 
Infective endocarditis
Infective endocarditisInfective endocarditis
Infective endocarditis
 
unmatched case control studies
unmatched case control studiesunmatched case control studies
unmatched case control studies
 
How to display your data
How to display your dataHow to display your data
How to display your data
 
Outpatient management of fever and neutropenia in adults treated for malignan...
Outpatient management of fever and neutropenia in adults treated for malignan...Outpatient management of fever and neutropenia in adults treated for malignan...
Outpatient management of fever and neutropenia in adults treated for malignan...
 
dual antiplatelet in stroke meta analysis
dual antiplatelet in stroke meta analysisdual antiplatelet in stroke meta analysis
dual antiplatelet in stroke meta analysis
 
Measurement of outcomes in epidemiology
Measurement of outcomes in epidemiologyMeasurement of outcomes in epidemiology
Measurement of outcomes in epidemiology
 
basics of research
 basics of research basics of research
basics of research
 

Similar to STATISTICAL REPORTING GUIDELINES FOR MEDICAL JOURNALS

A gentle introduction to meta-analysis
A gentle introduction to meta-analysisA gentle introduction to meta-analysis
A gentle introduction to meta-analysisAngelo Tinazzi
 
improving the utilization and presentation of p values
improving the utilization and presentation of p valuesimproving the utilization and presentation of p values
improving the utilization and presentation of p valuesRamachandra Barik
 
Choosing statistical tests
Choosing statistical testsChoosing statistical tests
Choosing statistical testsAkiode Noah
 
Biostatistics clinical research & trials
Biostatistics clinical research & trialsBiostatistics clinical research & trials
Biostatistics clinical research & trialseclinicaltools
 
Consort 2010 explanation and elaboration (bmj)
Consort 2010 explanation and elaboration (bmj)Consort 2010 explanation and elaboration (bmj)
Consort 2010 explanation and elaboration (bmj)Luis Bravo(Marketing)
 
· Reflect on the four peer-reviewed articles you critically apprai.docx
· Reflect on the four peer-reviewed articles you critically apprai.docx· Reflect on the four peer-reviewed articles you critically apprai.docx
· Reflect on the four peer-reviewed articles you critically apprai.docxVannaJoy20
 
Advice On Statistical Analysis For Circulation Research
Advice On Statistical Analysis For Circulation ResearchAdvice On Statistical Analysis For Circulation Research
Advice On Statistical Analysis For Circulation ResearchNancy Ideker
 
Computer Decision Support Systems and Electronic Health Records: Am J Pub Hea...
Computer Decision Support Systems and Electronic Health Records: Am J Pub Hea...Computer Decision Support Systems and Electronic Health Records: Am J Pub Hea...
Computer Decision Support Systems and Electronic Health Records: Am J Pub Hea...Lorenzo Moja
 
Lemeshow samplesize
Lemeshow samplesizeLemeshow samplesize
Lemeshow samplesize1joanenab
 
BIOSTATISTICS FUNDAMENTALS FOR BIOTECHNOLOGY
BIOSTATISTICS FUNDAMENTALS FOR BIOTECHNOLOGYBIOSTATISTICS FUNDAMENTALS FOR BIOTECHNOLOGY
BIOSTATISTICS FUNDAMENTALS FOR BIOTECHNOLOGYGauravBoruah
 
Clinical application of statistical analysis
Clinical application of statistical analysisClinical application of statistical analysis
Clinical application of statistical analysisUmair hanif
 
Deciphering the dilemma of parametric and nonparametric tests
Deciphering the dilemma of parametric and nonparametric testsDeciphering the dilemma of parametric and nonparametric tests
Deciphering the dilemma of parametric and nonparametric testsRamachandra Barik
 
statistics in pharmaceutical sciences
statistics in pharmaceutical sciencesstatistics in pharmaceutical sciences
statistics in pharmaceutical sciencesTechmasi
 
Patient-Reported Outcomes in Cancer Care - Zeena Nackerdien
Patient-Reported Outcomes in Cancer Care - Zeena NackerdienPatient-Reported Outcomes in Cancer Care - Zeena Nackerdien
Patient-Reported Outcomes in Cancer Care - Zeena NackerdienZeena Nackerdien
 
NES Pharmacy, Critical Appraisal 2011
NES Pharmacy, Critical Appraisal 2011NES Pharmacy, Critical Appraisal 2011
NES Pharmacy, Critical Appraisal 2011NES
 
introductoin to Biostatistics ( 1st and 2nd lec ).ppt
introductoin to Biostatistics ( 1st and 2nd lec ).pptintroductoin to Biostatistics ( 1st and 2nd lec ).ppt
introductoin to Biostatistics ( 1st and 2nd lec ).pptDr.Venkata Suresh Ponnuru
 
Effective strategies to monitor clinical risks using biostatistics - Pubrica....
Effective strategies to monitor clinical risks using biostatistics - Pubrica....Effective strategies to monitor clinical risks using biostatistics - Pubrica....
Effective strategies to monitor clinical risks using biostatistics - Pubrica....Pubrica
 
48  january 2  vol 27 no 18  2013  © NURSING STANDARD RC.docx
48  january 2  vol 27 no 18  2013  © NURSING STANDARD  RC.docx48  january 2  vol 27 no 18  2013  © NURSING STANDARD  RC.docx
48  january 2  vol 27 no 18  2013  © NURSING STANDARD RC.docxblondellchancy
 
Effective strategies to monitor clinical risks using biostatistics - Pubrica.pdf
Effective strategies to monitor clinical risks using biostatistics - Pubrica.pdfEffective strategies to monitor clinical risks using biostatistics - Pubrica.pdf
Effective strategies to monitor clinical risks using biostatistics - Pubrica.pdfPubrica
 

Similar to STATISTICAL REPORTING GUIDELINES FOR MEDICAL JOURNALS (20)

A gentle introduction to meta-analysis
A gentle introduction to meta-analysisA gentle introduction to meta-analysis
A gentle introduction to meta-analysis
 
improving the utilization and presentation of p values
improving the utilization and presentation of p valuesimproving the utilization and presentation of p values
improving the utilization and presentation of p values
 
Choosing statistical tests
Choosing statistical testsChoosing statistical tests
Choosing statistical tests
 
Biostatistics clinical research & trials
Biostatistics clinical research & trialsBiostatistics clinical research & trials
Biostatistics clinical research & trials
 
Amsterdam 2008
Amsterdam 2008Amsterdam 2008
Amsterdam 2008
 
Consort 2010 explanation and elaboration (bmj)
Consort 2010 explanation and elaboration (bmj)Consort 2010 explanation and elaboration (bmj)
Consort 2010 explanation and elaboration (bmj)
 
· Reflect on the four peer-reviewed articles you critically apprai.docx
· Reflect on the four peer-reviewed articles you critically apprai.docx· Reflect on the four peer-reviewed articles you critically apprai.docx
· Reflect on the four peer-reviewed articles you critically apprai.docx
 
Advice On Statistical Analysis For Circulation Research
Advice On Statistical Analysis For Circulation ResearchAdvice On Statistical Analysis For Circulation Research
Advice On Statistical Analysis For Circulation Research
 
Computer Decision Support Systems and Electronic Health Records: Am J Pub Hea...
Computer Decision Support Systems and Electronic Health Records: Am J Pub Hea...Computer Decision Support Systems and Electronic Health Records: Am J Pub Hea...
Computer Decision Support Systems and Electronic Health Records: Am J Pub Hea...
 
Lemeshow samplesize
Lemeshow samplesizeLemeshow samplesize
Lemeshow samplesize
 
BIOSTATISTICS FUNDAMENTALS FOR BIOTECHNOLOGY
BIOSTATISTICS FUNDAMENTALS FOR BIOTECHNOLOGYBIOSTATISTICS FUNDAMENTALS FOR BIOTECHNOLOGY
BIOSTATISTICS FUNDAMENTALS FOR BIOTECHNOLOGY
 
Clinical application of statistical analysis
Clinical application of statistical analysisClinical application of statistical analysis
Clinical application of statistical analysis
 
Deciphering the dilemma of parametric and nonparametric tests
Deciphering the dilemma of parametric and nonparametric testsDeciphering the dilemma of parametric and nonparametric tests
Deciphering the dilemma of parametric and nonparametric tests
 
statistics in pharmaceutical sciences
statistics in pharmaceutical sciencesstatistics in pharmaceutical sciences
statistics in pharmaceutical sciences
 
Patient-Reported Outcomes in Cancer Care - Zeena Nackerdien
Patient-Reported Outcomes in Cancer Care - Zeena NackerdienPatient-Reported Outcomes in Cancer Care - Zeena Nackerdien
Patient-Reported Outcomes in Cancer Care - Zeena Nackerdien
 
NES Pharmacy, Critical Appraisal 2011
NES Pharmacy, Critical Appraisal 2011NES Pharmacy, Critical Appraisal 2011
NES Pharmacy, Critical Appraisal 2011
 
introductoin to Biostatistics ( 1st and 2nd lec ).ppt
introductoin to Biostatistics ( 1st and 2nd lec ).pptintroductoin to Biostatistics ( 1st and 2nd lec ).ppt
introductoin to Biostatistics ( 1st and 2nd lec ).ppt
 
Effective strategies to monitor clinical risks using biostatistics - Pubrica....
Effective strategies to monitor clinical risks using biostatistics - Pubrica....Effective strategies to monitor clinical risks using biostatistics - Pubrica....
Effective strategies to monitor clinical risks using biostatistics - Pubrica....
 
48  january 2  vol 27 no 18  2013  © NURSING STANDARD RC.docx
48  january 2  vol 27 no 18  2013  © NURSING STANDARD  RC.docx48  january 2  vol 27 no 18  2013  © NURSING STANDARD  RC.docx
48  january 2  vol 27 no 18  2013  © NURSING STANDARD RC.docx
 
Effective strategies to monitor clinical risks using biostatistics - Pubrica.pdf
Effective strategies to monitor clinical risks using biostatistics - Pubrica.pdfEffective strategies to monitor clinical risks using biostatistics - Pubrica.pdf
Effective strategies to monitor clinical risks using biostatistics - Pubrica.pdf
 

More from Ramachandra Barik

Intensive care of congenital heart disease.pptx
Intensive care of congenital heart disease.pptxIntensive care of congenital heart disease.pptx
Intensive care of congenital heart disease.pptxRamachandra Barik
 
Management of Hypetension.pptx
Management of Hypetension.pptxManagement of Hypetension.pptx
Management of Hypetension.pptxRamachandra Barik
 
CRISPR and cardiovascular diseases.pdf
CRISPR and cardiovascular diseases.pdfCRISPR and cardiovascular diseases.pdf
CRISPR and cardiovascular diseases.pdfRamachandra Barik
 
Pacemaker Pocket Infection After Splenectomy
Pacemaker Pocket Infection After SplenectomyPacemaker Pocket Infection After Splenectomy
Pacemaker Pocket Infection After SplenectomyRamachandra Barik
 
A Case of Device Closure of an Eccentric Atrial Septal Defect Using a Large D...
A Case of Device Closure of an Eccentric Atrial Septal Defect Using a Large D...A Case of Device Closure of an Eccentric Atrial Septal Defect Using a Large D...
A Case of Device Closure of an Eccentric Atrial Septal Defect Using a Large D...Ramachandra Barik
 
Trio of Rheumatic Mitral Stenosis, Right Posterior Septal Accessory Pathway a...
Trio of Rheumatic Mitral Stenosis, Right Posterior Septal Accessory Pathway a...Trio of Rheumatic Mitral Stenosis, Right Posterior Septal Accessory Pathway a...
Trio of Rheumatic Mitral Stenosis, Right Posterior Septal Accessory Pathway a...Ramachandra Barik
 
Anticoagulation therapy during pregnancy
Anticoagulation therapy during pregnancyAnticoagulation therapy during pregnancy
Anticoagulation therapy during pregnancyRamachandra Barik
 
Intracoronary optical coherence tomography
Intracoronary optical coherence tomographyIntracoronary optical coherence tomography
Intracoronary optical coherence tomographyRamachandra Barik
 
A roadmap for the human development
A roadmap for the human developmentA roadmap for the human development
A roadmap for the human developmentRamachandra Barik
 
Left ventricular false tendons
Left ventricular false tendonsLeft ventricular false tendons
Left ventricular false tendonsRamachandra Barik
 

More from Ramachandra Barik (20)

Willens's syndrome.pptx
Willens's syndrome.pptxWillens's syndrome.pptx
Willens's syndrome.pptx
 
Intensive care of congenital heart disease.pptx
Intensive care of congenital heart disease.pptxIntensive care of congenital heart disease.pptx
Intensive care of congenital heart disease.pptx
 
Management of Hypetension.pptx
Management of Hypetension.pptxManagement of Hypetension.pptx
Management of Hypetension.pptx
 
CRISPR and cardiovascular diseases.pdf
CRISPR and cardiovascular diseases.pdfCRISPR and cardiovascular diseases.pdf
CRISPR and cardiovascular diseases.pdf
 
Pacemaker Pocket Infection After Splenectomy
Pacemaker Pocket Infection After SplenectomyPacemaker Pocket Infection After Splenectomy
Pacemaker Pocket Infection After Splenectomy
 
Piccolo Duct Occluder.pdf
Piccolo Duct Occluder.pdfPiccolo Duct Occluder.pdf
Piccolo Duct Occluder.pdf
 
MISPLACED ECG LEADS.pptx
MISPLACED ECG LEADS.pptxMISPLACED ECG LEADS.pptx
MISPLACED ECG LEADS.pptx
 
A Case of Device Closure of an Eccentric Atrial Septal Defect Using a Large D...
A Case of Device Closure of an Eccentric Atrial Septal Defect Using a Large D...A Case of Device Closure of an Eccentric Atrial Septal Defect Using a Large D...
A Case of Device Closure of an Eccentric Atrial Septal Defect Using a Large D...
 
Arrythmia-IV.pptx
Arrythmia-IV.pptxArrythmia-IV.pptx
Arrythmia-IV.pptx
 
Arrythmia-III.pptx
Arrythmia-III.pptxArrythmia-III.pptx
Arrythmia-III.pptx
 
Arrythmia-II.pptx
Arrythmia-II.pptxArrythmia-II.pptx
Arrythmia-II.pptx
 
Arrythmia-I.pptx
Arrythmia-I.pptxArrythmia-I.pptx
Arrythmia-I.pptx
 
Trio of Rheumatic Mitral Stenosis, Right Posterior Septal Accessory Pathway a...
Trio of Rheumatic Mitral Stenosis, Right Posterior Septal Accessory Pathway a...Trio of Rheumatic Mitral Stenosis, Right Posterior Septal Accessory Pathway a...
Trio of Rheumatic Mitral Stenosis, Right Posterior Septal Accessory Pathway a...
 
Anticoagulation therapy during pregnancy
Anticoagulation therapy during pregnancyAnticoagulation therapy during pregnancy
Anticoagulation therapy during pregnancy
 
Coronary guidewire
Coronary guidewireCoronary guidewire
Coronary guidewire
 
Intracoronary optical coherence tomography
Intracoronary optical coherence tomographyIntracoronary optical coherence tomography
Intracoronary optical coherence tomography
 
Brugada syndrome
Brugada syndromeBrugada syndrome
Brugada syndrome
 
A roadmap for the human development
A roadmap for the human developmentA roadmap for the human development
A roadmap for the human development
 
Intra aortic balloon pump
Intra aortic balloon pumpIntra aortic balloon pump
Intra aortic balloon pump
 
Left ventricular false tendons
Left ventricular false tendonsLeft ventricular false tendons
Left ventricular false tendons
 

Recently uploaded

VIP Mumbai Call Girls Hiranandani Gardens Just Call 9920874524 with A/C Room ...
VIP Mumbai Call Girls Hiranandani Gardens Just Call 9920874524 with A/C Room ...VIP Mumbai Call Girls Hiranandani Gardens Just Call 9920874524 with A/C Room ...
VIP Mumbai Call Girls Hiranandani Gardens Just Call 9920874524 with A/C Room ...Garima Khatri
 
Call Girls Ooty Just Call 9907093804 Top Class Call Girl Service Available
Call Girls Ooty Just Call 9907093804 Top Class Call Girl Service AvailableCall Girls Ooty Just Call 9907093804 Top Class Call Girl Service Available
Call Girls Ooty Just Call 9907093804 Top Class Call Girl Service AvailableDipal Arora
 
Book Paid Powai Call Girls Mumbai 𖠋 9930245274 𖠋Low Budget Full Independent H...
Book Paid Powai Call Girls Mumbai 𖠋 9930245274 𖠋Low Budget Full Independent H...Book Paid Powai Call Girls Mumbai 𖠋 9930245274 𖠋Low Budget Full Independent H...
Book Paid Powai Call Girls Mumbai 𖠋 9930245274 𖠋Low Budget Full Independent H...Call Girls in Nagpur High Profile
 
Call Girls Nagpur Just Call 9907093804 Top Class Call Girl Service Available
Call Girls Nagpur Just Call 9907093804 Top Class Call Girl Service AvailableCall Girls Nagpur Just Call 9907093804 Top Class Call Girl Service Available
Call Girls Nagpur Just Call 9907093804 Top Class Call Girl Service AvailableDipal Arora
 
Call Girls Bareilly Just Call 9907093804 Top Class Call Girl Service Available
Call Girls Bareilly Just Call 9907093804 Top Class Call Girl Service AvailableCall Girls Bareilly Just Call 9907093804 Top Class Call Girl Service Available
Call Girls Bareilly Just Call 9907093804 Top Class Call Girl Service AvailableDipal Arora
 
Call Girls Visakhapatnam Just Call 9907093804 Top Class Call Girl Service Ava...
Call Girls Visakhapatnam Just Call 9907093804 Top Class Call Girl Service Ava...Call Girls Visakhapatnam Just Call 9907093804 Top Class Call Girl Service Ava...
Call Girls Visakhapatnam Just Call 9907093804 Top Class Call Girl Service Ava...Dipal Arora
 
Call Girls Jabalpur Just Call 9907093804 Top Class Call Girl Service Available
Call Girls Jabalpur Just Call 9907093804 Top Class Call Girl Service AvailableCall Girls Jabalpur Just Call 9907093804 Top Class Call Girl Service Available
Call Girls Jabalpur Just Call 9907093804 Top Class Call Girl Service AvailableDipal Arora
 
Night 7k to 12k Chennai City Center Call Girls 👉👉 7427069034⭐⭐ 100% Genuine E...
Night 7k to 12k Chennai City Center Call Girls 👉👉 7427069034⭐⭐ 100% Genuine E...Night 7k to 12k Chennai City Center Call Girls 👉👉 7427069034⭐⭐ 100% Genuine E...
Night 7k to 12k Chennai City Center Call Girls 👉👉 7427069034⭐⭐ 100% Genuine E...hotbabesbook
 
Call Girls Varanasi Just Call 9907093804 Top Class Call Girl Service Available
Call Girls Varanasi Just Call 9907093804 Top Class Call Girl Service AvailableCall Girls Varanasi Just Call 9907093804 Top Class Call Girl Service Available
Call Girls Varanasi Just Call 9907093804 Top Class Call Girl Service AvailableDipal Arora
 
Top Rated Bangalore Call Girls Richmond Circle ⟟ 8250192130 ⟟ Call Me For Gen...
Top Rated Bangalore Call Girls Richmond Circle ⟟ 8250192130 ⟟ Call Me For Gen...Top Rated Bangalore Call Girls Richmond Circle ⟟ 8250192130 ⟟ Call Me For Gen...
Top Rated Bangalore Call Girls Richmond Circle ⟟ 8250192130 ⟟ Call Me For Gen...narwatsonia7
 
Call Girls Service Surat Samaira ❤️🍑 8250192130 👄 Independent Escort Service ...
Call Girls Service Surat Samaira ❤️🍑 8250192130 👄 Independent Escort Service ...Call Girls Service Surat Samaira ❤️🍑 8250192130 👄 Independent Escort Service ...
Call Girls Service Surat Samaira ❤️🍑 8250192130 👄 Independent Escort Service ...CALL GIRLS
 
Russian Escorts Girls Nehru Place ZINATHI 🔝9711199012 ☪ 24/7 Call Girls Delhi
Russian Escorts Girls  Nehru Place ZINATHI 🔝9711199012 ☪ 24/7 Call Girls DelhiRussian Escorts Girls  Nehru Place ZINATHI 🔝9711199012 ☪ 24/7 Call Girls Delhi
Russian Escorts Girls Nehru Place ZINATHI 🔝9711199012 ☪ 24/7 Call Girls DelhiAlinaDevecerski
 
Call Girls Mumbai Just Call 9907093804 Top Class Call Girl Service Available
Call Girls Mumbai Just Call 9907093804 Top Class Call Girl Service AvailableCall Girls Mumbai Just Call 9907093804 Top Class Call Girl Service Available
Call Girls Mumbai Just Call 9907093804 Top Class Call Girl Service AvailableDipal Arora
 
College Call Girls in Haridwar 9667172968 Short 4000 Night 10000 Best call gi...
College Call Girls in Haridwar 9667172968 Short 4000 Night 10000 Best call gi...College Call Girls in Haridwar 9667172968 Short 4000 Night 10000 Best call gi...
College Call Girls in Haridwar 9667172968 Short 4000 Night 10000 Best call gi...perfect solution
 
Manyata Tech Park ( Call Girls ) Bangalore ✔ 6297143586 ✔ Hot Model With Sexy...
Manyata Tech Park ( Call Girls ) Bangalore ✔ 6297143586 ✔ Hot Model With Sexy...Manyata Tech Park ( Call Girls ) Bangalore ✔ 6297143586 ✔ Hot Model With Sexy...
Manyata Tech Park ( Call Girls ) Bangalore ✔ 6297143586 ✔ Hot Model With Sexy...vidya singh
 
Call Girls Horamavu WhatsApp Number 7001035870 Meeting With Bangalore Escorts
Call Girls Horamavu WhatsApp Number 7001035870 Meeting With Bangalore EscortsCall Girls Horamavu WhatsApp Number 7001035870 Meeting With Bangalore Escorts
Call Girls Horamavu WhatsApp Number 7001035870 Meeting With Bangalore Escortsvidya singh
 
♛VVIP Hyderabad Call Girls Chintalkunta🖕7001035870🖕Riya Kappor Top Call Girl ...
♛VVIP Hyderabad Call Girls Chintalkunta🖕7001035870🖕Riya Kappor Top Call Girl ...♛VVIP Hyderabad Call Girls Chintalkunta🖕7001035870🖕Riya Kappor Top Call Girl ...
♛VVIP Hyderabad Call Girls Chintalkunta🖕7001035870🖕Riya Kappor Top Call Girl ...astropune
 
Call Girls Aurangabad Just Call 9907093804 Top Class Call Girl Service Available
Call Girls Aurangabad Just Call 9907093804 Top Class Call Girl Service AvailableCall Girls Aurangabad Just Call 9907093804 Top Class Call Girl Service Available
Call Girls Aurangabad Just Call 9907093804 Top Class Call Girl Service AvailableDipal Arora
 
VIP Service Call Girls Sindhi Colony 📳 7877925207 For 18+ VIP Call Girl At Th...
VIP Service Call Girls Sindhi Colony 📳 7877925207 For 18+ VIP Call Girl At Th...VIP Service Call Girls Sindhi Colony 📳 7877925207 For 18+ VIP Call Girl At Th...
VIP Service Call Girls Sindhi Colony 📳 7877925207 For 18+ VIP Call Girl At Th...jageshsingh5554
 
Call Girls Coimbatore Just Call 9907093804 Top Class Call Girl Service Available
Call Girls Coimbatore Just Call 9907093804 Top Class Call Girl Service AvailableCall Girls Coimbatore Just Call 9907093804 Top Class Call Girl Service Available
Call Girls Coimbatore Just Call 9907093804 Top Class Call Girl Service AvailableDipal Arora
 

Recently uploaded (20)

VIP Mumbai Call Girls Hiranandani Gardens Just Call 9920874524 with A/C Room ...
VIP Mumbai Call Girls Hiranandani Gardens Just Call 9920874524 with A/C Room ...VIP Mumbai Call Girls Hiranandani Gardens Just Call 9920874524 with A/C Room ...
VIP Mumbai Call Girls Hiranandani Gardens Just Call 9920874524 with A/C Room ...
 
Call Girls Ooty Just Call 9907093804 Top Class Call Girl Service Available
Call Girls Ooty Just Call 9907093804 Top Class Call Girl Service AvailableCall Girls Ooty Just Call 9907093804 Top Class Call Girl Service Available
Call Girls Ooty Just Call 9907093804 Top Class Call Girl Service Available
 
Book Paid Powai Call Girls Mumbai 𖠋 9930245274 𖠋Low Budget Full Independent H...
Book Paid Powai Call Girls Mumbai 𖠋 9930245274 𖠋Low Budget Full Independent H...Book Paid Powai Call Girls Mumbai 𖠋 9930245274 𖠋Low Budget Full Independent H...
Book Paid Powai Call Girls Mumbai 𖠋 9930245274 𖠋Low Budget Full Independent H...
 
Call Girls Nagpur Just Call 9907093804 Top Class Call Girl Service Available
Call Girls Nagpur Just Call 9907093804 Top Class Call Girl Service AvailableCall Girls Nagpur Just Call 9907093804 Top Class Call Girl Service Available
Call Girls Nagpur Just Call 9907093804 Top Class Call Girl Service Available
 
Call Girls Bareilly Just Call 9907093804 Top Class Call Girl Service Available
Call Girls Bareilly Just Call 9907093804 Top Class Call Girl Service AvailableCall Girls Bareilly Just Call 9907093804 Top Class Call Girl Service Available
Call Girls Bareilly Just Call 9907093804 Top Class Call Girl Service Available
 
Call Girls Visakhapatnam Just Call 9907093804 Top Class Call Girl Service Ava...
Call Girls Visakhapatnam Just Call 9907093804 Top Class Call Girl Service Ava...Call Girls Visakhapatnam Just Call 9907093804 Top Class Call Girl Service Ava...
Call Girls Visakhapatnam Just Call 9907093804 Top Class Call Girl Service Ava...
 
Call Girls Jabalpur Just Call 9907093804 Top Class Call Girl Service Available
Call Girls Jabalpur Just Call 9907093804 Top Class Call Girl Service AvailableCall Girls Jabalpur Just Call 9907093804 Top Class Call Girl Service Available
Call Girls Jabalpur Just Call 9907093804 Top Class Call Girl Service Available
 
Night 7k to 12k Chennai City Center Call Girls 👉👉 7427069034⭐⭐ 100% Genuine E...
Night 7k to 12k Chennai City Center Call Girls 👉👉 7427069034⭐⭐ 100% Genuine E...Night 7k to 12k Chennai City Center Call Girls 👉👉 7427069034⭐⭐ 100% Genuine E...
Night 7k to 12k Chennai City Center Call Girls 👉👉 7427069034⭐⭐ 100% Genuine E...
 
Call Girls Varanasi Just Call 9907093804 Top Class Call Girl Service Available
Call Girls Varanasi Just Call 9907093804 Top Class Call Girl Service AvailableCall Girls Varanasi Just Call 9907093804 Top Class Call Girl Service Available
Call Girls Varanasi Just Call 9907093804 Top Class Call Girl Service Available
 
Top Rated Bangalore Call Girls Richmond Circle ⟟ 8250192130 ⟟ Call Me For Gen...
Top Rated Bangalore Call Girls Richmond Circle ⟟ 8250192130 ⟟ Call Me For Gen...Top Rated Bangalore Call Girls Richmond Circle ⟟ 8250192130 ⟟ Call Me For Gen...
Top Rated Bangalore Call Girls Richmond Circle ⟟ 8250192130 ⟟ Call Me For Gen...
 
Call Girls Service Surat Samaira ❤️🍑 8250192130 👄 Independent Escort Service ...
Call Girls Service Surat Samaira ❤️🍑 8250192130 👄 Independent Escort Service ...Call Girls Service Surat Samaira ❤️🍑 8250192130 👄 Independent Escort Service ...
Call Girls Service Surat Samaira ❤️🍑 8250192130 👄 Independent Escort Service ...
 
Russian Escorts Girls Nehru Place ZINATHI 🔝9711199012 ☪ 24/7 Call Girls Delhi
Russian Escorts Girls  Nehru Place ZINATHI 🔝9711199012 ☪ 24/7 Call Girls DelhiRussian Escorts Girls  Nehru Place ZINATHI 🔝9711199012 ☪ 24/7 Call Girls Delhi
Russian Escorts Girls Nehru Place ZINATHI 🔝9711199012 ☪ 24/7 Call Girls Delhi
 
Call Girls Mumbai Just Call 9907093804 Top Class Call Girl Service Available
Call Girls Mumbai Just Call 9907093804 Top Class Call Girl Service AvailableCall Girls Mumbai Just Call 9907093804 Top Class Call Girl Service Available
Call Girls Mumbai Just Call 9907093804 Top Class Call Girl Service Available
 
College Call Girls in Haridwar 9667172968 Short 4000 Night 10000 Best call gi...
College Call Girls in Haridwar 9667172968 Short 4000 Night 10000 Best call gi...College Call Girls in Haridwar 9667172968 Short 4000 Night 10000 Best call gi...
College Call Girls in Haridwar 9667172968 Short 4000 Night 10000 Best call gi...
 
Manyata Tech Park ( Call Girls ) Bangalore ✔ 6297143586 ✔ Hot Model With Sexy...
Manyata Tech Park ( Call Girls ) Bangalore ✔ 6297143586 ✔ Hot Model With Sexy...Manyata Tech Park ( Call Girls ) Bangalore ✔ 6297143586 ✔ Hot Model With Sexy...
Manyata Tech Park ( Call Girls ) Bangalore ✔ 6297143586 ✔ Hot Model With Sexy...
 
Call Girls Horamavu WhatsApp Number 7001035870 Meeting With Bangalore Escorts
Call Girls Horamavu WhatsApp Number 7001035870 Meeting With Bangalore EscortsCall Girls Horamavu WhatsApp Number 7001035870 Meeting With Bangalore Escorts
Call Girls Horamavu WhatsApp Number 7001035870 Meeting With Bangalore Escorts
 
♛VVIP Hyderabad Call Girls Chintalkunta🖕7001035870🖕Riya Kappor Top Call Girl ...
♛VVIP Hyderabad Call Girls Chintalkunta🖕7001035870🖕Riya Kappor Top Call Girl ...♛VVIP Hyderabad Call Girls Chintalkunta🖕7001035870🖕Riya Kappor Top Call Girl ...
♛VVIP Hyderabad Call Girls Chintalkunta🖕7001035870🖕Riya Kappor Top Call Girl ...
 
Call Girls Aurangabad Just Call 9907093804 Top Class Call Girl Service Available
Call Girls Aurangabad Just Call 9907093804 Top Class Call Girl Service AvailableCall Girls Aurangabad Just Call 9907093804 Top Class Call Girl Service Available
Call Girls Aurangabad Just Call 9907093804 Top Class Call Girl Service Available
 
VIP Service Call Girls Sindhi Colony 📳 7877925207 For 18+ VIP Call Girl At Th...
VIP Service Call Girls Sindhi Colony 📳 7877925207 For 18+ VIP Call Girl At Th...VIP Service Call Girls Sindhi Colony 📳 7877925207 For 18+ VIP Call Girl At Th...
VIP Service Call Girls Sindhi Colony 📳 7877925207 For 18+ VIP Call Girl At Th...
 
Call Girls Coimbatore Just Call 9907093804 Top Class Call Girl Service Available
Call Girls Coimbatore Just Call 9907093804 Top Class Call Girl Service AvailableCall Girls Coimbatore Just Call 9907093804 Top Class Call Girl Service Available
Call Girls Coimbatore Just Call 9907093804 Top Class Call Girl Service Available
 

STATISTICAL REPORTING GUIDELINES FOR MEDICAL JOURNALS

  • 1. SPECIAL ARTICLE: STATISTICS IN ONCOLOGY SERIES Guidelines for Statistical Reporting in Medical Journals Fang-Shu Ou, PhD,a, * Jennifer G. Le-Rademacher, PhD,a Karla V. Ballman, PhD,b Alex A. Adjei, MD, PhD,c Sumithra J. Mandrekar, PhDa a Department of Health Sciences Research, Mayo Clinic, Rochester, Minnesota b Department of Health Care Policy and Research, Weill Cornell Medical College, Ithaca, New York c Department of Oncology, Mayo Clinic, Rochester, Minnesota Received 15 April 2020; revised 10 August 2020; accepted 14 August 2020 Available online - 25 August 2020 ABSTRACT Statistical methods are essential in medical research. They are used for data analysis and drawing appropriate con- clusions. Clarity and accuracy of statistical reporting in medical journals can enhance readers’ understanding of the research conducted and the results obtained. In this manuscript, we provide guidelines for statistical reporting in medical journals for authors to consider, with a focus on the Journal of Thoracic Oncology. Ó 2020 International Association for the Study of Lung Cancer. Published by Elsevier Inc. All rights reserved. Keywords: Statistical results; Reporting; Presenting; p value; Medical journals Introduction High-quality reporting of statistical methods and results is essential for reviewers and readers to evaluate the quality and credibility of evidence presented in a manuscript. To help authors adhere to best practices, many journals1-4 now provide detailed guidelines. Specific guidelines are also available, such as the CONSORT statement5 for randomized clinical trials, the Strengthening the Reporting of Observational Studies in Epidemiology statement6 for observational studies, the STARD initiative7 for diagnostic accuracy studies, and Preferred Reporting Items for Systematic Reviews and Meta-Analyses statement for meta-analyses8 (see the Enhancing the Quality and Transparency of Health Research Network9 for a comprehensive listing of study type–specific reporting guidelines). These guide- lines aim to improve the clarity of presented methods and results and standardize statistical reporting to enhance comparability with similar research. Here, we present guidelines for authors to consider when drafting manuscripts for the Journal of Thoracic Oncology. Guidelines on Statistical Reporting In the Methods Section The principle of writing the methods section is that it should “describe statistical methods with enough detail to enable a knowledgeable reader with access to the original data to judge its appropriateness for the study and to verify the reported results.”10 To achieve this goal, the statistical design of the study should be described, including the objectives of the study and patient population or patient selection. Clin- ical trial design parameters, such as type I error (including the choice of a one-sided or two-sided test), study power, primary end point, effect size, and assumed accrual rate, are needed for readers to judge the validity of the sample size and the number of events required. Additional details on the randomization scheme, planned interim analyses, primary end point, and analysis method (including population definitions) are also necessary. For an observational study, one should mention whether the study is designed for hypothesis testing or hypothesis generation. Good practice dictates that the statistical analysis plan should be determined before conducting the analysis. This plan should include *Corresponding author. Disclosure: The authors declare no conflict of interest. Address for correspondence: Fang-Shu Ou, PhD, Department of Health Sciences Research, Mayo Clinic, 200 First Street SW, Rochester, MN 55905. E-mail: ou.fang-shu@mayo.edu ª 2020 International Association for the Study of Lung Cancer. Published by Elsevier Inc. All rights reserved. ISSN: 1556-0864 https://doi.org/10.1016/j.jtho.2020.08.019 Journal of Thoracic Oncology Vol. 15 No. 11: 1722–6
  • 2. the level of significance that will be used in the study, which means the threshold below which a p value would indicate statistical significance. In addition, the plan should specify whether there will be p value adjustment for multiple comparisons and the rationale for the decision. The method(s) for handling missing data should also be specified. If a data-driven variable selection was conducted, the methods employed should be described and accompanied by sufficient details of the steps taken in the process (e.g., variables initially used in the variable selection process, the threshold p value in a stepwise selection, or tuning parameter selection in a machine learning method). For Bayesian analyses or more com- plex statistical analyses, sufficient details should be provided in an appendix so that interested readers can fully understand the methods used for the study. Finally, the analysis software and version should be included because they may use different optimization and numerical routines, which produce slightly different results. For a clinical trial, the clinical trial number should be listed accompanied by the trial protocol, if required by the journal. In the Results Section Patient Characteristics Table. The first table in the results section usually summarizes the baseline charac- teristics of the study population. If there is only one group of patients in the study, this table only has a single column of summarized data. However, if the main objective is to compare across identified groups, each group should have its own column. Baseline variables measured on each patient are listed as rows. This table should include all key baseline variables that define the study population in terms of demographics, comorbid- ities and history, and disease characteristics along with prognostic variables associated with the primary outcome. Continuous variables should be summarized with mean and SD. If the distribution of value is skewed, it is recommended that the median and range (minimum and maximum values) or the interquartile range (lower quartile and upper quartile values) should be included. Categorical values should be reported as the count and percentages for each level of the variable. If there are missing observations, the number of patients with missing data should be recorded for both continuous and categorical variables. When the number of missing values is negligible, then the percentage of missing category do not need to be calculated, and the denomi- nator for percentage calculations should not include missing values. If patients were randomized to the groups being compared, the p value should not be included in the patient characteristics table for the comparison across groups because any differences observed between the groups is random. However, if the study is an observa- tional study, a p value comparing the value of a specific variable across the groups (using an appropriate statis- tical test) should be included for each variable in the table. For data that are for a subset of randomized pa- tients, such as quality of life or biomarker substudies that contain only patients who consented to the sub- study, the randomization no longer holds, and it cannot be assumed that differences between the groups are because of chance. If the subset contains less than 90% of the originally randomized patients, it is recommended that p values be provided in the patient characteristic table. p Value. The p value is the probability of obtaining a result at least as extreme as what was observed when the null hypothesis is true.11 A small p value usually means that the difference found in a study is unlikely because of chance alone.12 When results are reported, the magnitude of the difference between groups should be reported along with the p value. Differences between groups should be estimated with a point estimate (e.g., absolute differences in means or proportions, ORs, or hazard ratios, whichever is the most appropriate for the outcomes) and confidence interval (CI). The precise p value should be reported rather than stating that it is less than the level of significance or that it is not sig- nificant. Generally, it is acceptable to report p values to two decimal places (round to the nearest 100th) when greater than 0.01; three decimal places (round to the nearest 1000th) when less than 0.01. If a p value is quite small, then it is acceptable to report it as a p value less than 0.001. The p values arising from genome-wide as- sociation studies or other high-dimensional data ana- lyses should follow guidelines specific for those methods.13 Two-sided p values should be reported except when study designs explicitly assume a one-sided p value. Recently, the American Statistical Association14 and other groups of the scientific community called for less emphasis on p values. As a result, we recommend reporting p values only when proper type I error con- trols are in place and strongly discourage p values for secondary and subgroup analyses in which point esti- mates and CIs are preferred. Finally, if there is a pre- specified level of significance, a result is either statistically significant or not. The word trend should only be used in a statistical test for trends in the data and not to describe a p value that is close to the prespecified level of significance. Reporting of Categorical Outcomes. Categorical out- comes such as response to treatment and occurrence of adverse events are common in clinical studies. November 2020 Guidelines for Statistical Reporting 1723
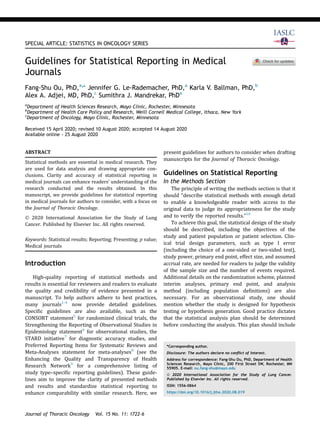
  • 3. Categorical outcomes are summarized by frequencies and percentages. CIs should be reported along with the point estimates. It is important to clearly state the de- nominator used for estimation. When the denominator is the same for all categorical outcomes being reported, it is sufficient to state the denominator once and clarify that it is used for all subsequent outcomes; otherwise, it is important to specify the denominator used in computing the estimate for each outcome. When reporting com- parisons of categorical outcomes among groups of pa- tients, specify the statistical test used—for example, the chi-square test, Fisher’s exact test, or the Z-test with or without continuity correction. It is good practice to include the same number of decimal places for all percentages. We recommend reporting the percentage with one decimal place (e.g., 12.3%) when the denomi- nator is larger than 200.2 Forest Plots Are a Good Way to Present Subgroup Analysis. Forest plot is a common graphical method of illustrating treatment effects across all subgroups of in- terest at one glance.15 It is meant as a visual aid rather than an inferential tool. An informative forest plot should include point estimates, CIs, and the sample sizes (including the number of events when applicable) for each subgroup so the readers can judge the precision of the estimated effects. Including subgroup p values in forest plots are strongly discouraged when trials are not powered to detect the treatment effect in subgroups. If hypothesis tests for specific subgroups are prespecified, the trial design should be appropriately powered and should account for the number of hypothesis tests considered in the trial. Another strongly discouraged practice is to include p values for interaction tests in forest plots for subgroup analysis.4 It is important to distinguish between sub- group analyses and interaction tests. An interaction test is a formal statistical test to evaluate whether the treatment effect is influenced by other patient charac- teristics (factor of interest). The test is conducted by a regression model that includes the treatment, the factor of interest, and an interaction term between the two variables using the full patient set. This is in contrast with subgroup analysis in which the treatment effect is evaluated separately for each subgroup of patients, one at a time, making it impossible to formally compare the treatment effects among subgroups of patients. Survival Analysis. Overall survival (OS) is a common outcome used in clinical studies to judge the effective- ness of a new treatment or the prognostic effect of a baseline factor. OS data consist of two components that need to be clearly defined. The first component is the time interval starting from the time of origin (the time from which OS is being measured) to the time of death or of the last follow-up. The second component is an indi- cator of whether the patient died or was alive at that last time point. OS data can be summarized in multiple ways. Kaplan-Meier curves16 are the most common visual summary for survival data, and Table 1 includes some suggestions to consider when plotting Kaplan-Meier curves with an example in Figure 1. Another quantity that is often reported with survival data is the median time that patients were followed in the study. The me- dian follow-up time should be estimated using the Kaplan-Meier estimator with the event, and the Table 1. Good Practices to Consider When Plotting Kaplan-Meier Curves Domain Recommendations Horizontal axis The horizontal axis should be labeled with the time unit corresponding to the tick marks along the axis (see ❶ in Fig. 1). If possible, specify the time of origin in the label. For example, “Months from starting treatment” (see ❷ in Fig. 1). The numbers of patients at risk at various time points should be included at the bottom of the plot along the horizontal axis (see ❸ in Fig. 1). Summary statistics Include the number of events out of the total number of patients at risk at the time of origin for each group, which are represented by a curve in the plot (see ❹ in Fig. 1). The median survival time and survival probability at a clinically meaningful time point for each group could be included (see ❺ in Fig. 1). If there is interest in illustrating the survival probabilities at multiple time points, this information can be included in a separate table to avoid overcrowding the plot (see ❻ in Fig. 1). Others It is good practice to consider truncating the plot when the number of at risk is small, unless all patients are followed up until the end of the protocol-specified follow-up duration (see ❼ in Fig. 1). Censored observations could be indicated in the plot with a special symbol (see ❽ in Fig. 1). Be judicious with including p values in the plot. If reporting results from a randomized trial comparing survival between treatment arms using the log-rank test, it is okay to include the log-rank p value in the plot. If the survival comparison is based on other tests such as comparison of the survival probabilities at a fixed time point, or a comparison based on the Cox model adjusting for other covariates (as often is the case with observational studies), clearly state the statistical test used to obtain the p value; or better yet, do not include a p value in the plot. If a p value is included, denote whether it is one-sided or two-sided (see ❾ in Fig. 1). 1724 Ou et al Journal of Thoracic Oncology Vol. 15 No. 11
  • 4. censoring indicator reversed.17 This method provides a more appropriate estimate of the median follow-up time than the crude median follow-up time of survivors. Additional guidelines on time-to-event analysis will be discussed in another manuscript in this special series. Prognostic and Predictive Biomarkers in Oncology Studies. In studies that evaluate treatment impact, the goals may include discovering prognostic or predictive biomarkers. Prognostic biomarkers identify patients who have better outcomes regardless of treatment, whereas predictive biomarkers identify patients who benefit from treatment (versus those who do not). Illustrating that there is a statistically significant association between the biomarker and the outcome is sufficient to declare a biomarker as prognostic. In contrast, to declare a biomarker as predictive, it must be illustrated that the biomarker status and treatment interaction term is statistically significant.18,19 Because the interaction be- tween the biomarker status and treatment is required for modeling, a single-arm trial or a trial with biomarker- selected patients is inappropriate for the evaluation of predictive biomarkers. In the Conclusion Section and the Interpretation of Statistical Results p Value Greater Than 0.05 Does Not Mean Equiv- alence. Care must be taken to ensure that conclusions are supported by the results of the study. If a p value is not statistically significant, it can only be concluded that no difference between the groups was observed. A non- statistically significant p value does not support the conclusion that the two groups are similar; this can only be concluded if the study were designed to evaluate equivalence (please refer to the article on clinical versus statistical significance in this special series).20 Event/Total Median (95% CI)a Survival EsƟmates (95% CI)a Group Group A 155/200 2.2 (1.9–2.6) 2 years: 55.0 (48.3–62.6%) 4 years: 25.7 (19.7–33.5%) Group B 118/200 3.3 (2.5–4.5) 2 years: 59.3 (52.5–67.0%) 4 years: 42.2 (35.0–51.0%) ❺ ❽ ❾ Figure 1. A Kaplan-Meier plot of OS for two groups of patients. Refer to Table 1 for details about ❶ to ❾. A SAS macro is available to generate the Kaplan-Meier plot revealed (please refer to https://communities.sas.com/t5/SAS-Communities- Library/Kaplan-Meier-Survival-Plotting-Macro-NEWSURV/ta-p/479747). a Kaplan-Meier method. CI, confidence interval; KM, Kaplan-Meier; OS, overall survival. November 2020 Guidelines for Statistical Reporting 1725
  • 5. Observational Study: Discuss Potential Bias and Un- measured Confounder. Care is needed when making conclusions from observational studies. A single obser- vational study is not sufficient to establish causation or to state that a variable impacts (influences) the outcome when the p value for the association is statistically sig- nificant. The p value only measures the likelihood that the differences are because of chance, assuming that the groups are the same on all other factors. If there are imbalances between the groups owing to biases and unmeasured confounders, this could impact the p value; for example, the p value may be statistically significant because of differences between the groups that are associated with the potential confounders, even though the group itself is not associated with the outcome. Hence, for observational study designs, an observed as- sociation or difference between groups that are statisti- cally significant could reflect the following: (1) a true difference or association, (2) underlying biases and un- measured confounding, or (3) a combination of (1) and (2). The study conclusions need to properly reflect this. Conclusions In this manuscript, we provide guidelines for authors to consider when reporting statistical results in medical manuscripts. These guidelines are not exhaustive, but they cover many common outcomes and statistical methods used in clinical studies. We strongly encourage authors who submit manuscripts to the Journal of Thoracic Oncology to use these guidelines to improve the clarity of their reported methods and results. Acknowledgments This work was partially supported by the National In- stitutes of Health grant P30CA15083 (Mayo Compre- hensive Cancer Center grant) and U10CA180882 (Alliance for Clinical Trials in Oncology Statistics and Data Management grant). References 1. Journal of Clinical Oncology. Manuscript guidelines. https://ascopubs.org/jco/authors/manuscript-guidelines. Accessed April 10, 2020. 2. Annals of Internal Medicine. Information for authors: general statistical guidance. https://www.acpjournals. org/journal/aim/authors/statistical-guidance. Accessed April 10, 2020. 3. JAMA Network. Statistical methods and data presenta- tion. https://jamanetwork.com/journals/jama/pages/ instructions-for-authors#SecStatisticalMethodsandData Presentation. Accessed April 10, 2020. 4. The New England Journal of Medicine. New manuscripts. https://www.nejm.org/author-center/new-manuscripts. Accessed April 10, 2020. 5. Schulz KF, Altman DG, Moher D, CONSORT Group. CONSORT 2010 statement: updated guidelines for reporting parallel group randomised trials. Trials. 2010;11:32. 6. von Elm E, Altman DG, Egger M, et al. The Strengthening the Reporting of Observational Studies in Epidemiology (STROBE) statement: guidelines for reporting observa- tional studies. Lancet. 2007;370:1453–1457. 7. Cohen JF, Korevaar DA, Altman DG, et al. STARD 2015 guidelines for reporting diagnostic accuracy studies: explanation and elaboration. BMJ Open. 2016;6: e012799. 8. Moher D, Liberati A, Tetzlaff J, Altman DG, PRISMA Group. Preferred reporting items for systematic reviews and meta-analyses: the PRISMA statement. Ann Intern Med. 2009;151:264–269. W64. 9. EQUATOR Network. https://www.equator-network.org/. Accessed July 30, 2020. 10. International Committee of Medical Journal Editors. Preparing a manuscript for Submission to a medical journal. http://www.icmje.org/recommendations/browse/ manuscript-preparation/preparing-for-submission.html. Accessed April 10, 2020. 11. Greenland S, Senn SJ, Rothman KJ, et al. Statistical tests, p values, confidence intervals, and power: a guide to misinterpretations. Eur J Epidemiol. 2016;31:337– 350. 12. NIH, National Cancer Institute. NCI dictionary: p-value. https://www.cancer.gov/publications/dictionaries/cancer- terms/def/p-value. April 15, 2020. 13. Fadista J, Manning AK, Florez JC, Groop L. The (in) famous GWAS P-value threshold revisited and updated for low-frequency variants. Eur J Hum Genet. 2016;24:1202–1205. 14. Wasserstein RL, Lazar NA. The ASA statement on p- values: context, process, and purpose. Am Stat. 2016;70:129–133. 15. Cuzick J. Forest plots and the interpretation of sub- groups. Lancet. 2005;365:1308. 16. Kaplan EL, Meier P. Nonparametric estimation from incomplete observations. J Am Stat Assoc. 1958;53: 457–481. 17. Schemper M, Smith TL. A note on quantifying follow-up in studies of failure time. Control Clin Trials. 1996;17:343–346. 18. Ballman KV. Biomarker: predictive or prognostic? J Clin Oncol. 2015;33:3968–3971. 19. Renfro LA, Mallick H, An MW, Sargent DJ, Mandrekar SJ. Clinical trial designs incorporating predictive bio- markers. Cancer Treat Rev. 2016;43:74–82. 20. Dahlberg SE, Korn EL, Le-Rademacher J, Mandrekar SJ. Clinical versus statistical significance in studies of thoracic malignancies. J Thorac Oncol. 2020;15: 1406–1408. 1726 Ou et al Journal of Thoracic Oncology Vol. 15 No. 11