Phenotyping Seed Composition traits using Near Infrared Reflectance Spectroscopy
•
1 like•202 views

Phenotyping Seed Composition traits such as total starch, protein, oil using Near Infrared Reflectance Spectroscopy (NIR) in Maize and Soybean seed.

Recommended
Recommended
More Related Content
Similar to Phenotyping Seed Composition traits using Near Infrared Reflectance Spectroscopy
Similar to Phenotyping Seed Composition traits using Near Infrared Reflectance Spectroscopy (20)
Recently uploaded
Recently uploaded (20)
Phenotyping Seed Composition traits using Near Infrared Reflectance Spectroscopy
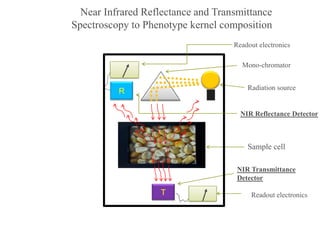
- 1. R Readout electronics Sample cell Mono-chromator Radiation source T NIR Reflectance Detector NIR Transmittance Detector Readout electronics Near Infrared Reflectance and Transmittance Spectroscopy to Phenotype kernel composition
- 2. Phenotyping kernel composition traits • FOSS 6500 Near Infrared Reflectance spectroscopy • ~200-300 whole seeds per sample • Scan time ~30 seconds Fig. FOSS® 6500 NIR Instrument
- 3. Steps involved during NIR calibration Partial Least Squares 1 (UnScrambler® software)
- 4. Step 1- A. Samples for NIR calibration : NAM Recombinant Inbred Lines (RILs) • 210 samples were selected for NIR calibration • NIR predicted values for Starch, Protein and Oil of the NAM RILs by Syngenta • P39 and Il14H sweet corn NAM families excluded from analysis Trait Mean Range H2 Starch 67.8 59.7-73.0 0.85 Protein 13.6 10.8-17.7 0.83 Oil 4.2 3.6-6.4 0.86 JP Cook et al. Plant Physiology (2012) vol. 158 no. 2 824-834 Table. Means, ranges and heritability estimates of kernel composition traits in the NAM population
- 5. Step 1- B. Collecting NIR reflectance data • Spectra collected from wavelength 400nm – 2490nm with the increment of 10nm • Collected spectra were treated with Multiple Scatter Correction (MSC) and 1st derivative to reduce the noise caused due to spectral scattering and increase signal intensity Fig. Raw NIR reflectance spectra Fig. MSC + 1st derivative of NIR reflectance spectra
- 6. Step 2. Wet lab analysis Trait B73 Mean Median Std. Dev. Variance Range Count Starch ~70% 68.65 68.60 5.40 29.20 55.34 - 82.33 209 Protein ~10% 12.91 12.90 3.08 9.51 6.76 - 21.40 210 Oil ~4% 2.81 2.80 1.22 1.48 0.16 - 6.34 210 Table . Statistics of reference values in the NIR calibration set and B73 • Agricultural Experiment Station Chemical Laboratories at MU • Proximate Analyses : • Crude Protein (Kjeldahl), Crude Fat, Moisture, Ash, and Crude Fiber • Total Starch Analyses • Samples in the calibration and validation sets were adjusted to a dry matter basis (DMB)
- 7. NIR Calibration and Validation Results Constituent n r Error (calibration) Bias Slope Protein 190 0.95 0.719 7.856e-07 1.0 Starch 190 0.83 2.705 -2.811e-07 1.0 Oil 190 0.65 0.951 1.815e-07 1.0 Constituent n r Error (prediction) Bias Slope Protein 19 0.927 0.806 -0.06841 0.987522 Starch 19 0.78 3.062 -0.06556 0.861095 Oil 20 0.63 0.780 1.317855 0.788155 Table 2. Validation statistics of NIR calibration for protein, starch and oil in whole maize kernels Table 1. Calibration statistics of NIR calibration for protein, starch and oil in whole maize kernels
- 8. NIR calibration – Protein content in whole maize kernels Fig 1. Scatter plot of analytically measured and predicted values for protein content in whole kernels of maize. Fig 2. Scatter plot of the NIR-predicted and analytical reference values for protein content using developed PLS model. Calibration result - Protein Validation result - Protein r = 0.97 r = 0.96
- 9. NIR calibration – Starch content in whole maize kernels Fig 1. Scatter plot of analytically measured and predicted values for starch content in whole kernels of maize. Fig 2. Scatter plot of the NIR-predicted and analytical reference values for starch content using developed PLS model in whole kernels of maize. Calibration result - Starch Validation result - Starch r = 0.82 r = 0.78
- 10. NIR calibration – Oil content in whole maize kernels Fig 1. Scatter plot of analytically measured and predicted values for Oil content in whole kernels of maize. Fig 2. Scatter plot of the NIR-predicted and analytical reference values for Oil content using developed PLS model in whole kernels of maize. Calibration result - Oil Validation result - Oil r = 0.65 r = 0.62
- 11. NIR (reflectance) prediction of single-kernel composition: A study conducted by Dr. A. Mark Settles Fig. Scatter plots of NIR-predicted and analytical reference values for starch (A), protein (B), and oil (C). Spielbauer et al. Cereal Chemistry., 86 (2009), pp. 556–564
- 12. R Readout electronics Sample cell Mono-chromator Radiation source T NIR Reflectance Detector NIR Transmittance Detector Readout electronics NIR Reflectance v/s NIR Transmittance B. Floury endosperm C. Embryo A. Vitreous endosperm Heavily encapsulated starch granules by prolamin-proteins Less encapsulated starch granules by prolamin-proteins
- 13. More details in this paper