ENVIRONMENTAL AND AGRONOMIC IMPACT OF THE HERBICIDE TOLERANT GM RAPESEED.PDF
Detecting GM Soybean in Crude Oil
1. Analytical Methods
Detection of genetically modified soybean in crude soybean oil
Zorica Nikolic´ a,⇑
, Ivana Vasiljevic´ b
, Gordana Zdjelar a
, Vuk Ðor -devic´ a
, Maja Ignjatov a
, Dušica Jovicˇic´ a
,
Dragana Miloševic´ a
a
Institute of Field and Vegetable Crops, Maksima Gorkog 30, Novi Sad, Serbia
b
A Bio Tech Lab, Vojvode Putnika bb, Sremska Kamenica, Serbia
a r t i c l e i n f o
Article history:
Received 30 April 2012
Received in revised form 29 August 2013
Accepted 4 September 2013
Available online 11 September 2013
Keywords:
GMO
Soybean
Crude oil
a b s t r a c t
In order to detect presence and quantity of Roundup Ready (RR) soybean in crude oil extracted from
soybean seed with a different percentage of GMO seed two extraction methods were used, CTAB and
DNeasy Plant Mini Kit. The amplifications of lectin gene, used to check the presence of soybean DNA,
were not achieved in all CTAB extracts of DNA, while commercial kit gave satisfactory results. Comparing
actual and estimated GMO content between two extraction methods, root mean square deviation for kit
is 0.208 and for CTAB is 2.127, clearly demonstrated superiority of kit over CTAB extraction. The results of
quantification evidently showed that if the oil samples originate from soybean seed with varying percent-
age of RR, it is possible to monitor the GMO content at the first stage of processing crude oil.
Ó 2013 Elsevier Ltd. All rights reserved.
1. Introduction
The commercial cultivation of genetically modified (GMO) soy-
bean varieties began in 1996, and they became predominant in the
major soybean producing countries. Today, around 148 million ha
of GMO plants are grown and traded, among which about 71% is
soybean (James, 2011). The Roundup Ready soybean (RRS), event
GTS 40-3-2, is mainly produced by USA, Argentina and Brazil and
exporting in EU and other countries, mostly as soybean meal and
crude vegetable oils, among other products.
Soybean represents about 60% of total oil consumption and
usage of GMO soybean seeds for soybean oil production has been
continuously increasing. Soybean oil is the most highly consumed
vegetable oil worldwide. It appears in a wide variety of processed
foods and in industrial products such as fatty acids, soaps and
biodiesel.
The European Union (EU) has established the legal basis for the
traceability and labelling requirements of genetically modified
organisms and GMO derived food and feeds (Regulations (EC) No.
1829/2003, 1830/2003). Furthermore, it covers products destined
for industrial processing for uses other than consumption (e.g. in
the production of a biofuel). Traceability implies a system to docu-
ment the history of product of the direction from primary raw
materials to the finishing consumable (MacDaniel & Sheridan,
2001). In this sense, traceability is needed for all products, which
are tradable.
For labelling of highly processed products in which the GMO
protein or DNA may be undetectable, to trace the GMO status of
the product traceability is especially useful (Davidson & Bertheau,
2007).
There are few reports concerning extraction of DNA and detec-
tion of GMO in highly processed food such as oil. The initial report
presented that no genetic material can be recovered after the first
processing steps of soybean oil, and negative result for all fractions
of industrially produced soybean oil (Pauli, Liniger, & Zimmer-
mann, 1998). In opposition to this successful detection of DNA
fragments in samples of cold pressed oil, as well as in samples of
refined oil, have been reported by Hellebrand, Nagy, and Mörsel
(1998). Refining process has influence upon the quality and
quantity of DNA, and after the degumming DNA was concentrated
in water fraction, no DNA could be amplified in the oil fraction
(Gryson et al., 2002).
A more recent study comparing four different extraction proto-
cols to recover DNA in soybean oil showed that the choice of the
extraction method was a critical parameter to detect a specific
DNA fragment by PCR and real-time PCR (Costa, Mafra, Amaral,
Beatriz, & Oliveira, 2010a). The other study demonstrated that it
is possible to extract trace amounts of amplifiable DNA along a
complete industrial soybean oil processing chain mostly based on
the use of the commercial kit for DNA extraction (Costa, Mafra,
Amaral, & Oliveira, 2010b). DNA could be recovered from distinct
types of vegetable oil (soybean, rapeseed, maize and flax) at differ-
ent stages of the oil refining, even in refined oil at least for high
copy DNA targets (Debode, Janssen, & Berbe, 2012).
Mentioned authors have been working with oil samples
obtained from soybean seed with a high percentage, around 50%
0308-8146/$ - see front matter Ó 2013 Elsevier Ltd. All rights reserved.
http://dx.doi.org/10.1016/j.foodchem.2013.09.017
⇑ Corresponding author. Tel.: +381 21 4898 150; fax: +381 21 421 249.
E-mail address: zorica.nikolic@ifvcns.ns.ac.rs (Z. Nikolic´).
Food Chemistry 145 (2014) 1072–1075
Contents lists available at ScienceDirect
Food Chemistry
journal homepage: www.elsevier.com/locate/foodchem
2. or 80% of Roundup Ready soybean. There is no report if it is possi-
ble to detect and quantify the GMO if the oil samples were
obtained from seed, which contain smaller amount of RRS seed.
This could be a very practical concern because in seed production,
transport and storage, some mixtures of non GMO and GM soybean
are likely to occur (Bullock & Desquilbet, 2002). The aim of this
study was to detect and estimate the quantity of Roundup Ready
soybean in crude oil extracted from soybean seed with various per-
centages of GMO seed using two extraction methods.
2. Materials and methods
2.1. Samples
Soybean seed of non GMO variety (Vojvo -danka, Institute of
Field and Vegetable Crops, Novi Sad) and GMO variety, modifica-
tion GTS 40-3-2 (Roundup Ready, Monsanto), were used in order
to make samples with a different percentage of GMO: 0%, 1%, 5%,
10% and 100%. Seed was ground in Thermomix TM21, Vorwerk
(Germany). In the preparation of each level, appropriate amounts
of the ground sample of GMO soybean and non-GMO soybean were
weighed and mixed thoroughly. Samples were made in two
replicates.
The Certified reference materials (CRM) were used as dried
soybean powder (GTS 40-3-2) with 0.1% and 0% GMO soybean,
developed by the Institute for Reference Materials and Measure-
ments (IRMM, Belgium). Unlabeled crude soybean oil bought from
a local market was used as additional negative control.
2.2. DNA extraction from oil
100 g of each sample was mixed with n-hexane in ratio 1:10 (v/
w), and vortex about 2 h. Solution was filtrated and filtrate was
stirred overnight at room temperature in order to evaporated n-
hexane. About 14 ml of crude soybean oil was separated into two
tubes and centrifuged at 11,000g for 30 min at 4 °C. After centrifu-
gation, the supernatant was discarded. The DNA was extracted
from a pellet on two ways, using the cetyltrimethylammonium
bromide (CTAB) method (Querci, Jermini, & Van den Eede, 2004)
and DNeasy Plant Mini Kit (Qiagen GmbH). The extractions were
done in duplicate assays for each sample.
The quality and purity of DNA were analysed by spectropho-
tometry using BioSpec-nano, Shimadzu (Shimadzu Coorporation,
Japan). DNA concentrations were determined by UV absorbance
at 260 nm. The purity of the DNA was determined by a ratio of
the absorbance at 260, 280 and 230 nm. All samples were diluted
with nuclease-free water up to 50 ng/ll.
2.3. Qualitative PCR
The sequences of oligonucleotide primers used in this work are
presented in Table 1. The primers were synthesized by Metabion
International AG (Martinsried, Germany).
The PCR was carried out using premix of 2Â PCR Master Mix,
(Fermentas, Lithuania) containing 4 mM MgCl, 0.4 mM dNTP,
0.05 units/ll Taq DNA Polymerase (recombinant).
PCR was performed in a final volume of 25 ll of PCR mix con-
taining 0.2 pmol/ll primers for lectin gene and RR soybean and ap-
prox. first 100 ng and then 50 ng DNA was used.
Amplifications were carried out in a Mastercycler ep gradient S
termocycler (Eppendorf, Germany) under the following programs:
denaturation at 94 °C for 10 min followed by 30 cycles of 94 °C for
30 s, 63 °C for 30 s and 72 °C for 30 s (for lectin); 35 cycles of 94 °C
for 30 s, 56 °C for 30 s and 72 °C for 30 s (for RRS) and the final
extension was carried out at 72 °C for 3 min. Each extract was
amplified in duplicate assays. In each run four controls were in-
cluded, maize and crude soybean oil as negative controls, 0.1%
CRM RRS as positive control and blank control.
The amplification fragments were determined using electro-
phoresis on 2% agarose gel containing ethidium bromide (0.5 g/
mL). A Fast Ruler DNA Ladder Low Range (Fermentas) was used
as a marker.
The agarose gel was visualised in UV transilluminator, and the
images were captured with DOC PRINT system (Vilber Lourmat,
USA).
2.4. Real-time PCR
DNA quantification was performed on 7500 Real Time PCR Sys-
tem (Applied Biosystems, USA) using the TaqMan Soy 35S GMO
detection kit for the amplification of the soybean lectin (Le 1) gene
target and the p35S target in the same tube. Reactions were carried
out in 96-well microtiter plates in a total volume of 25 ll.
Temperature programme included: initial denaturation during
10 min at 95 °C followed by 40 cycles consisting of 95 °C 15 s,
60 °C 1 min and 72 °C 31 s. Each sample was amplified in triplicate.
3. Results and discussion
In order to isolate DNA from crude soybean oil obtained from
seed with the different percentage of GMO, two extraction proto-
cols were used, CTAB and DNeasy Plant Mini Kit (Qiagen). These
methods were chosen as commonly used in the GMO detection
laboratories. In terms of simplicity and speed the DNeasy Plant
Mini Kit was easy to use, while the CTAB was the very laborious
and time-consuming method but widely used for food and feed.
DNeasy Plant Mini Kit is like as other producer’s commercial kits
based on the selective adsorption of nucleic acids to a silica-gel
membrane in the presence of high concentrations of chaotropic
salts.
The results of comparative analysis showed that both methods
gave good yield of DNA, which could be explained with the fact
that oil was extracted from fine grounded soybean seeds (Table 2).
It is generally agreed that an A260/A280 ratio of 1.8 for DNA is
indicative of a pure nucleic acid preparation (Sambrook & Russel,
2001). Absorption at 230 nm reflects contamination on the sample
by components such as carbohydrates, peptides, phenols or aro-
Table 1
Oligonucleotide primers.
Primer Sequence (50
–30
) Fragment length (bp) References
GM03 GCC CTC TAC TCC ACC CCC ATC 118 Lipp et al. (2001)
GM04 GCC CAT CTG CAA GCC TTT TTG TG
Le1 GAC GCT ATT GTG ACC TCC TC 318 Tengel, Schüßler, Setzke, Balles, and Sprenger-Haußels (2001)
Le6 GAA AGT GTC AAG CTT AAC AGC GACG
35s-f2 TGA TGT GAT ATC TCC ACT GAC G 172 Wurz and Willmund (1997)
petu-r1 TGT ATC CCT TGA GCC ATG TTG T
Z. Nikolic´ et al. / Food Chemistry 145 (2014) 1072–1075 1073
3. matic compounds. When the absorption ratio for 260/280 nm is
between 1.5 and 2.0, and the absorption for 260/230 nm is more
than 1.7, the extracted DNA should be considered as pure DNA.
The successful DNA extraction was obtained from all soybean oil
samples. The A260/A280 values and low A260/A230 ratio demonstrate
the presence of contaminants in all DNA samples extracted by
CTAB method. All samples extracted by DNeasy Plant Mini Kit have
high A260/A280 values, ranging from 1.72 to 1.94. The low A260/A230
values indicate the presence of carbohydrates or proteins, but
using DNeasy Plant Mini Kit contaminant’s concentration was sig-
nificantly reduced. The findings illustrate that the DNA extraction
methods have a significant effect on DNA quality. The similar re-
sults were reported by Jasbeer, Son, Mohamad Ghazali, and Cheah,
(2009) for the DNA isolated from feed samples. Moreover, the suc-
cessful DNA extraction from vegetable oils, enabling the detection
of GMO in these products, was based on using Nucleospin food kit
as the most optimal protocol (Costa et al., 2010).
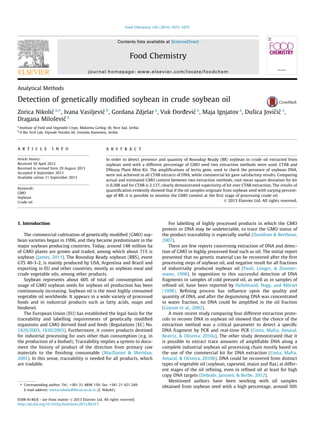
The presence of soybean DNA in oil samples and its applicability
was checked by using soybean specific primers for lectin gene.
From several primers available in the literature two primers sets
were chosen, producing short fragment of 118 bp (GM03/GM04)
and longer fragment of 318 bp (Le1/Le6). Using 100 ng of DNA
per reaction, the CTAB extracts of DNA were not amplified in all
samples (data not shown). In order to remove the influence of
inhibitory substances, contained mainly in CTAB extracts of DNA,
PCR was repeated with diluted samples (50 ng in the reaction)
and similar results were obtained. The fragments of 118 bp
(Fig. 1) and 318 bp, corresponding to a part of the endogenous lec-
tin gene, were amplified in all the samples extracted by DNeasy
Plant Mini Kit using 100 ng of DNA in the reaction as well as with
50 ng. The DNeasy Plant Mini Kit, similar as Nucleospin food kit,
proved to produce amplifiable DNA from refined vegetable oils
(Costa et al., 2010a), is based on a silica membrane technology. This
work showed that successful DNA extraction from crude oil did not
require a large amount of oil samples. The quality of isolated DNA
from crude soybean oil using CTAB method was not sufficient to
make PCR analysis possible, which is case for refined oil, too (Costa
et al., 2010b).
The results pointed out the importance of the DNA extraction
protocol on the oil and other processed food. The presence of dif-
ferent inhibitors such as proteins, fats, polysaccharides and other
compounds in DNA extracted from food matrices could affect the
amplification step, leading to false-negative results (Corbisier
et al., 2007).
For the correct traceability of transgenic materials or when
dealing with certified reference materials at a low percentage of
transgenic materials it is important to analyse short fragments
(188, 195 or 470 bp) (Bogani, Minunni, Spiriti, Zavaglia, & Tombelli,
2009), while Gryson (2010), in a substantial review of methods for
detecting GM DNA in a variety of processed foods, recommends
looking for a maximum of only 150 bp.
Successful GMO detection depends crucially on the quality of
the extracted sample DNA. The choice of extraction method is of-
ten a trade-off between cost, optimal yield of DNA and removal
of substances that could influence the PCR reaction (Cankar, Štebih,
Dreo, Zˇel, & Gruden, 2006).
Those samples with positive signal for lectin gene screening
were analysed for presence of the inserted gene construct in RR
soybean: epsps gene. All expected samples, extracted with DNeasy
Plant Mini Kit produced a fragment of 172 bp (Fig. 2). The sensitiv-
ity of PCR reaction was checked using as control 0.1% RRS CRM,
which gave a visible band.
The amplification of RR soybean by PCR assays using construct-
specific primers was achieved for all the extraction containing RR
soybean, except for the CTAB extract of DNA from the oil sample
with 1% RRS.
In order to confirm the qualitative PCR results and to have an
estimation the amount of GMO the real-time PCR assays were
conducted.
In all samples with the different percentage of GMO, it was pos-
sible to detect and quantify genetically modified organisms. The
results of GMO quantification also clearly show that, with two
exceptions, all calculations were in line with GMO content in the
starting seed materials (Table 3). The values of quantification in
CTAB extracts from 1% and 10% Roundup Ready soybean oils were
under expected level, probably caused by inhibitors presented in
DNA extracts.
Table 2
Concentration and purity of DNA obtained with CTAB and DNeasy Plant Mini Kit from oil samples. Values represent average over two replications with standard error.
Oil samples CTAB DNeasy Plant Mini Kit
DNK (ng/ll) A260/A280 A260/A230 DNK (ng/ll) A260/A280 A260/A230
Oil from 0% RR soybean 94.38 ± 0.92 1.73 ± 0.12 0.82 ± 0.15 126.27 ± 0.38 1.80 ± 0.07 0.73 ± 0.09
Oil from 1% RR soybean 265.30 ± 1.01 1.38 ± 0.15 0.30 ± 0.06 593.94 ± 0.95 1.94 ± 0.08 1.04 ± 0.09
Oil from 5% RR soybean 271.38 ± 0.98 1.46 ± 0.09 0.31 ± 0.11 115.74 ± 0.87 1.72 ± 0.08 0.73 ± 0.08
Oil from 10% RR soybean 396.53 ± 0.59 1.14 ± 0.08 0.23 ± 0.06 391.84 ± 0.64 1.92 ± 0.05 1.07 ± 0.04
Oil from 100% RR soybean 471.64 ± 2.57 1.45 ± 0.29 0.32 ± 0.18 223.59 ± 0.72 1.86 ± 0.10 1.02 ± 0.11
1 2 3 4 5 6 7 8 9 10 11 12 13 14 15 16 17
(bp)
1500
850
400
200
50
118 bp
Fig. 1. Detection of the soybean lectin gene using primers GMO3/GMO4 in soybean
oil samples extracted with CTAB and DNeasy Plant Mini Kit. Line (1) DNA ladder, (2)
blank, lines 3–10 CTAB extracts: (3) maize (negative control), (4) 0.1% RRS CRM
(positive control), and (5) crude soybean oil, (6–10) soybean oil samples with 0%,
1%, 5%, 10% and 100% RR soybean, (11–16) DNeasy Plant Mini Kit extracts (crude
soybean oil, soybean oil samples with 0%, 1%, 5%, 10% and 100% RR soybean) and
(17) DNA ladder.
1 2 3 4 5 6 7 8 9 10 11 12 13 14 15 16 17 18 19 20
172 bp
(bp)
1000
500
200
50
Fig. 2. Analysis of the presence of RRS in oil samples extracted with CTAB and
DNeasy Plant Mini Kit. Line (1) DNA ladder, (1) blank, lines 3–10 CTAB extracts: (3)
maize (negative control), (4) 0.1% RRS CRM (positive control), (5) crude soybean oil,
(6–10) soybean oil samples with 0%, 1%, 5%, 10% and 100% RR soybean, (11) DNA
ladder, (12–19) DNeasy Plant Mini Kit extracts: crude soybean oil, soybean oil
samples with 0%, 1%, 5%, 10% and 100% RR soybean, (18) 0.1% RRS CRM (positive
control) and (19) maize (negative control), and (20) blank.
1074 Z. Nikolic´ et al. / Food Chemistry 145 (2014) 1072–1075
4. In order to reduce the influence of inhibitors in the extracted
samples, a fourfold dilution series was prepared with water (1:4,
1:16, 1:64 and 1:256). All DNA dilutions were run in duplicate.
1:16 dilution of the kit extracted DNA resulted in expected quanti-
fication, but in CTAB extracted samples inhibitors remained after
dilution. Dilution of the DNA helps to reduce the inhibitor concen-
tration and enhance PCR efficiency. However, a lower DNA concen-
tration may decrease PCR sensitivity.
Comparing actual and estimated GMO content between two
extraction methods, root mean square deviation for kit is 0.208
and for CTAB is 2.127, clearly demonstrate superiority of commer-
cial kit over CTAB extraction. Inconsistency in results using CTAB
extracts, especially at low GMO level, shows that CTAB method is
unsuitable for accurate qualitative and quantitative GMO analysis
of soybean oil.
The random differences in the reaction conditions due to these
variations, cause that the standard deviations of the GMO value of
the samples were relatively high (4–59%). Many manipulations
during the CTAB extraction require well trained staff, and extrac-
tion efficiencies between samples might be altered if the many
samples were extracted at the same time.
The soybean samples used for oil extraction were prepared by
mixing GMO and non-GMO soybean on a w/w ratio, so differences
in the genome/weight ratios of the two soybean materials might
explain the discrepancy. Furthermore, the characteristic of the
PCR itself, which does not amplify a target sequence at a 100% effi-
cacy, is another important factor that could lead to an underesti-
mation of the target copy. In the genetically modified plants
most of the inserted constructs are present at the level of one copy
per haploid genome; it means low copy number targets and it is
more affected by the refining process. The loss of information is
even higher if the plants used for oil production are not 100%
genetically modified (Debode et al., 2012).
Since mixtures of GM and non-GM seeds were encountered at
trading areas, it is necessary to check for the existence of GMOs
in seeds at different points along their path from the field to the
food processing plant (Nikolic´, Taški-Ajdukovic, Tatic, & Baleše-
vic-Tubic, 2009).
Reliable quantification depends on the efficiency of DNA extrac-
tion protocols, which is considered as a critical step in the analysis
of DNA extracted from soybean oil. If the oil samples originate from
soybean seed with varying percentage of RR soybean, it is possible
to monitor the GMO content at the first stage of processing crude
oil.
To our knowledge, this has never been reported before and rep-
resents an important accomplishment regarding the traceability of
genetically modified organisms in oils.
Acknowledgement
This work was supported by the Project No. TR31024 of the
Ministry of Education and Science, Republic of Serbia.
References
Bogani, P., Minunni, M., Spiriti, M., Zavaglia, M., & Tombelli, S. (2009). Transgenes
monitoring in an industrial soybean processing chain by DNA-based
conventional approaches and biosensors. Food Chemistry, 113, 658–664.
Bullock, D. S., & Desquilbet, M. (2002). The economics of non-GMO segregation and
identity preservation. Food Policy, 27, 81–99.
Cankar, K., Štebih, D., Dreo, T., Zˇel, J., & Gruden, K. (2006). Critical points of DNA
quantification by real-time PCR-effects of DNA extraction method and sample
matrix on quantification of genetically modified organisms. BMC Biotechnology,
6(37), 1–15.
European Commission (2003). Regulation (EC) No. 1829/2003 of the European
Parliament and of the Council of 22 September 2003 on genetically modified
food and feed. Official Journal of the European Union, 268, 1–23.
European Commission (2003). Regulation (EC) No. 1830/2003 of the European
Parliament and of the Council of 22 September 2003 concerning the traceability
of food and feed products produced from genetically modified organisms and
amending directive 2001/18/EC. Official Journal of the European Union, 268,
24–48.
Corbisier, P., Broothaerts, W., Gioria, S., Schimmel, H., Burns, M., Baoutin, A. A., et al.
(2007). Effect of DNA extraction methods on the quantitative determination of
Bt176 corn by real-time PCR. Journal of Agricultural and Food Chemistry, 55,
3249–3257.
Costa, J., Mafra, I., Amaral, J. S., Beatriz, M., & Oliveira, M. B. P. P. (2010a). Monitoring
genetically modified soybean along the industrial soybean oil extraction and
refining processes by polymerase chain reaction techniques. Food Research
International, 43(1), 301–306.
Costa, J., Mafra, I., Amaral, J. S., & Oliveira, M. B. P. P. (2010b). Detection of
genetically modified soybean DNA in refined vegetable oils. European Food
Research and Technology, 230, 915–923.
Davidson, J., & Berteau, Y. (2007). EU regulations on the traceability and detection of
GMOs: Difficulties in interpretation, implementation and compliance. CAB
Review: Perspectives in Agriculture, Veterinary Science, Nutritional and Natural
Resources, 2(077), 1–14.
Debode, F., Janssen, E., & Berbe, A.M.G. (2012). DNA detection by conventional and
real-time PCR. Journal of the American Oil Chemists Society, 1/1924, 89 Online
First™, 24 January 2012.
Gryson, N. (2010). Effect of food processing on plant DNA degradation and PCR-
based GMO analysis: A review. Analytical and Bioanalytical Chemistry, 396,
2003–2022.
Gryson, N., Ronsse, F., Messens, K., De Loose, M., Verleyen, T., & Dewettinck, K.
(2002). Detection of DNA during the refining of soybean oil. Journal of the
American Oil Chemists’ Society, 79, 171–174.
Hellebrand, M., Nagy, M., & Mörsel, J. T. (1998). Determination of DNA traces in
rapeseed oil. Zeitschrift für Lebensmitteluntersuchung und – Forschung A, 206(4),
237–242.
James, C. (2011). Global status of commercialized biotech/gm crops: 2011. ISAAA brief
43. Ithaca, NY: ISAAA.
Jasbeer, K., Son, R., Mohamad Ghazali, F., & Cheah, Y. K. (2009). Real-time PCR
evaluation of seven DNA extraction methods for the purpose of GMO analysis.
International Food Research Journal, 16, 329–341.
Lipp, M., Bluth, A., Eyquem, F., Kruse, L., Schimmel, H., Den Eede, G. V., et al. (2001).
Validation of a method based on polymerase chain reaction for the detection of
genetically modified organisms in various processed foodstuffs. European Food
Research and Technology, 212, 497–504.
MacDaniel H. A., & Sheridan M. K. (2001). Traceability of animals and animal
products. (Chapter 2 & 3), Office International des Epizooties – OIE [August 2001]
[06/11/2004] <http://www.oie.int/eng/publicat/rt/A_RT20_2.htm>.
Nikolic´, Z., Taški-Ajdukovic´, K., Tatic´, M., & Baleševic´-Tubic´, S. (2009). Monitoring of
the Roundup Ready soybean in the Vojvodina province in Serbia. Industrial
Crops and Products, 29, 638–641.
Pauli, U., Liniger, M., & Zimmermann, A. (1998). Detection of DNA in soybean oil.
Zeitschrift für Lebensmittel – Untersuchung und Forschung A, 207, 264–267.
Querci, M., Jermini, M., & Van den Eede, G. (2004). The analysis of food samples for
the presence of genetically modified organisms, European commission (special
publication 1.03.114), European Commission, Joint Research Centre, Ispra (pp.13–
16), Italy, Session4.
Sambrook, J., & Russel, D. W. (2001). Molecular cloning: A laboratory manual (3rd ed.).
Cold Spring Harbor Laboratory, New York: Cold Spring Harbor Laboratory Press
(vol. 3, E5).
Tengel, C., Schüßler, P., Setzke, E., Balles, J., & Sprenger-Haußels, M. (2001). PCR
based detection of genetically modified soybean and maize in row and highly
processed foodstuffs. BioTechniques, 31(2), 426–429.
Wurz, A., & Willmund, R. (1997). Identification of transgenic glyphosate-resistant
soybeans. In G. A. Schreiber, K. W. Bögl (Eds.), Food S produced by means of
genetic engineering – 2nd status report (pp. 115–117). BgVV-Heft 1/1997 (BgVV,
Berlin).
Table 3
Real-time results for the amplification of oil extracts. Values represent average over
six replications with standard error.
Sample CTAB DNeasy Plant Mini Kit
% GMO % GMO
Negative controla
NA NA
0% NA NA
1% 0.52 ± 0.50 1.03 ± 0.47
5% 6.01 ± 0.10 5.97 ± 0.05
10% 1.90 ± 0.59 10.21 ± 0.58
100% 98.06 ± 0.13 99.36 ± 0.04
a
Negative control – crude soybean oil from market, NA – no detectable ampli-
fication LOD = 0.02%, LOQ = 0.1%. R2
= 0.99, slope = À3.42, intercept = 6.94, PCR
efficiency = 0.96.
Z. Nikolic´ et al. / Food Chemistry 145 (2014) 1072–1075 1075