
Recommended
Recommended
More Related Content
What's hot
What's hot (7)
Similar to Geographic Information System use as a training tool
Similar to Geographic Information System use as a training tool (20)
Recently uploaded
Recently uploaded (15)
Geographic Information System use as a training tool
- 1. 1 Geographic Information Systems (GIS) as Multi-organizational training tool Michael Hallett MichaelHallettii@mac.com Structured Abstract: Purpose The paper provides principles and techniques for effective employment of Geographic Information Systems (GIS) in multi-organizational training and exercises through a case study on how the GIS was used to support a complex maritime operations course. Design Methodology The paper is a case study based on research carried out by staff members at the US Naval War College. The case study describes development and use of a GIS tool for enhancing training on maritime security operations and provides principles with broader application to other training and exercise activities. Findings By providing an ‘arena’ within which students act, GIS serves an extremely effective tool to engage students in active learning, especially during training and exercise events with participants from multiple organizations. Research Research was conducted during 16 sessions of the five week course (from June 2014 to June 2015) serving over 400 students. Practical Implications During the research period, principles for effectively employing GIS in complex training scenarios were derived. The paper articulates these principles and provides a checklist for practitioners incorporating GIS in a wide variety in training and exercise situations. Original value The paper provides specific guidance on how to maximize the return on investment in time and training team resources for integrating GIS into training and exercise events. The principles and checklist will be especially valuable for personnel with responsibility for designing and managing complex training and exercise events. Keywords: Geographic Information Systems, active learning, multi-organizational training, information and knowledge management, training, exercises, maritime
- 2. 2 Geographic Information Systems (GIS) have become useful tools for training and exercises, as well as for the specific geographic analysis tasks for which they were originally designed. This article, based on research carried out as a member of the scenario control team of the Maritime Staff Operators Course (MSOC) at the Naval War College’s College of Operational and Strategic Leadership from June 2014 to June 2016, describes how GIS can be used as a tool to enhance multi-organizational training. Based on the course experience, this case study provides principles for using GIS in multi- organizational training as a competency based learning tool to better engage learner attention in distraction filled environments. The GIS, by providing both a content delivery system and arena in which students can actively engage with the content and processes that are the subject of instruction, enhances organizational learning. The case study also provides training product examples readers can tailor in order to meet their own training needs, and is organized as follows: section one provides a literature review and defines Geographic Information Systems (GIS). Section two is a description of the introduction to GIS use in the Maritime Staff Operators Course at the U.S. Naval War College. The third discusses the advantages of GIS systems from both the instructor/faculty and student perspectives and the fourth, disadvantages. Finally it concludes with principles to guide readers in creating their own GIS overlays to enhance their training and exercises and a checklist for GIS overlay development. Section 1: Literature review Josephy Kerski, in “The Implementation and Effectiveness of Geographic Information Systems Technology and Methods in Secondary Education” examines the use of GIS for education in geography. (Kerski, 2003) Stephen Tooth’s “Google Earth as Resource” drills down to examine the specific use of Google Earth in a classroom setting. Both of these focus on how GIS and Google Earth can be applied for enhancing education in geography. Tooth defines Google Earth as a type of “Virtual globe”. He explains, “By combining topographic representations of the Earth’s surface with recently-captured satellite images or aerial photographs, and by providing simple controls on user-friendly interfaces, virtual globes allow users to view any urban or rural area at different scales from vertical, oblique, or even three-dimensional (3D)
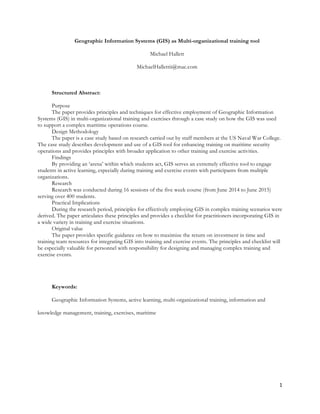
- 3. 3 perspectives.” (Tooth, 2015) The GIS thus functions as a computer based simulation tool. However, the nature of GIS as a computer based simulation expands the utility of scope of GIS for training. Curtin et all, in “Computer-based Simulation Training to Improve Learning Outcomes in Mannequin based Simulation Exercises” points out that professionals in a wide variety of domains can benefit from simulation based training. “Simulation is used to train many professionals, including pilots, military personnel, business managers, and health care professionals, and is an effective active-learning technique that encourages the application of knowledge and skills in real-world scenarios.” (Curtin et al., 2011) This article focuses on the use of Google Earth as an GIS system to multi-organizational security sector training. Before examining GIS use in the course, it is necessary to more precisely define GIS. GIS Defined Michael N. DeMers in his Fundamentals of Geographic Information Systems, (GIS) defines GIS as “…tools that allow for the processing of spatial data into information, generally information tied explicitly to, and used to make decisions about, some portion of the earth.” (DeMers, 2003) GIS tools, like Google Earth, provide a readily accessible common virtual space within which diverse groups and individuals can engage in shared sensemaking in order to enhance operational effectiveness. For example, as seen in figure 1, Google Earth provides a map of the Malacca Straits (the focus of the MSOC course scenario) upon which various overlays can be placed (roads, airports, demographic information etc.) information products (photographs, texts, webpages) embedded, and platforms (ships, aircraft) located. By making selected multilayer context relevant display of information (including data visualizations, multimedia links, photos, PDF documents, spreadsheets, etc.) possible, the GIS enables instructors to focus student attention on key factors within the learning environment.
- 4. 4 Figure 1. The above figure is an example for instructional purposes. Key: 1) Merchant shipping. 2) Friendly naval unit. 3) Piracy or Armed Robbery at Sea incident. 4) Traffic separation scheme. DeMers defines a GIS in terms of four major subsystems: 1. A data input subsystem that collects and preprocesses spatial data from various sources. This subsystem is also largely responsible for the transformation of different types of spatial data (i.e., from isoline symbols on a topographic map to point elevations inside the GIS). 2. A data storage and retrieval subsystem that organizes the spatial data in a manner that allows retrieval, updating, and editing. 3. A data manipulation and analysis subsystem that performs tasks on the data, aggregates and disaggregates, estimates parameters and constraints, and performs modeling functions. 4. A reporting subsystem that display all or part of the database in tabular, graphic, or map form. (DeMers, 2003) These systems together generate the rich display that enables students to integrate multiple source data and information in order to make decisions. Indeed, as Nadine Schurman in her GIS A Short Introduction puts it, “The power of GIS emerges partly from its capacity to make visual spatial relationships, and to picture spatial objects in a way that allows users to interpret pattern.” (Schuurman, 2004) These patterns are interpreted into narratives, or stories, about the environment and the intentions of actors in the environment. This pattern recognition, integration and articulation constitutes an important part organizational learning. As Edward D. Hess in Learn or Die says, “Learning basically is the process by which each one of us creates meaningful stories about our world that are more accurate or truthful such that we can act more effectively.” (Hess, 2014)
- 5. 5 The GIS tool provides a geographically accurate “canvas” on which the students can tell the “story” they create to manage challenges in the operating environment. The GIS tool, by embellishing the learning environment, stimulates student engagement with both the content and processes employing that content in which they need to develop expertise. The GIS thus significantly enhances the active learning component of the training, exercise or educational experience by constituting a dynamic arena within which the processes at hand unfold through a narrative based on evolving understanding of own capabilities and those of others. The narrative enabling capacity emerges from two sub capabilities: world portrayal through integration of content and process illumination. World Portrayal The GIS world portrayal capability results from the map based interface integration of content where data storage, and retrieval and reporting subsystems play critical roles. Integrating multivalent information onto maps to inform decision making enables focus on space in which actions take place as an operational factor. The articulation of space from the perspective of the organization provides students the opportunity to organize space in relation to their organizational resources, such as platforms (vehicles, ships, aircraft) and sufficient numbers of properly qualified personnel. The tool enables the visualization of the association between the attributes of the environment to forces, and therefore educates students about how the organization shapes and reshapes itself to accomplish its core tasks. This includes merging content from both internal and external sources and enabling linkages to that content via icons. Internal sources include own organizational standard operating procedures, tactics, terms of reference, handbooks and so on for responding appropriately to complex situations. Links to external sources provide access to data and information on partners, other actors and adversary actions in the environment instructors want the students to have access to or to learn about (such as a paper on a governmental or transnational criminal organization). World portrayal through immersion in content makes possible a steady focus on the course subject matter by reducing the time required to search for and evaluate the information otherwise produced through unguided
- 6. 6 internet searches. It thus canalizes student autonomous learning activity preserving the autonomy critical for adult learning.1 This also enhances learning by enabling discovery based learning. When integrated into a scenario, the GIS tools provide the students with the opportunity to see how the operational impacts of the spatial locations of events unfold over time – if students err in the placement of their resources (for example, pre- staging of counter-piracy responders in historically appropriate areas vice currently trending locations) the GIS tool enables both students to see for themselves and instructors to provide feedback on the effects of student action, thus facilitating working toward more effective solutions. In addition, gradual revelation of information through the GIS in accordance with the scenario supporting the course of instruction flow enhances student discovery. For example, during the final battle week portion of the course, the morning operations and intelligence briefs are delivered by the instructional staff using the GIS. This allows the briefer to highlight the key data and information the students need to make decisions during the day’s work within the scenario context. The GIS mediates the data and information transfer showing, not telling, about the connections between the forces, events, activities and time and space in an operationally significant way. A PowerPoint presentation with detailed data and information is made available but serves as a reference, not the primary method of information transfer. However, the world portrayed in the GIS is, of necessity, incomplete. In a training situation the GIS contains only a subset of all the potentially applicable information. The subset portrayal decision is based on an analysis of the learning objectives – the components of the world necessary for the students to meet the learning objectives are emphasized and those that do not speak directly to the learning objectives are deemphasized. Process illumination The GIS provides a geographic context in which student execute the processes utilized in the course or exercise. This shortens the distance students have to conceptually travel between learning about a process and 1 See pages 185 to 189 of KNOWLES, M. S., III, E. F. H. & SWANSON, R. A. 2005. The Adult Learner, United States, Elsevier.for further discussion of adult learner autonomy
- 7. 7 employing that process to generate effects, thus enhancing student learning and retention. For example, the exertion required to find and share the information in order to build out the geographic common operational picture on Google Earth are the same as those required for real world common operational picture construction. This effect is magnified when the GIS informs the common operational picture (COP) as used in normal operations, ensuring the same processes used in daily work are used in the training environment. The GIS thus captures many of the benefits of on the job training (OJT) in a controlled environment, allowing for low cost mistakes and feedback. (Klein, 2013) IKM processes and the GIS The GIS also creates engagement with the processes that constitute the subject of the training through “game play” in which the pieces (the merchant, pirate, and counter piracy ships) move on the GIS as they would in real life, enabling the students to observe the situation, orient themselves, make decisions and act in realistic ways. The GIS thus functions like a game board on which students can practice Information and Knowledge Management (IKM) processes associated with organizational activity. The GIS enables student information acquisition for decision making, and illuminates gaps in their knowledge they must fill with action. In the MSOC case, the capabilities of counter piracy forces (speed, weapons systems, communications, aviation assets) and vulnerabilities (range limitations, rules of engagement, national caveats) are accessible via a link on the GIS. Armed robbery at sea and piracy events are indicated with icons. Students then must deploy forces to manage the challenge and thus change the trajectory of the story portrayed in the GIS. The GIS interface thus makes it possible to display segmented information to give students real time appreciation for the complexities of IKM associated with application of the processes. Working through IKM related issues (the ways the organization manages data and information to move up the knowledge hierarchy from data to information to knowledge to wisdom to produce actionable knowledge and act wisely upon it as it applies to performance of its assigned tasks) is important for single organizations using the tool to enhance organizational learning. It is even more important for multiple organizations learning about each other’s IKM practices in order to facilitate interaction in the field. The failure to develop effective IKM practices
- 8. 8 impacts the ability to create shared situational awareness and thus the speed of decision and action. The GIS stimulates exercise of communication and decision making procedures that constitute the heart of organizational activity by embodying the information and knowledge management challenges. Use of the GIS helps organizations make their IKM practices more effective by allowing for engagement with the following IKM related questions: 1. Information fidelity. How accurate is the information? 2. Information timeliness. How current is the information? What delays affect transmission of the information and can changes to permissions, security designations (classification, connectivity, releasability) or information sharing processes affect those delays? 3. Information relevance. What is the provenance of the information, and resulting relevance for decision making? 4. Information sufficiency. How much information is sufficient to support decision-making? What are the tradeoffs between delaying a decision in order to acquire greater information granularity versus the gains accrued from speed of action? 5. Information absorptive capacity. What is the IM/KM absorptive capability of the organization? How much information is too much? As Herbert Simon pointed out, in an era of easy access to information, attention is the scarcest resource. He explains, “The real design problem is not to provide more information to people but to allocate the time they have available for receiving information so that they will get only the information that is most important and relevant to the decisions they will make.”(Simon, 1996) 6. When do the organizations begin to suffer from information overload? What organization, training, personnel or facilities changes can reduce the impact of this overload? Section 2: GIS use in the Maritime Staff Operators Course (MSOC) The Maritime Staff Operators Course (MSOC) educates naval personnel from different specialties to work effectively as members of a Maritime Operations Center (MOC). The course surveys indicate a positive
- 9. 9 correlation between use of the GIS tool and student engagement.2 16 course sessions took place during the research period, serving more than 400 students. During the first four weeks of the course the students learn about the Navy Planning Process and how to function as members of a MOC staff. The final week consists of a five day “battle problem” during which the students apply the skills they have learned over the previous four weeks to coordinate activities of multinational naval forces in and around the Straits of Malacca in order to manage the complex problem set constituted by piracy and armed robbery at sea. January 2015 saw a major revision of the course scenario, requiring changes to the GIS content. The modification of the GIS necessitated by this change provided additional insight into the utility of the GIS as a teaching tool for multiple organization training. This case study focuses on the combatting piracy and armed robbery at sea component of the course. Educating students on piracy and armed robbery at sea, and activities to counter these illicit actors in the Straits of Malacca, requires transmission of multiple content areas to students and employment of multiple processes by the students. In order to ensure the students possess the appropriate grasp of the GIS tool, a case book containing detailed information necessary to make sense of the scenario environment portrayed on the GIS is given to the students.3 In addition, the faculty delivers lectures to students that highlight critical case study book content and reinforce awareness of key concepts. For example, a lecture delivered by the Malacca Straits Patrol liaison officer provides insight into the nature of the criminal activity in the maritime environment problems the students will have to deal with, including definitions and discussion of armed robbery at sea and piracy, descriptions of the legal jurisdictions, corresponding authorities, and the criticality of the distinction between territorial and international waters within which the various organizations operate. Texts describing the capabilities and limitations (operational, legal, fiscal, etc.) of the organizations in the engagement space (including the Malacca Strait Patrols, Malaysian Maritime Enforcement Agency, Royal Malaysian Navy, Singapore Defense Forces, Singapore Port Authority, Tentara Nasional Indonesia Angkatan Laut, TNI–AL (Indonesian Navy), Indonesian Coast Guard, and the Regional Cooperation Agreement on Combating Piracy 2 The survey results for Question 1 Section 13 “Adequacy of instruction and application of IT tools (CAS/GNN/Facebook web sites, Google Earth, Mirc Chat, Adobe Connect, etc.” From Class 15-01 to 16-01 the average score was 4.31 out of 5. 3 Discussion of the scenario in which the GIS is embedded is beyond the scope of this paper.
- 10. 10 and Armed Robbery against Ships in Asia (ReCAAP)) are also provided. Links to the organization’s homepages are available within the GIS, facilitating later dedicated study by individual students as they work through the scenario. Faculty also explains how to access, manipulate and create content within the GIS. This explanation includes discussion of overlays indicating specific characteristic of the environment, such as traffic control schemes, shallow waters, fishing areas, wildlife preserves, and operating areas. It also includes instruction on how to create overlays. With the introduction complete, the students are shown where the GIS resides on the computer system. They are then encouraged to explore the faculty provided content and produce their own as they progress through the course of instruction. By embedding multiple forms of content, from multiple sources (from own, partner, other and adversary organizations) in the geographic context the GIS helps students surface complex interactions and discern multiple order effects. Unlike receiving a handout of papers to read, or links to content in a web- based environment, the GIS information is embedded in the geographic context in which it becomes meaningful. For example, each act of piracy is indicated by an icon, and a description of the attack (the techniques used by the illicit actors) is added to the icon so that when students click on the vessel name a pop up box provides a complete description of what happened. (See figure 2). Figure 2 Clicking on the Easter Star icon provides additional information about the pirate attack.
- 11. 11 Without any further effort by the faculty, the placement of the icon enables the students to consider which organization should respond, challenges (such as distance, legal considerations, forces available, etc.) the responders will face, other physical or environmental factors that might explain why the attack occurred when, where, and how it did (at an anchorage, outside busy sea lanes, or using the busy sea lines as a cover) and the potential jurisdictional seams the illicit actors may be attempting to exploit. The placement of the icon, with an explanatory text, thus engages the student’s mind and evokes active application of the content they were provided in the academic sessions, case study book, lectures and GIS introduction. Additional icons provide information about the various organizations active in the engagement space, enabling the students to at a glance gain an appreciation of the complexity of the counter piracy and armed robbery at sea task set. Other geographically relevant overlays, such as national borders and the traffic separation scheme, remind the students that their activities must interfere as little as possible with the traffic (1000+ ships daily) flowing through this major world trade artery. Visual display of content from multiple organizations via icons embedded in the GIS context enables the vertical and horizontal linkage of content about a region, enriching the views just as a collection of different lenses creates a series of pictures, each contributing a particular insight. Vertically, multiple organizations contribute their particular understanding of an environmental component. The aggregation of views from multiple organizations also illuminates feedback linkages that otherwise may lie outside the purview of any single organization, and thus remain invisible. Horizontally, multiple organizations in the space contribute their insights about the wide variety of elements in the environment. As shown in figure 3, the unique contributions of the various groups fill in the knowledge gaps, creating a more comprehensive degree of understanding amongst all participants and thus yielding cumulative understanding greater than that which any single organization can individually achieve.
- 12. 12 Figure 3 This additive process of content exposure stimulates student content analysis in ways similar to that required by their professional engagement with the same issues. For example, in training involving multiple organizations, or divisions within the same organization, the GIS tool enables the embedding of standard operating procedures in the location where they are employed. This emphasizes to students the real world implications of organizational authorities and jurisdictional boundaries, revealing both potential conflicts and areas ripe for reaping gains from collaboration. As Schuurman explains, “the visuality of results, …, allows for intuitive or structured exploration of cofactors.” (Schuurman, 2004). The tool thus provides the perspectives of the various stakeholders who have interests in, and capabilities for, dealing with an issue by for example, linking the standard operating procedures for port security of three organizations with overlapping responsibilities for port management to the port in the GIS. The GIS also illuminates correlations and potential causal linkages between activities and events and how activities unfold over time. For example, the preponderance of attacks in the beginning of the MSOC scenario consists of armed robbery of ship’s crew personal possessions and petty cash. As time goes on, fuel theft and vessel hijacking constitute the bulk of attacks. (See Figure 4)
- 13. 13 Figure 4 This stimulates students to shift their approach to address the evolving threat. The effectiveness, or ineffectiveness, of student action is indicated through decrease or increase in attacks and changes in their location (to areas outside of present student activity if students are effective, or activity spreading indiscriminately if students are ineffective) on the GIS. The tool thus allows for real time, visual feedback to the students, further enriching the student learning experience. Section 3: Advantages generated by GIS use in training and exercises Use of the GIS systems addresses how students receive, produce, use, consume and distribute information, and thus how they learn in four ways. First, use of a GIS allows for transmission of content the students need to acquire in accordance with the learning objectives without reliance on one way delivery in which the students are passive receivers of information. From an learning theory perspective, GIS is a product of what Marshall McLuhan described in his 1966 edition of Understanding Media: The Extensions of Man as a “New age of education that is programmed for discovery rather than instruction.” (McLuhan, 1966) The utility of the shift in emphasis from instruction to student discovery is sharpened by the additional realization that while well delivered presentations remain effective methods for information transfer, not all trainers are effective presenters. Presentation inadequacies slow learning as students become impatient for the reader to
- 14. 14 finish speaking and attention wanders. The negative effects on learning of poor presentations are magnified in multi-organizational settings, where people are forced to process unfamiliar jargon, and in some cases learn in a language other than their first. The GIS provided rich visual interface within which students can interact provides a low cost means for facilitating multi-organizational learning through discovery (not passive receipt of lectures from the “sage on the stage”) and allows self- navigating student experience that enhances student autonomy and thus engagement with the both the content and processes constituting the course subject matter. Second, GIS generate a context rich and relevant experience space in which to make mistakes and experience the consequences of those mistakes in a “cost free” way. For example, errors in organizing resources (such as ships or aircraft) in terms of time and space can have far reaching impacts. A platform placed in area A is no longer available to generate effects in areas B or C. Students can see on the GIS how their plan succeeds or fails to produce the desired outcomes. This allowance for error based learning aids students in avoiding similar mistakes during actual operations. Third, location in space can illuminate potential areas of interaction by organizations on a spectrum ranging from non-interference, to coordination, to (if desired) close collaboration or outright interference. The GIS display enables visualization of geographic relationships that offer the potential to generate value for or pose challenges to each organization involved and thus surfaces the nature of existing agency relationships within the engagement space. On the value generating side, geographic proximity can, if appropriate, be operationalized into effective interaction through organizational effort. For example, persistent spatial interaction can lead to closer organizational operational relationships, generating beneficial second and third order effects, such as, in this age of extreme fiscal scarcity, combined capability development. Fourth, GIS supports collaborative learning within as well as across organizations. Training systems designed to meet very specific organizational needs are useful, but from a multi-organizational training perspective often generate training overhead costs that exceed the benefits, especially when the multi- organization training requirement is short term and thus cannot justify investment in creation of a collaborative training system. The use of free, widely available GIS programs reduces friction points (such
- 15. 15 software requirements and lack of compatible information technology systems) associated with multi- organizational training. Section 4: Disadvantages generated by GIS use in training and exercises GIS use in training and exercises is not without disadvantages. From the faculty perspective, the primary disadvantage of using the GIS is the load it places on instructor time. Building PowerPoint presentations is much faster and easier than creating the individual layers on the GIS. On the student side, extracting additional time from an already crowded training schedule to provide instruction on the GIS system can be very difficult. Four additional disadvantages serve as limiting factors on GIS use in multi-organizational training and exercise situations: 1. Internet connectivity is required. In classroom settings this may not present a challenge. Field exercises may lack sufficient bandwidth for effective GIS tool use. 2. Dependence on the tool provider (Google for example) limits some uses of the tool and presents challenges, especially in regard to cyber security. 3. Lack of built in tools, such as shape creators and KML file editors, can limit the utility of the tool for training purposes. For example, drawing shapes on the map to indicate operating areas requires an additional software plug-in for Google Earth. 4. Distraction multiplication. Bad information, broken links and irrelevant content (such as pictures on the Panoramio photograph utility in Google Earth) either created by students or accessible through the GIS tool can distract students from the subject at hand. Section 5: Principles and Checklist for GIS use in training and exercises Based on the experience of 16 MSOC courses, the following principles for using GIS in multi- organizational training are offered for consideration by others who wish to use GIS to enrich their training and exercise events:
- 16. 16 1. Link GIS content and processes directly to the learning objectives. The learning objectives should bound the scope of the content and specific processes the GIS supports in order to properly manage the balance between investing time in development of the GIS tool and achievement of the overall course or exercise event objectives. 2. Determine early on the appropriate content delivery process and method, or in other words, the appropriate balance between faculty provision of information through lectures or handouts and student discovery through the GIS interface. 3. Ensure use of the GIS system is integrated with normal information and knowledge management (IKM) processes. Even if information and data is fictional, it should be portrayed via the same mechanisms through which students will acquire the actual data and information streams in the real world, not in a way that requires the students to learn processes applicable only in the training or exercise environment. 4. Build with the temporality of the use in mind by ensuring the information unfolds as students would normally expect to see it. This requires ensuring that information is revealed in its proper sequence. This can be the most tedious part of construction for faculty. Sequencing the revelation requires that a detailed picture of the entire training or exercise event is fleshed out completely before GIS construction commences. Based on these principles, a checklist for employing GIS is provided in Figure 5. Task Complete 1. Review learning objectives 2. Decide content delivery division (lecture, handout, embedded in GIS) 3. Determine content appropriate for GIS integration 4. Develop exploration interface (icons, shapes) 5. Determine what students find (built by faculty) and what they make (built by students) in the GIS. 6. Build faculty provided elements 7. Build guidance and “school solutions” to guide faculty in support of students as they build the required content 8. Provide introduction to the GIS for students 9. Guide student engagement
- 17. 17 Conclusion GIS capability, can at low cost, add significant enhancement to the student learning experience in terms of both content acquisition and process execution expertise. As smartphones make GIS like layers of information available as people move about in their daily lives, (through instant access to location based information and augmented reality) the opportunities for enhancing training through use of GIS systems will continue to grow. The principles described here will remain applicable for the expanded applications. CURTIN, L. B., FINN, L. A., CZOSNOWSKI, Q. A., WHITMAN, C. B. & CAWLEY, M. J. 2011. Computer-based Simulation Training to Improve Learning Outcomes in Mannequin based Simulation Exercises. American Journal of Pharmaceutical Education, 75, 113. DEMERS, M. N. 2003. Fundamentals of Geographic Information Systems, Hoboken, NJ, John Wiley & Sons, Inc. HESS, E. D. 2014. Learn or Die: Using Science to Build a Leading-Edge Learning Organization. New York: Columbia University Press. KERSKI, J. 2003. The Implementation and Effectiveness of Geographic Information Systems Technology and Methods in Secondary Education. Journal of Geography, 128-137. KLEIN, G. 2013. Seeing what others don't: the Remarkable ways we gain insights, NY, NY, Public Affairs. KNOWLES, M. S., III, E. F. H. & SWANSON, R. A. 2005. The Adult Learner, United States, Elsevier. MCLUHAN, M. 1966. Understanding Media: The Extensions of Man, New York, McGraw-Hill Paperbacks. SCHUURMAN, N. 2004. GIS: A short Introduction, Bodmin, Cornwall, UK, Blackwell Publishing Ltd. SIMON, H. A. 1996. The Sciences of the Artificial, Cambridge, MIT Press. TOOTH, S. 2015. Google Earth as a Resource. Geography, 100, 51-56.