Isweek opc-n2
•
0 likes•86 views

Alphasense PM2.5 Particle Monitor - OPC-N2 http://www.isweek.com/product/alphasense-pm2-5-particle-monitor-opc-n2_1828.html

Recommended
More Related Content
What's hot
What's hot (19)
Similar to Isweek opc-n2
Similar to Isweek opc-n2 (20)
Recently uploaded
Recently uploaded (20)
Isweek opc-n2
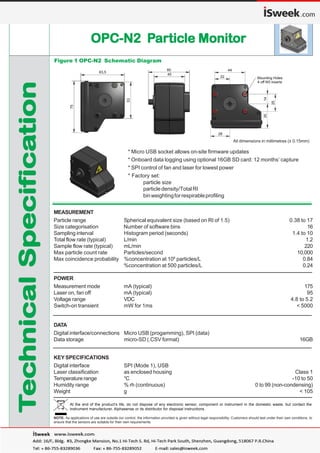
- 1. MEASUREMENT Particle range Spherical equivalent size (based on RI of 1.5) 0.38 to 17 Size categorisation Number of software bins 16 Sampling interval Histogram period (seconds) 1.4 to 10 Total flow rate (typical) L/min 1.2 Sample flow rate (typical) mL/min 220 Max particle count rate Particles/second 10,000 Max coincidence probability %concentration at 106 particles/L 0.84 %concentration at 500 particles/L 0.24 POWER Measurement mode mA (typical) 175 Laser on, fan off mA (typical) 95 Voltage range VDC 4.8 to 5.2 Switch-on transient mW for 1ms < 5000 DATA Digital interface/connections Micro USB (progamming), SPI (data) Data storage micro-SD (.CSV format) 16GB KEYSPECIFICATIONS Digital interface SPI (Mode 1), USB Laser classification as enclosed housing Class 1 Temperature range °C -10 to 50 Humidity range % rh (continuous) 0 to 99 (non-condensing) Weight g < 105 Figure 1 OPC-N2 Schematic Diagram NOTE: As applications of use are outside our control, the information provided is given without legal responsibility. Customers should test under their own conditions, to ensure that the sensors are suitable for their own requirements. At the end of the product’s life, do not dispose of any electronic sensor, component or instrument in the domestic waste, but contact the instrument manufacturer, Alphasense or its distributor for disposal instructions. OPC-N2 POPC-N2 POPC-N2 POPC-N2 POPC-N2 Parararararticticticticticle Monitorle Monitorle Monitorle Monitorle Monitor TTTTTececececechnicalSpecifhnicalSpecifhnicalSpecifhnicalSpecifhnicalSpecificaicaicaicaicationtiontiontiontion * Micro USB socket allows on-site firmware updates * Onboard data logging using optional 16GB SD card: 12 months’ capture * SPI control of fan and laser for lowest power * Factory set: particle size particle density/Total RI binweightingforrespirableprofiling All dimensions in millimetres (± 0.15mm)
- 2. OPC-N2 POPC-N2 POPC-N2 POPC-N2 POPC-N2 Perferferferferformance Daormance Daormance Daormance Daormance Datatatatata TTTTTececececechnicalSpecifhnicalSpecifhnicalSpecifhnicalSpecifhnicalSpecificaicaicaicaicationtiontiontiontion Figure 2 Particle size derivative comparison The OPC correlates well whenvalidatedwithGrimmand TSI instruments. Figure 3 shows the OPC-N2 particle size distribution for a calibration aerosol. Figure 3 Particle size distribution for 5 mm alumina (Spherisorb) as displayed on PC, direct from the OPC-N2. Figure 4 TSI 3300 Particle size count for 5um Alumina (Spherisorb) Figure 4 shows the TSI 3300 displayed particle size distribution for the same calibration aerosol, as measured by University of Hertfordshire. Calculated PM from particle size includes assumptions about particle density and refractive index which will vary with application. 0 1 2 3 4 0.3 0.5 1 2 3 4 5 8 10 Size (µm) #/cm 3 (e2) 0.3 0.5 1 2 3 4 5 7 10