SlideShare a Scribd company logo
1 of 38
Download to read offline
INTERNET OF THINGS 18CS81
AnithaMCAsst.Prof DEPT. OF ISE,SVIT Page 1
MODULE – 1
1.1 What Is IoT?
A world where everything is online and communicating to other things and people to enhance people’s
lives like self-driving drones and sensors for monitoring your health, is collectively known as the
Internet of Things (IoT).
Basic goal of IoT : “connect the unconnected.”
This means that objects not currently joined to the Internet will be connected so that they can
communicate and interact with people and other objects.
 IoT allow to sense and control the physical world by making objects smarter and connecting
them through an intelligent network.
 Integration between the physical world and computers allows for improvements in efficiency,
accuracy, automation, and the enablement of advanced applications.
IoT should be viewed as an umbrella of various concepts, protocols, and technologies, which are
designed to create new products as well as new challenges, such as scaling vast amounts of data that
need to be processed.
1.2 GENESIS OF IOT
The IoT started between the years 2008 and 2009. “Internet of Things” is invented by Kevin Ashton.
Kevin quoted as saying: “In the 20th century, computers were brains without senses—they only knew
what we told them.” Computers depended on humans to input data and knowledge. But in the 21st
century, computers are sensing things too.
The evolution of the Internet can be categorized into four phases:
INTERNET OF THINGS 18CS81
AnithaMCAsst.Prof DEPT. OF ISE,SVIT Page 2
Internet Phases Definition
1. Connectivity
( Digitize access )
 Connect people using email, web services…
 Search and access the information
2. Networked Economy
( Digitize business )
 Enable e-commerce and supply-chain enhancements
 Collaborative engagement to increase efficiency
3. Immersive Experiences
( Digitize interactions )
 Extend Internet using social media while always being
connected through mobility.
 Most applications are cloud-based.
4. Internet of Things
( Digitize the world )
 Connect objects and machines in real world.
 Enable connecting the unconnected.
1.3 IOT AND DIGITIZATION
IoT is focused on connecting “things” to Internet.
Example:Wi-Fi location tracking in shopping mall
“things” Wi-Fi devices
Operation Tracking consumer location to understand how much time they spend in
different parts of a mall or store through their smart phone.
Advantages Changing locations of product displays and advertising, shops, rent to charge
and security positions.
Digitization is the conversion of information into a digital format. It is focused on connecting “things”
with its data and business result.
Example:Digitization of Photography
“things” Digital camera
Advantages No need retailer to develop film and better capturing of images.
Example: Digitization of Taxi services
“things” Taxi Driver device, Rider mobile
Advantages Mobile app identifies cab, driver and fare. The rider pays fare through app.
In the context of IoT, digitization brings together things, data, and business process to make
networked connections more relevant and valuable.
Example: “Nest” home automation
The sensors determine desired climate settings and other smart objects, such as smoke alarms, video
cameras, and other third-party devices. The devices and their functions are managed and controlled
together and could provide the holistic experience.
Smart objects and increased connectivity drive digitization, and thus many companies, countries, and
governments are embracing this growing trend.
INTERNET OF THINGS 18CS81
AnithaMCAsst.Prof DEPT. OF ISE,SVIT Page 3
1.4 IOT IMPACT
Managing and monitoring smart objects using real-time connectivity enables a whole new level of data
driven decision making. This is turn results in the optimization of systems and processes and delivers
new services that save time for both people and businesses while improving the overall quality of life.
The following examples illustrate some of the benefits of IOT and their impact.
1.4.1 Connected roadways
While self-driving car is now becoming a reality with well-known projects like Google’s self-driving
car, IoT is a necessary component for implementing a fully connected transportation infrastructure.
IoT
 provide better interaction with the transportation system through bidirectional data exchanges
 provide important data to the riders.
 provide reliable communications and data from transportation-related sensors.
A self-driving car designed by Google operations:
 Basic sensors in cars monitor oil pressure, tire pressure, temperature, and other core car
functions.
 The driver can access these data while controlling the car using equipment such as a steering
Managing and monitoring smart objects using real-time connectivity enables data-driven decision
making which results in the optimization of systems and processes and delivers new services that
save time while improving the overall quality of life.
The following examples illustrate some of the benefits ofIoT and their impact:
INTERNET OF THINGS 18CS81
AnithaMCAsst.Prof DEPT. OF ISE,SVIT Page 4
wheel, pedals, and so on.
 The driver will understand, handle, and make critical decisions while concentrating on
driving safely.
INTERNET OF THINGS 18CS81
AnithaMCAsst.Prof DEPT. OF ISE,SVIT Page 5
 IP-enabled sensors allow easy communication with other systems both inside and outside the
car.
 Sensors and communication technologies vehicles to “talk” to other vehicles, traffic signals,
school zones, and other elements of the transportation infrastructure.
Transportation challenges can be classified into the three categories:
Challenges Description
Safety IoT enabled technologies enable drivers to avoid crashes.
Reduce number of lives lost each year
Mobility Enable operators and drivers to make informed decisions
Reduce travel delays
Communication between vehicles and traffic management optimize routing of
vehicles
Environment Reduces CO2 emissions by reducing travel times
Provides real-time information
Benefits of connected roadways :
i. reduced traffic jams and urban congestion
ii. decreased casualties and fatalities
iii. increased response time for emergency vehicles
iv. reduced vehicle emissions
IoT applications in connected roadways-
a) Intersection Movement Assist (IMA) - warns a driver (or a self-driving car) when it is not safe
to enter an intersection due to a high probability of a collision.
b) Automated vehicle tracking - a vehicle’s location is used for notification of arrival times, theft
prevention, or highway assistance.
c) Cargo management- provides precise positioning of cargo as it is enroute so that notification
alerts can be sent to a dispatcher and routes can be optimized for congestion and weather.
d) Road weather communications- use sensors and data from satellites, roads, and bridges to warn
vehicles of dangerous conditions or inclement weather on the current route.
A connected car is capable of generating continuous data related to location, performance, driver
behavior, and much more, which will generate more than 25 GB of data per hour, which will be sent
to the cloud.
Considering number of hours a car is driven per ,the number of cars on the road, and amount
of data generated by connected car, transmitted, and stored in the cloud will be in the zettabytes per
year.
INTERNET OF THINGS 18CS81
AnithaMCAsst.Prof DEPT. OF ISE,SVIT Page 6
- How the data generated by a car will be used by third parties?
 Tire companies can collect data related to use and durability of their products in real time.
 Automobile manufacturers collect to better understand how the cars are driven, when parts
are starting to fail, or whether the car has broken down to build better cars in the future.
In the future, car sensors will be able to interact with third-party applications, such as GPS/maps, to
enable dynamic rerouting to avoid traffic, accidents, and other hazards. Similarly, Internet-based
entertainment, including music, movies, and other streamings or downloads, can be personalized and
customized to optimize a road trip.
This data will also be used for targeted advertising. As GPS navigation systems become more
integrated with sensors and wayfinding applications, it will become possible for personalized routing
suggestions to be made. For example, if it is known that you prefer a certain coffee shop, through the
use of a cloud-based data connector, the navigation system will be able to provide routing suggestions
that have you drive your car past the right coffee shop.
Connected roadways are likely to be one of the biggest growth areas for innovation. Automobiles and
the roads they use have seen incredible change over the past century, but the changes ahead of us are
going to be just as astonishing. In the past few years alone, we have seen highway systems around the
world adopt sophisticated sensors systems that can detect seismic vibrations, car accidents, severe
weather conditions, traffic congestion, and more. Recent advancements in roadway fiber-optic sensing
technology is now able to record not only how many cars are passing but their speed and type.
INTERNET OF THINGS 18CS81
AnithaMCAsst.Prof DEPT. OF ISE,SVIT Page 7
1.4.2 Connected Factory
The main challenges facing manufacturing in a factory:
 Accelerating new product and service introductions to meet customer and market
opportunities
 Increasing plant production, quality, and uptime while decreasing cost
 Mitigating unplanned downtime (which wastes, on average, at least 5% of production)
 Securing factories from cyber threats
 Decreasing high cabling and re-cabling costs (up to 60% of deployment costs)
 Improving worker productivity and safety
A convergence of factory-based operational technologies and architectures with global IT networks is
referred to as the connected factory.
Sensors communicate using the Internet Protocol (IP) over an Ethernet infrastructure. They transmit
and receive large quantities of real-time informational and diagnostic data. More IP-enabled devices
such as video cameras, diagnostic smart objects, and even personal mobile devices, are being added to
the manufacturing environment.
For example, a smelting facility extracts metals from their ores. The facility uses both heat and
chemicals to decompose the ore, leaving behind the base metal. This is a multistage process, and the
data and controls are all accessed via various control rooms in a facility.
Example: real-time location system (RTLS).
An RTLS utilizes small and easily deployed Wi-Fi RFID tags that attach to virtually any material and
provide real-time location and status. These tags enable a facility to track production as it happens.
These IoT sensors allow components and materials on an assembly line to “talk” to the network. If
each assembly line’s output is tracked in real time, decisions can be made to speed up or slow
production to meet targets, and it is easy to determine how quickly employees are completing the
various stages of production. Bottlenecks at any point in production and quality problems are also
quickly identified.
INTERNET OF THINGS 18CS81
AnithaMCAsst.Prof DEPT. OF ISE,SVIT Page 8
The IoT wave of Industry 4.0 takes manufacturing from a purely automated assembly line model of
production to a model where the machines are intelligent and communicate with one another. IoT in
manufacturing brings with it the opportunity for inserting intelligence into factories. This starts with
creating smart objects, which involves embedding sensors, actuators, and controllers into just about
everything related to production.
1.4.3 Smart Connected Buildings
Another place IoT is making a disruptive impact is in the smart connected buildings space. In the past
several decades, buildings have become increasingly complex, with systems overlaid one upon
another, resulting in complex intersections of structural, mechanical, electrical, and IT components.
Over time, these operational networks that support the building environment have matured into
sophisticated systems; however, for the most part, they are deployed and managed as separate systems
that have little to no interaction with each other.
The function of a building is to provide a work environment that keeps the workers comfortable,
efficient, and safe. Work areas need to be well lit and kept at a comfortable temperature. To keep
workers safe, the fire alarm and suppression system needs to be carefully managed, as do the door and
physical security alarm systems.
Motion detection occupancy sensors work great if everyone is moving around in a crowded
room and can automatically shut the lights off when everyone has left, but what if a person in the room
is out of sight of the sensor? It is a frustrating matter to be at the mercy of an unintelligent sensor on
the wall that wants to turn off the lights on you.
Similarly, sensors are often used to control the heating, ventilation, and air-conditioning (HVAC)
system. Temperature sensors are spread throughout the building and are used to influence the building
management system’s (BMS’s) control of air flow into a room.
Before you can bring together heterogeneous systems, they need to converge at the network layer and
support a common services layer that allows application integration. For example, the de facto
communication protocol responsible for building automation is known as BACnet (Building
Automation and Control Network). In a nutshell, the BACnet protocol defines a set of services that
allow Ethernet-based communication between building devices such as HVAC, lighting, access
control, and fire detection systems. The same building Ethernet switches used for IT may also be used
for BACnet. This standardization also makes possible an intersection point to the IP network (which
is run by the IT department) through the use of a gateway device. In addition, BACnet/IP has been
defined to allow the “things” in the building network to communicate over IP, thus allowing closer
consolidation of the building management system on a single network. Figure 1-7 illustrates the
conversion of building protocols to IP over time.
INTERNET OF THINGS 18CS81
AnithaMCAsst.Prof DEPT. OF ISE,SVIT Page 9
Another promising IoT technology in the smart connected building, and one that is seeing widespread
adoption, is the “digital ceiling.” The digital ceiling is more than just a lighting control system. This
technology encompasses several of the building’s different networks—including lighting, HVAC,
blinds, CCTV (closed-circuit television), and security systems—and combines them into a single IP
network. Figure 1-8 provides a framework for the digital ceiling.
Central to digital ceiling technology is the lighting system. As you are probably aware, the lighting
market is currently going through a major shift toward light-emitting diodes (LEDs). Compared to
traditional lighting, LEDs offer lower energy consumption and far longer life. The lower power
requirements of LED fixtures allow them to run on Power over Ethernet (PoE), permitting them to be
INTERNET OF THINGS 18CS81
AnithaMCAsst.Prof DEPT. OF ISE,SVIT Page 10
connected to standard network switches.
In a digital ceiling environment, every luminaire or lighting fixture is directly network-attached, providing
control and power over the same infrastructure. This transition to LED lighting means that a single
converged network is now able to encompasses luminaires that are part of consolidated building
management as well as elements managed by the IT network, supporting voice, video, and other data
applications.
The energy savings value of PoE-enabled LED lighting in the ceiling is clear. However, having an IP-
enabled sensor device in the ceiling at every point people may be present opens up an entirely new set
of possibilities. For example, most modern LED ceiling fixtures support occupancy sensors. These
sensors provide high-resolution occupancy data collection, which can be used to turn the lights on and
off, and this same data can be combined with advanced analytics to control other systems, such as
HVAC and security.
1.4.4 Smart Creatures
One of the most well-known applications of IoT with respect to animals focuses on what is often
referred to as the “connected cow.” Sparked, a Dutch company, developed a sensor that is placed in a
cow’s ear. The sensor monitors various health aspects of the cow as well as its location and transmits
the data wirelessly for analysis by the farmer.
The data from each of these sensors is approximately 200 MB per year, and you obviously need a
network infrastructure to make the connection with the sensors and store the information. Once the
data is being collected, however, you get a complete view of the herd, with statistics on every cow.
You can learn how environmental factors may be affecting the herd as a whole and about changes in
diet. This enables early detection of disease as cows tend to eat less days before they show symptoms.
These sensors even allow the detection of pregnancy in cows.
Another application of IoT to organisms involves the placement of sensors on roaches. Researchers at
North Carolina State University are working with Madagascar hissing cockroaches in the hopes of
helping emergency personnel rescue survivors after a disaster. An electronic backpack attaches to a
roach. This backpack communicates with the roach through parts of its body. Low-level electrical
pulses to an antenna on one side makes the roach turn to the opposite side because it believes it is
encountering an obstacle. The cerci of the roach are sensory organs on the abdomen that detect danger
through changing air currents. When the backpack stimulates the cerci, the roach moves forward
because it thinks a predator is approaching.
1.5 CONVERGENCE OF IT AND OT
IT supports connections to the Internet along with related data and technology systems and is focused
on the secure flow of data across an organization.
OT monitors and controls devices and processes on physical operational systems. These systems
include assembly lines, utility distribution networks, production facilities, roadway systems, and many
more.
INTERNET OF THINGS 18CS81
AnithaMCAsst.Prof DEPT. OF ISE,SVIT Page 11
Table 1-3 highlights some of the differences between IT and OT networks and their various challenges.
With the rise of IoT and standards-based protocols, such as IPv6, the IT and OT worlds are converging
or, more accurately, OT is beginning to adopt the network protocols, technology, transport, and
methods of the IT organization, and the IT organization is beginning to support the operational
requirements used by OT. When IT and OT begin using the same networks, protocols, and processes,
there are clear economies of scale. Not only does convergence reduce the amount of capital
infrastructure needed but networks become easier to operate, and the flexibility of open standards
allows faster growth and adaptability to new technologies.
INTERNET OF THINGS 18CS81
AnithaMCAsst.Prof DEPT. OF ISE,SVIT Page 12
With the merging of OT and IT, improvements are being made to both systems. OT is looking more
toward IT technologies with open standards, such as Ethernet and IP. At the same time, IT is becoming
more of a business partner with OT by better understanding business outcomes and operational
requirements.
The overall benefit of IT and OT working together is a more efficient and profitable business due to
reduced downtime, lower costs through economy of scale, reduced inventory, and improved delivery
times. When IT/OT convergence is managed correctly, IoT becomes fully supported by both groups.
This provides a “best of both worlds” scenario, where solid industrial control systems reside on an
open, integrated, and secure technology foundation.
1.6 IOT CHALLENGES
INTERNET OF THINGS 18CS81
AnithaMCAsst.Prof DEPT. OF ISE,SVIT Page 13
1.7 DRIVERS BEHIND NEW NETWORK ARCHITECTURES
While the architect has extensive experience in designing homes, those skills will clearly not be enough
to meet the demands of this new project. The scale of the stadium is several magnitudes larger, the use
is completely different, and the wear and tear will be at a completely different level. The architect
needs a new architectural approach that meets the requirements for building the stadium.
The key difference between IT and IoT is the data. While IT systems are mostly concerned with reliable
and continuous support of business applications such as email, web, databases, CRM systems, and so
on, IoT is all about the data generated by sensors and how that data is used. The essence of IoT
architectures thus involves how the data is transported, collected, analyzed, and ultimately acted upon.
Table 2-1 takes a closer look at some of the differences between IT and IoT networks, with a focus on
the IoT requirements that are driving new network architectures, and considers what adjustments are
needed.
INTERNET OF THINGS 18CS81
AnithaMCAsst.Prof DEPT. OF ISE,SVIT Page 14
Scale
 The scale of a typical IT network is on the order of several thousand devices—typically
printers, mobile wireless devices, laptops, servers, and so on.
 IoT introduces a model where an average-sized utility, factory, transportation system, or city
could easily be asked to support a network of this scale.
 Based on scale requirements of this order, IPv6 is the natural foundation for the IoT network
layer.
Security
 targeted malicious attacks using vulnerabilities in networked machines, such as the outbreak
of the Stuxnet worm, which specifically affected Siemens programmable logic controller
(PLC) systems.
 Protecting corporate data from intrusion and theft is one of the main functions of the IT
department. IT departments go to great lengths to protect servers, applications, and the
The following sections expand on the requirements driving specific architectural changes for IoT.
INTERNET OF THINGS 18CS81
AnithaMCAsst.Prof DEPT. OF ISE,SVIT Page 15
network, setting up defense-in-depth models with layers of security designed to protect the
cyber crown jewels of the corporation.
 IoT endpoints are often located in wireless sensor networks that use unlicensed spectrum and
are not only visible to the world through a spectrum analyzer but often physically accessible
and widely distributed in the field.
For optimum security, IoT systems must:
 Be able to identify and authenticate all entities involved in the IoT service
 Ensure that all user data shared between the endpoint device and back-end applications is
encrypted
 Comply with local data protection legislation so that all data is protected and stored correctly
 Utilize an IoT connectivity management platform and establish rules-based security policies
so immediate action can be taken if anomalous behavior is detected from connected devices
 Take a holistic, network-level approach to security
Constrained Devices and Networks
 Most IoT sensors have limited power, CPU, and memory, and they transmit only when there
is something important.
 Because of the massive scale of these devices and the large, uncontrolled environments where
they are usually deployed, the networks that provide connectivity also tend to be very lossy and
support very low data rates.
 IoT requires a new breed of connectivity technologies that meet both the scale and constraint
limitations.
Data
 In IoT the data is like gold, as it is what enables businesses to deliver new IoT services that
enhance the customer experience, reduce cost, and deliver new revenue opportunities.
 Although most IoT-generated data is unstructured, the insights it provides through analytics
can revolutionize processes and create new business models.
 IoT systems are designed to stagger data consumption throughout the architecture, both to filter
and reduce unnecessary data going upstream and to provide the fastest possible response to
devices when necessary.
Legacy Device Support
 In OT systems, end devices are likely to be on the network for a very long time—sometimes
decades. As IoT networks are deployed, they need to support the older devices already present
on the network, as well as devices with new capabilities.
 In many cases, legacy devices are so old that they don’t even support IP.
 IoT network must either be capable of some type of protocol translation or use a gateway device
to connect these legacy endpoints to the IoT network.
INTERNET OF THINGS 18CS81
AnithaMCAsst.Prof DEPT. OF ISE,SVIT Page 16
1.9 COMPARING IOT ARCHITECTURES
The aforementioned challenges and requirements of IoT systems have driven a whole new discipline
of network architecture. In the past several years, architectural standards and frameworks have
emerged to address the challenge of designing massive-scale IoT networks.
The foundational concept in all these architectures is supporting data, process, and the functions that
endpoint devices perform. Two of the best-known architectures are those supported by oneM2M and
the IoT World Forum (IoTWF), discussed in the following sections.
The one M2M IoT Standardized Architecture
oneM2M’s framework focuses on IoT services, applications, and platforms which include smart
metering applications, smart grid, smart city automation, e-health, and connected vehicles.
One of the greatest challenges in designing an IoT architecture is dealing with the heterogeneity of
devices, software, and access methods. By developing a horizontal platform architecture, oneM2M is
developing standards that allow interoperability at all levels of the IoT stack. oneM2M’s horizontal
framework and RESTful APIs allow the LoRaWAN system to interface with the building management
system over an IoT network, thus promoting end-to-end IoT communications in a consistent way, no
matter how heterogeneous the networks.
Applications layer:
 It includes the application-layer protocols and attempts to standardize northbound API
definitions for interaction with business intelligence (BI) systems.
 Applications tend to be industry-specific and have their own sets of data models, and thus
they are shown as vertical entities.
INTERNET OF THINGS 18CS81
AnithaMCAsst.Prof DEPT. OF ISE,SVIT Page 17
Services layer:
 The horizontal modules include the physical network that the IoT applications run on, the
underlying management protocols, and the hardware. Examples include backhaul
communications via cellular, MPLS networks, VPNs, and so on.
 This conceptual layer adds APIs and middleware supporting third-party services and
applications.
 One of the stated goals of oneM2M is to “develop technical specifications which address the
need for a common M2M Service Layer that can be readily embedded within various hardware
and software nodes, and rely upon connecting the myriad of devices in the field area network
to M2M application servers, which typically reside in a cloud or data center.”
Network layer:
 It includes the devices and the communications infrastructure which include wireless mesh
technologies, such as IEEE 802.15.4, and wireless point-to-multipoint systems, such as IEEE
801.11ah.
 Also included are wired device connections, such as IEEE 1901 power line communications.
 The device domain includes the gateway device, which provides communications up into the
core network and acts as a demarcation point between the device and network domains.
IoT World Forum (IoTWF) Standardized Architecture
The seven layers of the IoT Reference Model:
Layer 1: Physical Devices and Controllers Layer
 This layer is home to the “things” in the Internet of Things, including the various endpoint
devices and sensors that send and receive information.
 The primary function is generating data and being capable of being queried and/or controlled
over a network.
INTERNET OF THINGS 18CS81
AnithaMCAsst.Prof DEPT. OF ISE,SVIT Page 18
Layer 2: Connectivity Layer
The primary function of this IoT layer is the reliable and timely transmission of data.
The connectivity layer encompasses all networking elements of IOT and doesn’t really distinguish
between the last mile network
Layer 3: Edge Computing Layer
At this layer, the emphasis is on data reduction and converting network data flows into information
that is ready for storage and processing by higher layers.
One of the basic principles of this reference model is that information processing is initiated as early
and as close to the edge of the network as possible.
INTERNET OF THINGS 18CS81
AnithaMCAsst.Prof DEPT. OF ISE,SVIT Page 19
Upper Layers: Layers 4–7
IT and OT Responsibilities in the IoT Reference Model
 The bottom of the stack is generally in the domain of OT. For an industry like oil and gas, this
includes sensors and devices connected to pipelines, oil rigs, refinery machinery, and so on.
 The top of the stack is in the IT area and includes things like the servers, databases, and
applications, all of which run on a part of the network controlled by IT.
 At the bottom, in the OT layers, the devices generate real-time data at their own rate—
sometimes vast amounts on a daily basis.
INTERNET OF THINGS 18CS81
AnithaMCAsst.Prof DEPT. OF ISE,SVIT Page 20
Additional IoT Reference Models
1.10 A SIMPLIFIED IOT ARCHITECTURE
INTERNET OF THINGS 18CS81
AnithaMCAsst.Prof DEPT. OF ISE,SVIT Page 21
Nearly every published IoT model includes core layers including “things,” a communications network,
and applications. However, unlike other models, the framework presented here separates the core IoT
and data management into parallel and aligned stacks, allowing you to carefully examine the functions
of both the network and the applications at each stage of a complex IoT system. This separation gives
you better visibility into the functions of each layer.
The presentation of the Core IoT Functional Stack in three layers is meant to simplify your
understanding of the IoT architecture into its most foundational building blocks. Of course, such a
simple architecture needs to be expanded on. The network communications layer of the IoT stack itself
involves a significant amount of detail and incorporates a vast array of technologies. Consider for a
moment the heterogeneity of IoT sensors and the many different ways that exist to connect them to a
network. The network communications layer needs to consolidate these together, offer gateway and
backhaul technologies, and ultimately bring the data back to a central location for analysis and
processing.
Unlike with most IT networks, the applications and analytics layer of IoT doesn’t necessarily exist
only in the data center or in the cloud. Due to the unique challenges and requirements of IoT, it is often
necessary to deploy applications and data management throughout the architecture in a tiered approach,
allowing data collection, analytics, and intelligent controls at multiple points in the IoT system. In the
model presented in this book, data management is aligned with each of the three layers of the Core IoT
Functional Stack.
The three data management layers are the edge layer (data management within the sensors themselves),
the fog layer (data management in the gateways and transit network), and the cloud layer (data
management in the cloud or central data center).
The communications layer is broken down into four separate sub-layers: the access network, gateways
and backhaul, IP transport, and operations and management sub-layers.
INTERNET OF THINGS 18CS81
AnithaMCAsst.Prof DEPT. OF ISE,SVIT Page 22
The applications layer of IoT networks is quite different from the application layer of a typical
enterprise network. Instead of simply using business applications, IoT often involves a strong big data
analytics component. One message that is stressed throughout that IoT is not just about the control of
IoT devices but, rather the useful insights gained from the data generated by those devices. Thus, the
applications layer typically has both analytics and industry-specific IoT control system components.
1.11 THE CORE IOT FUNCTIONAL STACK
IoT networks are built around the concept of “things,” or smart objects performing functions and
delivering new connected services. These objects are “smart” because they use a combination of
contextual information and configured goals to perform actions.
From an architectural standpoint, several components have to work together for an IoT network to be
operational:
A. “Things” layer: At this layer, the physical devices need to fit the constraints of the
environment in which they are deployed while still being able to provide the information
needed.
B. Communications network layer: When smart objects are not self-contained, they need to
communicate with an external system. In many cases, this communication uses a wireless
technology. This layer has four sublayers:
C. Access network sublayer: The last mile of the IoT network is the access network. This is
typically made up of wireless technologies such as 802.11ah, 802.15.4g, and LoRa. The sensors
connected to the access network may also be wired.
D. Gateways and backhaul network sublayer: A common communication system organizes
multiple smart objects in a given area around a common gateway. The gateway communicates
directly with the smart objects. The role of the gateway is to forward the collected information
through a longer-range medium (called the backhaul) to a headend central station where the
information is processed. This information exchange is a Layer 7 (application) function, which
is the reason this object is called a gateway. On IP networks, this gateway also forwards packets
from one IP network to another, and it therefore acts as a router.
E. Network transport sublayer: For communication to be successful, network and transport
layer protocols such as IP and UDP must be implemented to support the variety of devices to
connect and media to use.
F. IoT network management sublayer: Additional protocols must be in place to allow the
headend applications to exchange data with the sensors. Examples include CoAP and MQTT.
G. Application and analytics layer: At the upper layer, an application needs to process the
collected data, not only to control the smart objects when necessary, but to make intelligent
decision based on the information collected and, in turn, instruct the “things” or other systems
H. to adapt to the analyzed conditions and change their behaviors or parameters.
INTERNET OF THINGS 18CS81
AnithaMCAsst.Prof DEPT. OF ISE,SVIT Page 23
The following sections examine these elements and help you architect your IoT communication
network.
Layer 1: Things: Sensors and Actuators Layer
a) Battery-powered or power-connected: This classification is based on whether the object
carries its own energy supply or receives continuous power from an external power source.
Battery-powered things can be moved more easily than line-powered objects. However,
batteries limit the lifetime and amount of energy that the object is allowed to consume, thus
driving transmission range and frequency.
b) Mobile or static: This classification is based on whether the “thing” should move or always
stay at the same location. A sensor may be mobile because it is moved from one object to
another (for example, a viscosity sensor moved from batch to batch in a chemical plant) or
because it is attached to a moving object (for example, a location sensor on moving goods in a
warehouse or factory floor). The frequency of the movement may also vary, from occasional
to permanent. The range of mobility (from a few inches to miles away) often drives the possible
power source.
c) Low or high reporting frequency: This classification is based on how often the object should
report monitored parameters. A rust sensor may report values once a month. A motion sensor
may report acceleration several hundred times per second. Higher frequencies drive higher
energy consumption, which may create constraints on the possible power source (and therefore
the object mobility) and the transmission range.
d) Simple or rich data: This classification is based on the quantity of data exchanged at each
report cycle. A humidity sensor in a field may report a simple daily index value (on a binary
scale from 0 to 255), while an engine sensor may report hundreds of parameters, from
temperature to pressure, gas velocity, compression speed, carbon index, and many others.
Richer data typically drives higher power consumption. This classification is often combined
with the previous to determine the object data throughput (low throughput to high throughput).
You may want to keep in mind that throughput is a combined metric. A medium-throughput
object may send simple data at rather high frequency (in which case the flow structure looks
continuous), or may send rich data at rather low frequency (in which case the flow structure
looks bursty).
e) Report range: This classification is based on the distance at which the gateway is located. For
example, for your fitness band to communicate with your phone, it needs to be located a few
meters away at most. The assumption is that your phone needs to be at visual distance for you
to consult the reported data on the phone screen. If the phone is far away, you typically do not
use it, and reporting data from the band to the phone is not necessary. By contrast, a moisture
sensor in the asphalt of a road may need to communicate with its reader several hundred meters
or even kilometers away.
INTERNET OF THINGS 18CS81
AnithaMCAsst.Prof DEPT. OF ISE,SVIT Page 24
f) Object density per cell: This classification is based on the number of smart objects (with a
similar need to communicate) over a given area, connected to the same gateway. An oil pipeline
may utilize a single sensor at key locations every few miles. By contrast, telescopes like the
SETI Colossus telescope at the Whipple Observatory deploy hundreds, and sometimes
thousands, of mirrors over a small area, each with multiple gyroscopes, gravity, and vibration
sensors.
From a network architectural standpoint, your initial task is to determine which technology should be
used to allow smart objects to communicate.
Layer 2: Communications Network Layer
Once you have determined the influence of the smart object form factor over its transmission
capabilities (transmission range, data volume and frequency, sensor density and mobility), you are
ready to connect the object and communicate.
Compute and network assets used in IoT can be very different from those in IT environments. The
difference in the physical form factors between devices used by IT and OT is obvious even to the most
casual of observers. What typically drives this is the physical environment in which the devices are
deployed. What may not be as inherently obvious, however, is their operational differences. The
operational differences must be understood in order to apply the correct handling to secure the target
assets.
Temperature variances are an easily understood metric. The cause for the variance is easily attributed
to external weather forces and internal operating conditions. Remote external locations, such as those
associated with mineral extraction or pipeline equipment can span from the heat to the cold .
INTERNET OF THINGS 18CS81
AnithaMCAsst.Prof DEPT. OF ISE,SVIT Page 25
 Humidity fluctuations can impact the long-term success of a system as well.
 Shock and vibration needs vary based on the deployment scenario.
 Solid particulates can also impact the gear. Most IT environments must contend with dust
build-up that can become highly concentrated due to the effect of cooling fans.
 Hazardous location design may also cause corrosive impact to the equipment. Caustic materials
can impact connections over which power or communications travel.
 Furthermore, they can result in reduced thermal efficiency by potentially coating the heat
transfer surfaces.
 In some scenarios, the concern is not how the environment can impact the equipment but how
the equipment can impact the environment.
 Power supplies in OT systems are also frequently different from those commonly seen on
standard IT equipment. A wider range of power variations are common attributes of industrial
compute components.
Access Network Sublayer
Range estimates are grouped by category names that illustrate the environment or the vertical where
data collection over that range is expected. Common groups are as follows:
 PAN (personal area network): Scale of a few meters. This is the personal space around a
person. A common wireless technology for this scale is Bluetooth.
 HAN (home area network): Scale of a few tens of meters. At this scale, common wireless
technologies for IoT include ZigBee and Bluetooth Low Energy (BLE).
 NAN (neighborhood area network): Scale of a few hundreds of meters. The term NAN is
often used to refer to a group of house units from which data is collected.
INTERNET OF THINGS 18CS81
AnithaMCAsst.Prof DEPT. OF ISE,SVIT Page 26
 FAN (field area network): Scale of several tens of meters to several hundred meters. FAN
typically refers to an outdoor area larger than a single group of house units. The FAN is often
seen as “open space” (and therefore not secured and not controlled). A FAN is sometimes
viewed as a group of NANs, but some verticals see the FAN as a group of HANs or a group of
smaller outdoor cells.
 LAN (local area network): Scale of up to 100 m. This term is very common in networking, and
it is therefore also commonly used in the IoT space when standard networking technologies
(such as Ethernet or IEEE 802.11) are used.
Figure 2-11 combines cost, range, power consumption, and typical available bandwidth for common
IoT access technologies.
The amount of data to carry over a given time period along with correlated power consumption
(driving possible limitations in mobility and range) determines the wireless cell size and structure.
Similar ranges also do not mean similar topologies. Some technologies offer flexible connectivity
structure to extend communication possibilities:
 Point-to-point topologies: These topologies allow one point to communicate with another
point. This topology in its strictest sense is uncommon for IoT access, as it would imply that a
single object can communicate only with a single gateway. However, several technologies are
referred to as “point-to-point” when each object establishes an individual session with the
gateway. The “point-to-point” concept, in that case, often refers to the communication structure
more than the physical topology.
 Point-to-multipoint topologies: These topologies allow one point to communicate with more
than one other point. Most IoT technologies where one or more than one gateways
communicate with multiple smart objects are in this category. However, depending on the
features available on each communicating mode, several subtypes need to be considered. A
particularity of IoT networks is that some nodes (for example, sensors) support both data
INTERNET OF THINGS 18CS81
AnithaMCAsst.Prof DEPT. OF ISE,SVIT Page 27
collection and forwarding functions, while some other nodes (for example, some gateways)
collect the smart object data, sometimes instruct the sensor to perform specific operations, and
also interface with other networks or possibly other gateways. For this reason, some
technologies categorize the nodes based on the functions (described by a protocol) they
implement.
To form a network, a device needs to connect with another device. When both devices fully implement
the protocol stack functions, they can form a peer-to-peer network. However, in many cases, one of
the devices collects data from the others. For example, in a house, temperature sensors may be
deployed in each room or each zone of the house, and they may communicate with a central point
where temperature is displayed and controlled.
The sensor can implement a subset of protocol functions to perform just a specialized part
(communication with the coordinator). Such a device is called a reduced-function device (RFD). An
RFD cannot be a coordinator. An RFD also cannot implement direct communications to another RFD.
The coordinator that implements the full network functions is called, by contrast, a full-function device
(FFD). An FFD can communicate directly with another FFD or with more than one FFD, forming
multiple peer-to-peer connections. Topologies where each FFD has a unique path to another FFD are
called cluster tree topologies. FFDs in the cluster tree may have RFDs, resulting in a cluster star
topology.
Point-to-multipoint technologies allow a node to have more than one path to another node, forming a
mesh topology. This redundancy means that each node can communicate with more than just one other
node. This communication can be used to directly exchange information between nodes (the receiver
directly consumes the information received) or to extend the range of the communication link. In this
case, an intermediate node acts as a relay between two other nodes. These two other
INTERNET OF THINGS 18CS81
AnithaMCAsst.Prof DEPT. OF ISE,SVIT Page 28
nodes would not be able to communicate successfully directly while respecting the constraints of
power and modulation dictated by the PHY layer protocol.
Another property of mesh networks is redundancy. The disappearance of one node does not necessarily
interrupt network communications. Nodes A and D are too far apart to communicate directly. In this
case, communication can be relayed through nodes B or C. Node B may be used as the primary relay.
However, the loss of node B does not prevent the communication between nodes A and D. Here,
communication is rerouted through another node, node C.
Gateways and Backhaul Sublayer
Data collected from a smart object may need to be forwarded to a central station where data is
processed. As this station is often in a different location from the smart object, data directly received
from the sensor through an access technology needs to be forwarded to another medium (the backhaul)
and transported to the central station. The gateway is in charge of this inter-medium communication.
In the DSRC case, the entire “sensor field” is moving along with the gateway, but the general principles
of IoT networking remain the same. The range at which DSRC can communicate is limited. Similarly,
for all other IoT architectures, the choice of a backhaul technology depends on the communication
distance and also on the amount of data that needs to be forwarded. When the smart object’s operation
is controlled from a local site, and when the environment is stable (for example, factory or oil and gas
field), Ethernet can be used as a backhaul. Mesh is a common topology to allow communication
flexibility in this type of dynamic environment.
Table 2-4 compares the main solutions from an architectural angle.
INTERNET OF THINGS 18CS81
AnithaMCAsst.Prof DEPT. OF ISE,SVIT Page 29
Distribution automation (DA) allows your meter to communicate with neighboring meters or other
devices in the electrical distribution grid. With such communication, consumption load balancing may
be optimized. For example, your air conditioning pulses fresh air at regular intervals. With DA, your
neighbor’s AC starts pulsing when your system pauses; in this way, the air in both houses is kept fresh,
but the energy consumed from the network is stable instead of spiking up and down with uncoordinated
start and stop points.
Similarly, your smart meter may communicate with your house appliances to evaluate their type and
energy demand. With this scheme, your washing machine can be turned on in times of lower
consumption from other systems, such as at night, while power to your home theater system will never
be deprived, always turning on when you need it. Once the system learns your consumption pattern,
charging of your electric car can start and stop at intervals to achieve the same overnight charge without
creating spikes in energy demand. Data may flow locally, or it may have to be orchestrated by a central
application to coordinate the power budget between houses.
Network Transport Sub-
llllayer
INTERNET OF THINGS 18CS81
AnithaMCAsst.Prof DEPT. OF ISE,SVIT Page 30
This communication structure thus may involve peer-to-peer, point-to-point, point-to-multipoint,
unicast and multicast communications. In a multitenant environment (for example, electricity and gas
consumption management), different systems may use the same communication pathways. This
communication occurs over multiple media (for example, power lines inside your house or a short-
range wireless system like indoor Wi-Fi and/or ZigBee), a longer-range wireless system to the
gateway, and yet another wireless or wired medium for backhaul transmission.
To allow for such communication structure, a network protocol with specific characteristics needs to
be implemented. The protocol needs to be open and standard-based to accommodate multiple
industries and multiple media. Scalability (to accommodate thousands or millions of sensors in a single
network) and security are also common requirements. IP is a protocol that matches all these
requirements. The advantages of IP are covered in depth in Chapter 5.
The flexibility of IP allows this protocol to be embedded in objects of very different natures,
exchanging information over very different media, including low-power, lossy, and low-bandwidth
networks. For example, RFC 2464 describes how an IPv6 packet gets encapsulated over an Ethernet
frame and is also used for IEEE 802.11 Wi-Fi. Similarly, the IETF 6LoWPAN working group specifies
how IPv6 packets are carried efficiently over lossy networks, forming an “adaption layer” for IPv6,
primarily for IoT networks.
Finally, the transport layer protocols built above IP (UDP and TCP) can easily be leveraged to decide
whether the network should control the data packet delivery (with TCP) or whether the control task
should be left to the application (UDP). UDP is a much lighter and faster protocol than TCP. However,
it does not guarantee packet delivery. Both TCP and UDP can be secured with TLS/SSL (TCP) or
DTLS (UDP). Chapter 6 takes a closer look at TCP and UDP for IoT networks.
IoT Network Management Sub-layer
IP, TCP, and UDP bring connectivity to IoT networks. Upper-layer protocols need to take care of data
transmission between the smart objects and other systems. Multiple protocols have been leveraged or
created to solve IoT data communication problems. Some networks rely on a push model (that is, a
sensor reports at a regular interval or based on a local trigger), whereas others rely on a pull model
(that is, an application queries the sensor over the network), and multiple hybrid approaches are also
possible.
Following the IP logic, some IoT implementers have suggested HTTP for the data transfer phase. After
all, HTTP has a client and server component. The sensor could use the client part to establish a
connection to the IoT central application (the server), and then data can be exchanged. You can find
HTTP in some IoT applications, but HTTP is something of a fat protocol and was not designed to
operate in constrained environments with low memory, low power, low bandwidth, and a high rate of
packet failure. Despite these limitations, other web-derived protocols have been suggested for the IoT
space. One example is WebSocket. WebSocket is part of the HTML5 specification, and provides a
simple bidirectional connection over a single connection. Some IoT solutions use WebSocket to
INTERNET OF THINGS 18CS81
AnithaMCAsst.Prof DEPT. OF ISE,SVIT Page 31
manage the connection between the smart object and an external application. WebSocket is often
combined with other protocols, such as MQTT (described shortly) to handle the IoT-specific part of
the communication.
To respond to the limits of web-based protocols, another protocol was created by the IETF Constrained
Restful Environments (CoRE) working group: Constrained Application Protocol (CoAP). CoAP uses
some methods similar to those of HTTP (such as Get, Post, Put, and Delete) but implements a shorter
list, thus limiting the size of the header. CoAP also runs on UDP (whereas HTTP typically uses TCP).
CoAP also adds a feature that is lacking in HTTP and very useful for IoT: observation. Observation
allows the streaming of state changes as they occur, without requiring the receiver to query for these
changes.
Layer 3: Applications and Analytics Layer
Analytics Versus Control Applications
A. Analytics application:
- collects data from multiple smart objects
- processes the collected data
- displays information resulting from the data that was processed
- application processes the data to convey a view of the network that cannot be obtained
from solely looking at the information displayed by a single smart object.
B. Control application:
- controls the behavior of the smart object or the behavior of an object related to the
smart object.
- used for controlling complex aspects of an IoT network with a logic that cannot be
programmed inside a single IoT object
An example of control system architecture is SCADA. SCADA was developed as a universal method
to access remote systems and send instructions. One example where SCADA is widely used is in the
control and monitoring of remote terminal units (RTUs) on the electrical distribution grid.
Data Versus Network Analytics
A. Data analytics:
- processes the data collected by smart objects and combines it to provide an intelligent
view related to the IoT system.
- data processing can be very complex and may combine multiple changing values over
complex algorithms.
- Data analytics can also monitor the IoT system itself. For example, a machine or robot
in a factory can report data about its own movements.
INTERNET OF THINGS 18CS81
AnithaMCAsst.Prof DEPT. OF ISE,SVIT Page 32
B. Network analytics:
- A loss of connectivity may result in an accident or degradation of operations
efficiency.
- the control module cannot modify local object behaviors anymore.
Data Analytics Versus Business Benefits
A smarter architectural choice may be to allow for an open system where the network is engineered to
be flexible enough that other sensors may be added in the future, and where both upstream and
downstream operations are allowed. This flexibility allows for additional processing of the existing
sensors and also deeper and more efficient interaction with the connected objects. This enhanced data
processing can result in new added value for businesses that are not envisioned at the time when the
system is initially deployed.
An example of a flexible analytics and control application is Cisco Jasper, which provides a turnkey
cloud-based platform for IoT management and monetization. Consider the case of vending machines
deployed throughout a city. At a basic level, these machines can be connected, and sensors can be
deployed to report when a machine is in an error state. A repair person can be sent to address the issue
when such a state is identified. This type of alert is a time saver and avoids the need for the repair team
to tour all the machines in turn when only one may be malfunctioning.
This alert system may also avoid delay between the time when a machine goes into the error state and
the time when a repair team visits the machine location. With a static platform, this use case is limited
to this type of alert. With a flexible platform like Cisco Jasper, new applications may be imagined and
developed over time. For example, the machine sensors can be improved to also report when an item
is sold. The central application can then be enhanced to process this information and analyze what item
is most sold, in what location, at what times. This new view of the machines may allow for an
optimization of the items to sell in machines in a given area. Systems may be implemented to adapt
the goods to time, season, or location—or many other parameters that may have been analyzed. In
short, architecting open systems opens the possibility for new applications.
Smart Services
Fundamentally, smart services use IoT and aim for efficiency. For example, sensors can be installed
on equipment to ensure ongoing conformance with regulations or safety requirements. This angle of
efficiency can take multiple forms, from presence sensors in hazardous areas to weight threshold
violation detectors on trucks.
Smart services can also be used to measure the efficiency of machines by detecting machine output,
speed, or other forms of usage evaluation. Entire operations can be optimized with IoT. In hospitality,
for example, presence and motion sensors can evaluate the number of guests in a lobby and redirect
personnel accordingly. The same type of action can be taken in a store where a customer is detected
as staying longer than the typical amount of time in front of a shelf. Personnel can be
INTERNET OF THINGS 18CS81
AnithaMCAsst.Prof DEPT. OF ISE,SVIT Page 33
deployed to provide assistance. Movement of people and objects on factory floors can be analyzed to
optimize the production flow.
Smart services can be integrated into an IoT system. For example, sensors can be integrated in a light
bulb. A sensor can turn a light on or off based on the presence of a human in the room. An even smarter
system can communicate with other systems in the house, learn the human movement pattern, and
anticipate the presence of a human, turning on the light just before the person enters the room. An even
smarter system can use smarter sensors that analyze multiple parameters to detect human mood and
modify accordingly the light color to adapt to the learned preferences, or to convey either a more
relaxing or a more dynamic environment.
Light bulbs are a simple example. By connecting to other systems in the house, efficiencies can be
coordinated. For example, the house entry alarm system or the heating system can coordinate with the
presence detector in a light bulb to adapt to detected changes. The alarm system can disable volumetric
movement alarms in zones where a known person is detected. The heating system can adapt the
temperature to human presence or detected personal preferences.
Similar efficiency can be extended to larger systems than a house. For example, smart grid applications
can coordinate the energy consumption between houses to regulate the energy demand from the grid.
We already mentioned that your washing machine may be turned on at night when the energy demand
for heating and cooling is lower. Just as your air conditioning pulses can be coordinated with your
neighbor’s, your washing machine cycles can be coordinated with the appliances in your house and in
the neighborhood to smooth the energy demand spikes on the grid.
Efficiency also applies to M2M communications. In mining environments, vehicles can communicate
to regulate the flows between drills, draglines, bulldozers, and dump trucks, for example, making sure
that a dump truck is always available when a bulldozer needs it. In smart cities, vehicles communicate.
A traffic jam is detected and anticipated automatically by public transportation, and the system can
temporarily reroute buses or regulate the number of buses servicing a specific line based on traffic and
customer quantity, instantaneous or learned over trending.
1.12 IOT DATA MANAGEMENT AND COMPUTE STACK
One of the key messages in the first two chapters of this book is that the massive scale of IoT networks
is fundamentally driving new architectures. For instance, Figure 1-2 in Chapter 1 illustrates how the
“things” connected to the Internet are continuing to grow exponentially, with a prediction by Cisco
that by 2020 there will be more than 50 billion devices connected to some form of an IP network.
Clearly, traditional IT networks are not prepared for this magnitude of network devices. However,
beyond the network architecture itself, consider the data that is generated by these devices. If the
number of devices is beyond conventional numbers, surely the data generated by these devices must
also be of serious concern.
INTERNET OF THINGS 18CS81
AnithaMCAsst.Prof DEPT. OF ISE,SVIT Page 34
In fact, the data generated by IoT sensors is one of the single biggest challenges in building an IoT
system. In the case of modern IT networks, the data sourced by a computer or server is typically
generated by the client/server communications model, and it serves the needs of the application. In
sensor networks, the vast majority of data generated is unstructured and of very little use on its own.
For example, the majority of data generated by a smart meter is nothing more than polling data; the
communications system simply determines whether a network connection to the meter is still active.
This data on its own is of very little value. The real value of a smart meter is the metering data read by
the meter management system (MMS). However, if you look at the raw polling data from a different
perspective, the information can be very useful. For example, a utility may have millions of meters
covering its entire service area. If whole sections of the smart grid start to show an interruption of
connectivity to the meters, this data can be analyzed and combined with other sources of data, such as
weather reports and electrical demand in the grid, to provide a complete picture of what is happening.
This information can help determine whether the loss of connection to the meters is truly a loss of
power or whether some other problem has developed in the grid. Moreover, analytics of this data can
help the utility quickly determine the extent of the service outage and repair the disruption in a timely
fashion.
In most cases, the processing location is outside the smart object. A natural location for this processing
activity is the cloud. Smart objects need to connect to the cloud, and data processing is centralized.
However, this model also has limitations. As data volume, the variety of objects connecting to the
network, and the need for more efficiency increase. These new requirements include the following:
 Minimizing latency: Analyzing data close to the device that collected the data can make a
difference between averting disaster and a cascading system failure.
 Conserving network bandwidth: It is not practical to transport vast amounts of data from
thousands or hundreds of thousands of edge devices to the cloud. Nor is it necessary because
many critical analyses do not require cloud-scale processing and storage.
 Increasing local efficiency: Collecting and securing data across a wide geographic area with
different environmental conditions may not be useful.
The volume of data also introduces questions about bandwidth management. As the massive amount
of IoT data begins to funnel into the data center, does the network have the capacity to sustain this
volume of traffic? Does the application server have the ability to ingest, store, and analyze the vast
quantity of data that is coming in? This is sometimes referred to as the “impedance mismatch” of the
data generated by the IoT system and the management application’s ability to deal with that data.
As illustrated in Figure 2-14, data management in traditional IT systems is very simple. The endpoints
(laptops, printers, IP phones, and so on) communicate over an IP core network to servers in the data
center or cloud. Data is generally stored in the data center, and the physical links from access to core
are typically high bandwidth, meaning access to IT data is quick.
INTERNET OF THINGS 18CS81
AnithaMCAsst.Prof DEPT. OF ISE,SVIT Page 35
IoT systems function differently. Several data-related problems need to be addressed:
a) Bandwidth in last-mile IoT networks is very limited. When dealing with thousands/millions of
devices, available bandwidth may be on order of tens of Kbps per device or even less.
b) Latency can be very high. Instead of dealing with latency in the milliseconds range, large IoT
networks often introduce latency of hundreds to thousands of milliseconds.
c) Network backhaul from the gateway can be unreliable and often depends on 3G/LTE or even
satellite links. Backhaul links can also be expensive if a per-byte data usage model is necessary.
d) The volume of data transmitted over the backhaul can be high, and much of the data may not
really be that interesting (such as simple polling messages).
e) Big data is getting bigger. The concept of storing and analyzing all sensor data in the cloud is
impractical. The sheer volume of data generated makes real-time analysis and response to the
data almost impossible.
Fog Computing
The solution to the challenges mentioned in the previous section is to distribute data management
throughout the IoT system, as close to the edge of the IP network as possible. The best-known
embodiment of edge services in IoT is fog computing.
Any device with computing, storage, and network connectivity can be a fog node. Examples
include industrial controllers, switches, routers, embedded servers, and IoT gateways. Analyzing IoT
data close to where it is collected minimizes latency, offloads gigabytes of network traffic from the
core network, and keeps sensitive data inside the local network.
INTERNET OF THINGS 18CS81
AnithaMCAsst.Prof DEPT. OF ISE,SVIT Page 36
i. Fog services are typically accomplished very close to the edge device, sitting as close to the
IoT endpoints as possible.
ii. The fog node has contextual awareness of the sensors it is managing because of its geographic
proximity to those sensors.
iii. The fog node is able to analyze information from all the sensors and can provide contextual
analysis of the messages it is receiving and may decide to send back only the relevant
information over the backhaul network to the cloud.
IoT fog computing enables data to be preprocessed and correlated with other inputs to produce relevant
information. This data can then be used as real-time, actionable knowledge by IoT-enabled
applications. Longer term, this data can be used to gain a deeper understanding of network behavior
and systems for the purpose of developing proactive policies, processes, and responses.
Fog applications are as diverse as the Internet of Things itself. What they have in common is data
reduction—monitoring or analyzing real-time data from network-connected things and then initiating
an action, such as locking a door, changing equipment settings, applying the brakes on a train, zooming
a video camera, opening a valve in response to a pressure reading, creating a bar chart, or sending an
alert to a technician to make a preventive repair.
INTERNET OF THINGS 18CS81
AnithaMCAsst.Prof DEPT. OF ISE,SVIT Page 37
Characteristic of fog computing are as follows:
a) Contextual location awareness and low latency: The fog node sits as close to the IoT endpoint
as possible to deliver distributed computing.
b) Geographic distribution: In sharp contrast to the more centralized cloud, the services and
applications targeted by the fog nodes demand widely distributed deployments.
c) Deployment near IoT endpoints: Fog nodes are typically deployed in the presence of a large
number of IoT endpoints. For example, typical metering deployments often see 3000 to 4000
nodes per gateway router, which also functions as the fog computing node.
d) Wireless communication between the fog and the IoT endpoint: Although it is possible to
connect wired nodes, the advantages of fog are greatest when dealing with a large number of
endpoints, and wireless access is the easiest way to achieve such scale.
e) Use for real-time interactions: Important fog applications involve real-time interactions rather
than batch processing. Preprocessing of data in the fog nodes allows upper-layer applications
to perform batch processing on a subset of the data.
Edge Computing
Fog computing solutions are being adopted by many industries, and efforts to develop distributed
applications and analytics tools are being introduced at an accelerating pace. The natural place for a
fog node is in the network device that sits closest to the IoT endpoints, and these nodes are typically
spread throughout an IoT network.
IoT devices and sensors often have constrained resources, however, as compute capabilities
increase. Some new classes of IoT endpoints have enough compute capabilities to perform at least
low-level analytics and filtering to make basic decisions. For example, consider a water sensor on a
fire hydrant. While a fog node sitting on an electrical pole in the distribution network may have an
excellent view of all the fire hydrants in a local neighborhood, a node on each hydrant would have
clear view of a water pressure drop on its own line and would be able to quickly generate an alert of a
localized problem.
The fog node would have a wider view and would be able to ascertain whether the problem
was more than just localized but was affecting the entire area. Another example is in the use of smart
meters. Edge compute–capable meters are able to communicate with each other to share information
on small subsets of the electrical distribution grid to monitor localized power quality and consumption,
and they can inform a fog node of events that may pertain to only tiny sections of the grid. Models
such as these help ensure the highest quality of power delivery to customers.
The Hierarchy of Edge, Fog, and Cloud
This model suggests a hierarchical organization of network, compute, and data storage resources. At
each stage, data is collected, analyzed, and responded to when necessary, according to the capabilities
of the resources at each layer. As data needs to be sent to the cloud, the latency becomes higher.
INTERNET OF THINGS 18CS81
AnithaMCAsst.Prof DEPT. OF ISE,SVIT Page 38
Edge and fog thus require an abstraction layer that allows applications to communicate
with one another.
The abstraction layer :
- exposes a common set of APIs for monitoring, provisioning, and controlling the
physical resources in a standardized way.
- requires a mechanism to support virtualization, with the ability to run multiple
operating systems or service containers on physical devices to support
multitenancy and application consistency across the IoT system.
-
From an architectural standpoint, fog nodes closest to the network edge receive the data
from IoT devices.
The fog IoT application then directs different types of data to the optimal place for
analysis:
 The most time-sensitive data is analyzed on the edge or fog node closest to the
things generating the data.
 Data that can wait seconds or minutes for action is passed along to an aggregation
node for analysis and action.
 Data that is less time sensitive is sent to the cloud for historical analysis, big data
analytics, and long-term storage. For example, each of thousands or hundreds of
thousands of fog nodes might send periodic summaries of data to the cloud for
historical analysis and storage.

More Related Content

Similar to MODULE 1.pdf

NCET Biz Cafe | How IoT is Transforming Business and our Daily Lives | June 20
NCET Biz Cafe | How IoT is Transforming Business and our Daily Lives | June 20NCET Biz Cafe | How IoT is Transforming Business and our Daily Lives | June 20
NCET Biz Cafe | How IoT is Transforming Business and our Daily Lives | June 20Archersan
 
IRJET- A Study on Smart Parking System using IOT for Indian Malls
IRJET- A Study on Smart Parking System using IOT for Indian MallsIRJET- A Study on Smart Parking System using IOT for Indian Malls
IRJET- A Study on Smart Parking System using IOT for Indian MallsIRJET Journal
 
IoT The Future Of Transportation Systems.pdf
IoT The Future Of Transportation Systems.pdfIoT The Future Of Transportation Systems.pdf
IoT The Future Of Transportation Systems.pdfMolly Cobb
 
What Is the Role of IoT in Logistics and Transportation.pdf
What Is the Role of IoT in Logistics and Transportation.pdfWhat Is the Role of IoT in Logistics and Transportation.pdf
What Is the Role of IoT in Logistics and Transportation.pdfRosalie Lauren
 
Internet of things report capgemini consulting are companies ready for the ...
Internet of things report capgemini consulting   are companies ready for the ...Internet of things report capgemini consulting   are companies ready for the ...
Internet of things report capgemini consulting are companies ready for the ...Rick Bouter
 
The Internet of Things: Are Organizations Ready For A Multi-Trillion Dollar P...
The Internet of Things: Are Organizations Ready For A Multi-Trillion Dollar P...The Internet of Things: Are Organizations Ready For A Multi-Trillion Dollar P...
The Internet of Things: Are Organizations Ready For A Multi-Trillion Dollar P...default default
 
The Internet of Things: Are Organizations Ready For A Multi-Trillion Dollar P...
The Internet of Things: Are Organizations Ready For A Multi-Trillion Dollar P...The Internet of Things: Are Organizations Ready For A Multi-Trillion Dollar P...
The Internet of Things: Are Organizations Ready For A Multi-Trillion Dollar P...Capgemini
 
Intelligent Parking System
Intelligent Parking SystemIntelligent Parking System
Intelligent Parking Systemijtsrd
 
IRJET- Internet of Things Technologies for Future of Smart Cities: Artificial...
IRJET- Internet of Things Technologies for Future of Smart Cities: Artificial...IRJET- Internet of Things Technologies for Future of Smart Cities: Artificial...
IRJET- Internet of Things Technologies for Future of Smart Cities: Artificial...IRJET Journal
 
SMART SOLUTION FOR RESOLVING HEAVY TRAFFIC USING IOT
SMART SOLUTION FOR RESOLVING HEAVY TRAFFIC USING IOTSMART SOLUTION FOR RESOLVING HEAVY TRAFFIC USING IOT
SMART SOLUTION FOR RESOLVING HEAVY TRAFFIC USING IOTIRJET Journal
 
An IOT based solution for Road Accidents
An IOT based solution for Road AccidentsAn IOT based solution for Road Accidents
An IOT based solution for Road Accidentsijtsrd
 
How close are autonomous vehicles to consumers? - San Francisco Green Careers
How close are autonomous vehicles to consumers? - San Francisco Green CareersHow close are autonomous vehicles to consumers? - San Francisco Green Careers
How close are autonomous vehicles to consumers? - San Francisco Green Careerskeysjhzvoanjq
 
IRJET - Automobile Enhanced Security System using LabVIEW based on IoT
IRJET - Automobile Enhanced Security System using LabVIEW based on IoTIRJET - Automobile Enhanced Security System using LabVIEW based on IoT
IRJET - Automobile Enhanced Security System using LabVIEW based on IoTIRJET Journal
 
IoT applications for connected vehicle and ITS
IoT applications for connected vehicle and ITSIoT applications for connected vehicle and ITS
IoT applications for connected vehicle and ITSShashank Dhaneshwar
 
Telecom Review Mobility Report 2015
Telecom Review Mobility Report 2015Telecom Review Mobility Report 2015
Telecom Review Mobility Report 2015Zane Small
 
Internet of Things
Internet of ThingsInternet of Things
Internet of ThingsKeshav Laad
 

Similar to MODULE 1.pdf (20)

DataQuest_Sairam
DataQuest_SairamDataQuest_Sairam
DataQuest_Sairam
 
What is IoT
What is IoTWhat is IoT
What is IoT
 
NCET Biz Cafe | How IoT is Transforming Business and our Daily Lives | June 20
NCET Biz Cafe | How IoT is Transforming Business and our Daily Lives | June 20NCET Biz Cafe | How IoT is Transforming Business and our Daily Lives | June 20
NCET Biz Cafe | How IoT is Transforming Business and our Daily Lives | June 20
 
IRJET- A Study on Smart Parking System using IOT for Indian Malls
IRJET- A Study on Smart Parking System using IOT for Indian MallsIRJET- A Study on Smart Parking System using IOT for Indian Malls
IRJET- A Study on Smart Parking System using IOT for Indian Malls
 
IoT The Future Of Transportation Systems.pdf
IoT The Future Of Transportation Systems.pdfIoT The Future Of Transportation Systems.pdf
IoT The Future Of Transportation Systems.pdf
 
What Is the Role of IoT in Logistics and Transportation.pdf
What Is the Role of IoT in Logistics and Transportation.pdfWhat Is the Role of IoT in Logistics and Transportation.pdf
What Is the Role of IoT in Logistics and Transportation.pdf
 
Internet of things report capgemini consulting are companies ready for the ...
Internet of things report capgemini consulting   are companies ready for the ...Internet of things report capgemini consulting   are companies ready for the ...
Internet of things report capgemini consulting are companies ready for the ...
 
The Internet of Things: Are Organizations Ready For A Multi-Trillion Dollar P...
The Internet of Things: Are Organizations Ready For A Multi-Trillion Dollar P...The Internet of Things: Are Organizations Ready For A Multi-Trillion Dollar P...
The Internet of Things: Are Organizations Ready For A Multi-Trillion Dollar P...
 
The Internet of Things: Are Organizations Ready For A Multi-Trillion Dollar P...
The Internet of Things: Are Organizations Ready For A Multi-Trillion Dollar P...The Internet of Things: Are Organizations Ready For A Multi-Trillion Dollar P...
The Internet of Things: Are Organizations Ready For A Multi-Trillion Dollar P...
 
Intelligent Parking System
Intelligent Parking SystemIntelligent Parking System
Intelligent Parking System
 
IRJET- Internet of Things Technologies for Future of Smart Cities: Artificial...
IRJET- Internet of Things Technologies for Future of Smart Cities: Artificial...IRJET- Internet of Things Technologies for Future of Smart Cities: Artificial...
IRJET- Internet of Things Technologies for Future of Smart Cities: Artificial...
 
SMART SOLUTION FOR RESOLVING HEAVY TRAFFIC USING IOT
SMART SOLUTION FOR RESOLVING HEAVY TRAFFIC USING IOTSMART SOLUTION FOR RESOLVING HEAVY TRAFFIC USING IOT
SMART SOLUTION FOR RESOLVING HEAVY TRAFFIC USING IOT
 
An IOT based solution for Road Accidents
An IOT based solution for Road AccidentsAn IOT based solution for Road Accidents
An IOT based solution for Road Accidents
 
How close are autonomous vehicles to consumers? - San Francisco Green Careers
How close are autonomous vehicles to consumers? - San Francisco Green CareersHow close are autonomous vehicles to consumers? - San Francisco Green Careers
How close are autonomous vehicles to consumers? - San Francisco Green Careers
 
Your Next IoT Journey
Your Next IoT JourneyYour Next IoT Journey
Your Next IoT Journey
 
IRJET - Automobile Enhanced Security System using LabVIEW based on IoT
IRJET - Automobile Enhanced Security System using LabVIEW based on IoTIRJET - Automobile Enhanced Security System using LabVIEW based on IoT
IRJET - Automobile Enhanced Security System using LabVIEW based on IoT
 
IoT applications for connected vehicle and ITS
IoT applications for connected vehicle and ITSIoT applications for connected vehicle and ITS
IoT applications for connected vehicle and ITS
 
10 hot IoT applications
10 hot IoT applications10 hot IoT applications
10 hot IoT applications
 
Telecom Review Mobility Report 2015
Telecom Review Mobility Report 2015Telecom Review Mobility Report 2015
Telecom Review Mobility Report 2015
 
Internet of Things
Internet of ThingsInternet of Things
Internet of Things
 

Recently uploaded

Crayon Activity Handout For the Crayon A
Crayon Activity Handout For the Crayon ACrayon Activity Handout For the Crayon A
Crayon Activity Handout For the Crayon AUnboundStockton
 
Roles & Responsibilities in Pharmacovigilance
Roles & Responsibilities in PharmacovigilanceRoles & Responsibilities in Pharmacovigilance
Roles & Responsibilities in PharmacovigilanceSamikshaHamane
 
ROOT CAUSE ANALYSIS PowerPoint Presentation
ROOT CAUSE ANALYSIS PowerPoint PresentationROOT CAUSE ANALYSIS PowerPoint Presentation
ROOT CAUSE ANALYSIS PowerPoint PresentationAadityaSharma884161
 
Computed Fields and api Depends in the Odoo 17
Computed Fields and api Depends in the Odoo 17Computed Fields and api Depends in the Odoo 17
Computed Fields and api Depends in the Odoo 17Celine George
 
Employee wellbeing at the workplace.pptx
Employee wellbeing at the workplace.pptxEmployee wellbeing at the workplace.pptx
Employee wellbeing at the workplace.pptxNirmalaLoungPoorunde1
 
AMERICAN LANGUAGE HUB_Level2_Student'sBook_Answerkey.pdf
AMERICAN LANGUAGE HUB_Level2_Student'sBook_Answerkey.pdfAMERICAN LANGUAGE HUB_Level2_Student'sBook_Answerkey.pdf
AMERICAN LANGUAGE HUB_Level2_Student'sBook_Answerkey.pdfphamnguyenenglishnb
 
Romantic Opera MUSIC FOR GRADE NINE pptx
Romantic Opera MUSIC FOR GRADE NINE pptxRomantic Opera MUSIC FOR GRADE NINE pptx
Romantic Opera MUSIC FOR GRADE NINE pptxsqpmdrvczh
 
Hierarchy of management that covers different levels of management
Hierarchy of management that covers different levels of managementHierarchy of management that covers different levels of management
Hierarchy of management that covers different levels of managementmkooblal
 
ACC 2024 Chronicles. Cardiology. Exam.pdf
ACC 2024 Chronicles. Cardiology. Exam.pdfACC 2024 Chronicles. Cardiology. Exam.pdf
ACC 2024 Chronicles. Cardiology. Exam.pdfSpandanaRallapalli
 
How to do quick user assign in kanban in Odoo 17 ERP
How to do quick user assign in kanban in Odoo 17 ERPHow to do quick user assign in kanban in Odoo 17 ERP
How to do quick user assign in kanban in Odoo 17 ERPCeline George
 
Field Attribute Index Feature in Odoo 17
Field Attribute Index Feature in Odoo 17Field Attribute Index Feature in Odoo 17
Field Attribute Index Feature in Odoo 17Celine George
 
ENGLISH 7_Q4_LESSON 2_ Employing a Variety of Strategies for Effective Interp...
ENGLISH 7_Q4_LESSON 2_ Employing a Variety of Strategies for Effective Interp...ENGLISH 7_Q4_LESSON 2_ Employing a Variety of Strategies for Effective Interp...
ENGLISH 7_Q4_LESSON 2_ Employing a Variety of Strategies for Effective Interp...JhezDiaz1
 
Keynote by Prof. Wurzer at Nordex about IP-design
Keynote by Prof. Wurzer at Nordex about IP-designKeynote by Prof. Wurzer at Nordex about IP-design
Keynote by Prof. Wurzer at Nordex about IP-designMIPLM
 
Gas measurement O2,Co2,& ph) 04/2024.pptx
Gas measurement O2,Co2,& ph) 04/2024.pptxGas measurement O2,Co2,& ph) 04/2024.pptx
Gas measurement O2,Co2,& ph) 04/2024.pptxDr.Ibrahim Hassaan
 
Grade 9 Q4-MELC1-Active and Passive Voice.pptx
Grade 9 Q4-MELC1-Active and Passive Voice.pptxGrade 9 Q4-MELC1-Active and Passive Voice.pptx
Grade 9 Q4-MELC1-Active and Passive Voice.pptxChelloAnnAsuncion2
 
What is Model Inheritance in Odoo 17 ERP
What is Model Inheritance in Odoo 17 ERPWhat is Model Inheritance in Odoo 17 ERP
What is Model Inheritance in Odoo 17 ERPCeline George
 
Influencing policy (training slides from Fast Track Impact)
Influencing policy (training slides from Fast Track Impact)Influencing policy (training slides from Fast Track Impact)
Influencing policy (training slides from Fast Track Impact)Mark Reed
 
Judging the Relevance and worth of ideas part 2.pptx
Judging the Relevance  and worth of ideas part 2.pptxJudging the Relevance  and worth of ideas part 2.pptx
Judging the Relevance and worth of ideas part 2.pptxSherlyMaeNeri
 

Recently uploaded (20)

Crayon Activity Handout For the Crayon A
Crayon Activity Handout For the Crayon ACrayon Activity Handout For the Crayon A
Crayon Activity Handout For the Crayon A
 
Roles & Responsibilities in Pharmacovigilance
Roles & Responsibilities in PharmacovigilanceRoles & Responsibilities in Pharmacovigilance
Roles & Responsibilities in Pharmacovigilance
 
ROOT CAUSE ANALYSIS PowerPoint Presentation
ROOT CAUSE ANALYSIS PowerPoint PresentationROOT CAUSE ANALYSIS PowerPoint Presentation
ROOT CAUSE ANALYSIS PowerPoint Presentation
 
Computed Fields and api Depends in the Odoo 17
Computed Fields and api Depends in the Odoo 17Computed Fields and api Depends in the Odoo 17
Computed Fields and api Depends in the Odoo 17
 
Employee wellbeing at the workplace.pptx
Employee wellbeing at the workplace.pptxEmployee wellbeing at the workplace.pptx
Employee wellbeing at the workplace.pptx
 
AMERICAN LANGUAGE HUB_Level2_Student'sBook_Answerkey.pdf
AMERICAN LANGUAGE HUB_Level2_Student'sBook_Answerkey.pdfAMERICAN LANGUAGE HUB_Level2_Student'sBook_Answerkey.pdf
AMERICAN LANGUAGE HUB_Level2_Student'sBook_Answerkey.pdf
 
Romantic Opera MUSIC FOR GRADE NINE pptx
Romantic Opera MUSIC FOR GRADE NINE pptxRomantic Opera MUSIC FOR GRADE NINE pptx
Romantic Opera MUSIC FOR GRADE NINE pptx
 
Hierarchy of management that covers different levels of management
Hierarchy of management that covers different levels of managementHierarchy of management that covers different levels of management
Hierarchy of management that covers different levels of management
 
ACC 2024 Chronicles. Cardiology. Exam.pdf
ACC 2024 Chronicles. Cardiology. Exam.pdfACC 2024 Chronicles. Cardiology. Exam.pdf
ACC 2024 Chronicles. Cardiology. Exam.pdf
 
How to do quick user assign in kanban in Odoo 17 ERP
How to do quick user assign in kanban in Odoo 17 ERPHow to do quick user assign in kanban in Odoo 17 ERP
How to do quick user assign in kanban in Odoo 17 ERP
 
Field Attribute Index Feature in Odoo 17
Field Attribute Index Feature in Odoo 17Field Attribute Index Feature in Odoo 17
Field Attribute Index Feature in Odoo 17
 
Model Call Girl in Bikash Puri Delhi reach out to us at 🔝9953056974🔝
Model Call Girl in Bikash Puri  Delhi reach out to us at 🔝9953056974🔝Model Call Girl in Bikash Puri  Delhi reach out to us at 🔝9953056974🔝
Model Call Girl in Bikash Puri Delhi reach out to us at 🔝9953056974🔝
 
ENGLISH 7_Q4_LESSON 2_ Employing a Variety of Strategies for Effective Interp...
ENGLISH 7_Q4_LESSON 2_ Employing a Variety of Strategies for Effective Interp...ENGLISH 7_Q4_LESSON 2_ Employing a Variety of Strategies for Effective Interp...
ENGLISH 7_Q4_LESSON 2_ Employing a Variety of Strategies for Effective Interp...
 
Keynote by Prof. Wurzer at Nordex about IP-design
Keynote by Prof. Wurzer at Nordex about IP-designKeynote by Prof. Wurzer at Nordex about IP-design
Keynote by Prof. Wurzer at Nordex about IP-design
 
Gas measurement O2,Co2,& ph) 04/2024.pptx
Gas measurement O2,Co2,& ph) 04/2024.pptxGas measurement O2,Co2,& ph) 04/2024.pptx
Gas measurement O2,Co2,& ph) 04/2024.pptx
 
Grade 9 Q4-MELC1-Active and Passive Voice.pptx
Grade 9 Q4-MELC1-Active and Passive Voice.pptxGrade 9 Q4-MELC1-Active and Passive Voice.pptx
Grade 9 Q4-MELC1-Active and Passive Voice.pptx
 
What is Model Inheritance in Odoo 17 ERP
What is Model Inheritance in Odoo 17 ERPWhat is Model Inheritance in Odoo 17 ERP
What is Model Inheritance in Odoo 17 ERP
 
Influencing policy (training slides from Fast Track Impact)
Influencing policy (training slides from Fast Track Impact)Influencing policy (training slides from Fast Track Impact)
Influencing policy (training slides from Fast Track Impact)
 
Judging the Relevance and worth of ideas part 2.pptx
Judging the Relevance  and worth of ideas part 2.pptxJudging the Relevance  and worth of ideas part 2.pptx
Judging the Relevance and worth of ideas part 2.pptx
 
Raw materials used in Herbal Cosmetics.pptx
Raw materials used in Herbal Cosmetics.pptxRaw materials used in Herbal Cosmetics.pptx
Raw materials used in Herbal Cosmetics.pptx
 

MODULE 1.pdf

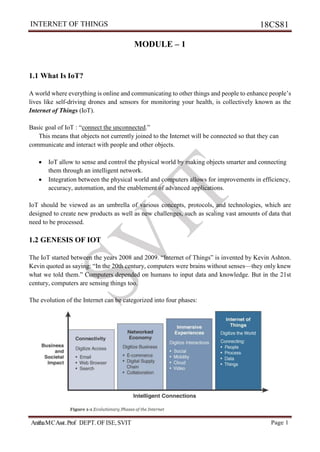
  • 1. INTERNET OF THINGS 18CS81 AnithaMCAsst.Prof DEPT. OF ISE,SVIT Page 1 MODULE – 1 1.1 What Is IoT? A world where everything is online and communicating to other things and people to enhance people’s lives like self-driving drones and sensors for monitoring your health, is collectively known as the Internet of Things (IoT). Basic goal of IoT : “connect the unconnected.” This means that objects not currently joined to the Internet will be connected so that they can communicate and interact with people and other objects.  IoT allow to sense and control the physical world by making objects smarter and connecting them through an intelligent network.  Integration between the physical world and computers allows for improvements in efficiency, accuracy, automation, and the enablement of advanced applications. IoT should be viewed as an umbrella of various concepts, protocols, and technologies, which are designed to create new products as well as new challenges, such as scaling vast amounts of data that need to be processed. 1.2 GENESIS OF IOT The IoT started between the years 2008 and 2009. “Internet of Things” is invented by Kevin Ashton. Kevin quoted as saying: “In the 20th century, computers were brains without senses—they only knew what we told them.” Computers depended on humans to input data and knowledge. But in the 21st century, computers are sensing things too. The evolution of the Internet can be categorized into four phases:
  • 2. INTERNET OF THINGS 18CS81 AnithaMCAsst.Prof DEPT. OF ISE,SVIT Page 2 Internet Phases Definition 1. Connectivity ( Digitize access )  Connect people using email, web services…  Search and access the information 2. Networked Economy ( Digitize business )  Enable e-commerce and supply-chain enhancements  Collaborative engagement to increase efficiency 3. Immersive Experiences ( Digitize interactions )  Extend Internet using social media while always being connected through mobility.  Most applications are cloud-based. 4. Internet of Things ( Digitize the world )  Connect objects and machines in real world.  Enable connecting the unconnected. 1.3 IOT AND DIGITIZATION IoT is focused on connecting “things” to Internet. Example:Wi-Fi location tracking in shopping mall “things” Wi-Fi devices Operation Tracking consumer location to understand how much time they spend in different parts of a mall or store through their smart phone. Advantages Changing locations of product displays and advertising, shops, rent to charge and security positions. Digitization is the conversion of information into a digital format. It is focused on connecting “things” with its data and business result. Example:Digitization of Photography “things” Digital camera Advantages No need retailer to develop film and better capturing of images. Example: Digitization of Taxi services “things” Taxi Driver device, Rider mobile Advantages Mobile app identifies cab, driver and fare. The rider pays fare through app. In the context of IoT, digitization brings together things, data, and business process to make networked connections more relevant and valuable. Example: “Nest” home automation The sensors determine desired climate settings and other smart objects, such as smoke alarms, video cameras, and other third-party devices. The devices and their functions are managed and controlled together and could provide the holistic experience. Smart objects and increased connectivity drive digitization, and thus many companies, countries, and governments are embracing this growing trend.
  • 3. INTERNET OF THINGS 18CS81 AnithaMCAsst.Prof DEPT. OF ISE,SVIT Page 3 1.4 IOT IMPACT Managing and monitoring smart objects using real-time connectivity enables a whole new level of data driven decision making. This is turn results in the optimization of systems and processes and delivers new services that save time for both people and businesses while improving the overall quality of life. The following examples illustrate some of the benefits of IOT and their impact. 1.4.1 Connected roadways While self-driving car is now becoming a reality with well-known projects like Google’s self-driving car, IoT is a necessary component for implementing a fully connected transportation infrastructure. IoT  provide better interaction with the transportation system through bidirectional data exchanges  provide important data to the riders.  provide reliable communications and data from transportation-related sensors. A self-driving car designed by Google operations:  Basic sensors in cars monitor oil pressure, tire pressure, temperature, and other core car functions.  The driver can access these data while controlling the car using equipment such as a steering Managing and monitoring smart objects using real-time connectivity enables data-driven decision making which results in the optimization of systems and processes and delivers new services that save time while improving the overall quality of life. The following examples illustrate some of the benefits ofIoT and their impact:
  • 4. INTERNET OF THINGS 18CS81 AnithaMCAsst.Prof DEPT. OF ISE,SVIT Page 4 wheel, pedals, and so on.  The driver will understand, handle, and make critical decisions while concentrating on driving safely.
  • 5. INTERNET OF THINGS 18CS81 AnithaMCAsst.Prof DEPT. OF ISE,SVIT Page 5  IP-enabled sensors allow easy communication with other systems both inside and outside the car.  Sensors and communication technologies vehicles to “talk” to other vehicles, traffic signals, school zones, and other elements of the transportation infrastructure. Transportation challenges can be classified into the three categories: Challenges Description Safety IoT enabled technologies enable drivers to avoid crashes. Reduce number of lives lost each year Mobility Enable operators and drivers to make informed decisions Reduce travel delays Communication between vehicles and traffic management optimize routing of vehicles Environment Reduces CO2 emissions by reducing travel times Provides real-time information Benefits of connected roadways : i. reduced traffic jams and urban congestion ii. decreased casualties and fatalities iii. increased response time for emergency vehicles iv. reduced vehicle emissions IoT applications in connected roadways- a) Intersection Movement Assist (IMA) - warns a driver (or a self-driving car) when it is not safe to enter an intersection due to a high probability of a collision. b) Automated vehicle tracking - a vehicle’s location is used for notification of arrival times, theft prevention, or highway assistance. c) Cargo management- provides precise positioning of cargo as it is enroute so that notification alerts can be sent to a dispatcher and routes can be optimized for congestion and weather. d) Road weather communications- use sensors and data from satellites, roads, and bridges to warn vehicles of dangerous conditions or inclement weather on the current route. A connected car is capable of generating continuous data related to location, performance, driver behavior, and much more, which will generate more than 25 GB of data per hour, which will be sent to the cloud. Considering number of hours a car is driven per ,the number of cars on the road, and amount of data generated by connected car, transmitted, and stored in the cloud will be in the zettabytes per year.
  • 6. INTERNET OF THINGS 18CS81 AnithaMCAsst.Prof DEPT. OF ISE,SVIT Page 6 - How the data generated by a car will be used by third parties?  Tire companies can collect data related to use and durability of their products in real time.  Automobile manufacturers collect to better understand how the cars are driven, when parts are starting to fail, or whether the car has broken down to build better cars in the future. In the future, car sensors will be able to interact with third-party applications, such as GPS/maps, to enable dynamic rerouting to avoid traffic, accidents, and other hazards. Similarly, Internet-based entertainment, including music, movies, and other streamings or downloads, can be personalized and customized to optimize a road trip. This data will also be used for targeted advertising. As GPS navigation systems become more integrated with sensors and wayfinding applications, it will become possible for personalized routing suggestions to be made. For example, if it is known that you prefer a certain coffee shop, through the use of a cloud-based data connector, the navigation system will be able to provide routing suggestions that have you drive your car past the right coffee shop. Connected roadways are likely to be one of the biggest growth areas for innovation. Automobiles and the roads they use have seen incredible change over the past century, but the changes ahead of us are going to be just as astonishing. In the past few years alone, we have seen highway systems around the world adopt sophisticated sensors systems that can detect seismic vibrations, car accidents, severe weather conditions, traffic congestion, and more. Recent advancements in roadway fiber-optic sensing technology is now able to record not only how many cars are passing but their speed and type.
  • 7. INTERNET OF THINGS 18CS81 AnithaMCAsst.Prof DEPT. OF ISE,SVIT Page 7 1.4.2 Connected Factory The main challenges facing manufacturing in a factory:  Accelerating new product and service introductions to meet customer and market opportunities  Increasing plant production, quality, and uptime while decreasing cost  Mitigating unplanned downtime (which wastes, on average, at least 5% of production)  Securing factories from cyber threats  Decreasing high cabling and re-cabling costs (up to 60% of deployment costs)  Improving worker productivity and safety A convergence of factory-based operational technologies and architectures with global IT networks is referred to as the connected factory. Sensors communicate using the Internet Protocol (IP) over an Ethernet infrastructure. They transmit and receive large quantities of real-time informational and diagnostic data. More IP-enabled devices such as video cameras, diagnostic smart objects, and even personal mobile devices, are being added to the manufacturing environment. For example, a smelting facility extracts metals from their ores. The facility uses both heat and chemicals to decompose the ore, leaving behind the base metal. This is a multistage process, and the data and controls are all accessed via various control rooms in a facility. Example: real-time location system (RTLS). An RTLS utilizes small and easily deployed Wi-Fi RFID tags that attach to virtually any material and provide real-time location and status. These tags enable a facility to track production as it happens. These IoT sensors allow components and materials on an assembly line to “talk” to the network. If each assembly line’s output is tracked in real time, decisions can be made to speed up or slow production to meet targets, and it is easy to determine how quickly employees are completing the various stages of production. Bottlenecks at any point in production and quality problems are also quickly identified.
  • 8. INTERNET OF THINGS 18CS81 AnithaMCAsst.Prof DEPT. OF ISE,SVIT Page 8 The IoT wave of Industry 4.0 takes manufacturing from a purely automated assembly line model of production to a model where the machines are intelligent and communicate with one another. IoT in manufacturing brings with it the opportunity for inserting intelligence into factories. This starts with creating smart objects, which involves embedding sensors, actuators, and controllers into just about everything related to production. 1.4.3 Smart Connected Buildings Another place IoT is making a disruptive impact is in the smart connected buildings space. In the past several decades, buildings have become increasingly complex, with systems overlaid one upon another, resulting in complex intersections of structural, mechanical, electrical, and IT components. Over time, these operational networks that support the building environment have matured into sophisticated systems; however, for the most part, they are deployed and managed as separate systems that have little to no interaction with each other. The function of a building is to provide a work environment that keeps the workers comfortable, efficient, and safe. Work areas need to be well lit and kept at a comfortable temperature. To keep workers safe, the fire alarm and suppression system needs to be carefully managed, as do the door and physical security alarm systems. Motion detection occupancy sensors work great if everyone is moving around in a crowded room and can automatically shut the lights off when everyone has left, but what if a person in the room is out of sight of the sensor? It is a frustrating matter to be at the mercy of an unintelligent sensor on the wall that wants to turn off the lights on you. Similarly, sensors are often used to control the heating, ventilation, and air-conditioning (HVAC) system. Temperature sensors are spread throughout the building and are used to influence the building management system’s (BMS’s) control of air flow into a room. Before you can bring together heterogeneous systems, they need to converge at the network layer and support a common services layer that allows application integration. For example, the de facto communication protocol responsible for building automation is known as BACnet (Building Automation and Control Network). In a nutshell, the BACnet protocol defines a set of services that allow Ethernet-based communication between building devices such as HVAC, lighting, access control, and fire detection systems. The same building Ethernet switches used for IT may also be used for BACnet. This standardization also makes possible an intersection point to the IP network (which is run by the IT department) through the use of a gateway device. In addition, BACnet/IP has been defined to allow the “things” in the building network to communicate over IP, thus allowing closer consolidation of the building management system on a single network. Figure 1-7 illustrates the conversion of building protocols to IP over time.
  • 9. INTERNET OF THINGS 18CS81 AnithaMCAsst.Prof DEPT. OF ISE,SVIT Page 9 Another promising IoT technology in the smart connected building, and one that is seeing widespread adoption, is the “digital ceiling.” The digital ceiling is more than just a lighting control system. This technology encompasses several of the building’s different networks—including lighting, HVAC, blinds, CCTV (closed-circuit television), and security systems—and combines them into a single IP network. Figure 1-8 provides a framework for the digital ceiling. Central to digital ceiling technology is the lighting system. As you are probably aware, the lighting market is currently going through a major shift toward light-emitting diodes (LEDs). Compared to traditional lighting, LEDs offer lower energy consumption and far longer life. The lower power requirements of LED fixtures allow them to run on Power over Ethernet (PoE), permitting them to be
  • 10. INTERNET OF THINGS 18CS81 AnithaMCAsst.Prof DEPT. OF ISE,SVIT Page 10 connected to standard network switches. In a digital ceiling environment, every luminaire or lighting fixture is directly network-attached, providing control and power over the same infrastructure. This transition to LED lighting means that a single converged network is now able to encompasses luminaires that are part of consolidated building management as well as elements managed by the IT network, supporting voice, video, and other data applications. The energy savings value of PoE-enabled LED lighting in the ceiling is clear. However, having an IP- enabled sensor device in the ceiling at every point people may be present opens up an entirely new set of possibilities. For example, most modern LED ceiling fixtures support occupancy sensors. These sensors provide high-resolution occupancy data collection, which can be used to turn the lights on and off, and this same data can be combined with advanced analytics to control other systems, such as HVAC and security. 1.4.4 Smart Creatures One of the most well-known applications of IoT with respect to animals focuses on what is often referred to as the “connected cow.” Sparked, a Dutch company, developed a sensor that is placed in a cow’s ear. The sensor monitors various health aspects of the cow as well as its location and transmits the data wirelessly for analysis by the farmer. The data from each of these sensors is approximately 200 MB per year, and you obviously need a network infrastructure to make the connection with the sensors and store the information. Once the data is being collected, however, you get a complete view of the herd, with statistics on every cow. You can learn how environmental factors may be affecting the herd as a whole and about changes in diet. This enables early detection of disease as cows tend to eat less days before they show symptoms. These sensors even allow the detection of pregnancy in cows. Another application of IoT to organisms involves the placement of sensors on roaches. Researchers at North Carolina State University are working with Madagascar hissing cockroaches in the hopes of helping emergency personnel rescue survivors after a disaster. An electronic backpack attaches to a roach. This backpack communicates with the roach through parts of its body. Low-level electrical pulses to an antenna on one side makes the roach turn to the opposite side because it believes it is encountering an obstacle. The cerci of the roach are sensory organs on the abdomen that detect danger through changing air currents. When the backpack stimulates the cerci, the roach moves forward because it thinks a predator is approaching. 1.5 CONVERGENCE OF IT AND OT IT supports connections to the Internet along with related data and technology systems and is focused on the secure flow of data across an organization. OT monitors and controls devices and processes on physical operational systems. These systems include assembly lines, utility distribution networks, production facilities, roadway systems, and many more.
  • 11. INTERNET OF THINGS 18CS81 AnithaMCAsst.Prof DEPT. OF ISE,SVIT Page 11 Table 1-3 highlights some of the differences between IT and OT networks and their various challenges. With the rise of IoT and standards-based protocols, such as IPv6, the IT and OT worlds are converging or, more accurately, OT is beginning to adopt the network protocols, technology, transport, and methods of the IT organization, and the IT organization is beginning to support the operational requirements used by OT. When IT and OT begin using the same networks, protocols, and processes, there are clear economies of scale. Not only does convergence reduce the amount of capital infrastructure needed but networks become easier to operate, and the flexibility of open standards allows faster growth and adaptability to new technologies.
  • 12. INTERNET OF THINGS 18CS81 AnithaMCAsst.Prof DEPT. OF ISE,SVIT Page 12 With the merging of OT and IT, improvements are being made to both systems. OT is looking more toward IT technologies with open standards, such as Ethernet and IP. At the same time, IT is becoming more of a business partner with OT by better understanding business outcomes and operational requirements. The overall benefit of IT and OT working together is a more efficient and profitable business due to reduced downtime, lower costs through economy of scale, reduced inventory, and improved delivery times. When IT/OT convergence is managed correctly, IoT becomes fully supported by both groups. This provides a “best of both worlds” scenario, where solid industrial control systems reside on an open, integrated, and secure technology foundation. 1.6 IOT CHALLENGES
  • 13. INTERNET OF THINGS 18CS81 AnithaMCAsst.Prof DEPT. OF ISE,SVIT Page 13 1.7 DRIVERS BEHIND NEW NETWORK ARCHITECTURES While the architect has extensive experience in designing homes, those skills will clearly not be enough to meet the demands of this new project. The scale of the stadium is several magnitudes larger, the use is completely different, and the wear and tear will be at a completely different level. The architect needs a new architectural approach that meets the requirements for building the stadium. The key difference between IT and IoT is the data. While IT systems are mostly concerned with reliable and continuous support of business applications such as email, web, databases, CRM systems, and so on, IoT is all about the data generated by sensors and how that data is used. The essence of IoT architectures thus involves how the data is transported, collected, analyzed, and ultimately acted upon. Table 2-1 takes a closer look at some of the differences between IT and IoT networks, with a focus on the IoT requirements that are driving new network architectures, and considers what adjustments are needed.
  • 14. INTERNET OF THINGS 18CS81 AnithaMCAsst.Prof DEPT. OF ISE,SVIT Page 14 Scale  The scale of a typical IT network is on the order of several thousand devices—typically printers, mobile wireless devices, laptops, servers, and so on.  IoT introduces a model where an average-sized utility, factory, transportation system, or city could easily be asked to support a network of this scale.  Based on scale requirements of this order, IPv6 is the natural foundation for the IoT network layer. Security  targeted malicious attacks using vulnerabilities in networked machines, such as the outbreak of the Stuxnet worm, which specifically affected Siemens programmable logic controller (PLC) systems.  Protecting corporate data from intrusion and theft is one of the main functions of the IT department. IT departments go to great lengths to protect servers, applications, and the The following sections expand on the requirements driving specific architectural changes for IoT.
  • 15. INTERNET OF THINGS 18CS81 AnithaMCAsst.Prof DEPT. OF ISE,SVIT Page 15 network, setting up defense-in-depth models with layers of security designed to protect the cyber crown jewels of the corporation.  IoT endpoints are often located in wireless sensor networks that use unlicensed spectrum and are not only visible to the world through a spectrum analyzer but often physically accessible and widely distributed in the field. For optimum security, IoT systems must:  Be able to identify and authenticate all entities involved in the IoT service  Ensure that all user data shared between the endpoint device and back-end applications is encrypted  Comply with local data protection legislation so that all data is protected and stored correctly  Utilize an IoT connectivity management platform and establish rules-based security policies so immediate action can be taken if anomalous behavior is detected from connected devices  Take a holistic, network-level approach to security Constrained Devices and Networks  Most IoT sensors have limited power, CPU, and memory, and they transmit only when there is something important.  Because of the massive scale of these devices and the large, uncontrolled environments where they are usually deployed, the networks that provide connectivity also tend to be very lossy and support very low data rates.  IoT requires a new breed of connectivity technologies that meet both the scale and constraint limitations. Data  In IoT the data is like gold, as it is what enables businesses to deliver new IoT services that enhance the customer experience, reduce cost, and deliver new revenue opportunities.  Although most IoT-generated data is unstructured, the insights it provides through analytics can revolutionize processes and create new business models.  IoT systems are designed to stagger data consumption throughout the architecture, both to filter and reduce unnecessary data going upstream and to provide the fastest possible response to devices when necessary. Legacy Device Support  In OT systems, end devices are likely to be on the network for a very long time—sometimes decades. As IoT networks are deployed, they need to support the older devices already present on the network, as well as devices with new capabilities.  In many cases, legacy devices are so old that they don’t even support IP.  IoT network must either be capable of some type of protocol translation or use a gateway device to connect these legacy endpoints to the IoT network.
  • 16. INTERNET OF THINGS 18CS81 AnithaMCAsst.Prof DEPT. OF ISE,SVIT Page 16 1.9 COMPARING IOT ARCHITECTURES The aforementioned challenges and requirements of IoT systems have driven a whole new discipline of network architecture. In the past several years, architectural standards and frameworks have emerged to address the challenge of designing massive-scale IoT networks. The foundational concept in all these architectures is supporting data, process, and the functions that endpoint devices perform. Two of the best-known architectures are those supported by oneM2M and the IoT World Forum (IoTWF), discussed in the following sections. The one M2M IoT Standardized Architecture oneM2M’s framework focuses on IoT services, applications, and platforms which include smart metering applications, smart grid, smart city automation, e-health, and connected vehicles. One of the greatest challenges in designing an IoT architecture is dealing with the heterogeneity of devices, software, and access methods. By developing a horizontal platform architecture, oneM2M is developing standards that allow interoperability at all levels of the IoT stack. oneM2M’s horizontal framework and RESTful APIs allow the LoRaWAN system to interface with the building management system over an IoT network, thus promoting end-to-end IoT communications in a consistent way, no matter how heterogeneous the networks. Applications layer:  It includes the application-layer protocols and attempts to standardize northbound API definitions for interaction with business intelligence (BI) systems.  Applications tend to be industry-specific and have their own sets of data models, and thus they are shown as vertical entities.
  • 17. INTERNET OF THINGS 18CS81 AnithaMCAsst.Prof DEPT. OF ISE,SVIT Page 17 Services layer:  The horizontal modules include the physical network that the IoT applications run on, the underlying management protocols, and the hardware. Examples include backhaul communications via cellular, MPLS networks, VPNs, and so on.  This conceptual layer adds APIs and middleware supporting third-party services and applications.  One of the stated goals of oneM2M is to “develop technical specifications which address the need for a common M2M Service Layer that can be readily embedded within various hardware and software nodes, and rely upon connecting the myriad of devices in the field area network to M2M application servers, which typically reside in a cloud or data center.” Network layer:  It includes the devices and the communications infrastructure which include wireless mesh technologies, such as IEEE 802.15.4, and wireless point-to-multipoint systems, such as IEEE 801.11ah.  Also included are wired device connections, such as IEEE 1901 power line communications.  The device domain includes the gateway device, which provides communications up into the core network and acts as a demarcation point between the device and network domains. IoT World Forum (IoTWF) Standardized Architecture The seven layers of the IoT Reference Model: Layer 1: Physical Devices and Controllers Layer  This layer is home to the “things” in the Internet of Things, including the various endpoint devices and sensors that send and receive information.  The primary function is generating data and being capable of being queried and/or controlled over a network.
  • 18. INTERNET OF THINGS 18CS81 AnithaMCAsst.Prof DEPT. OF ISE,SVIT Page 18 Layer 2: Connectivity Layer The primary function of this IoT layer is the reliable and timely transmission of data. The connectivity layer encompasses all networking elements of IOT and doesn’t really distinguish between the last mile network Layer 3: Edge Computing Layer At this layer, the emphasis is on data reduction and converting network data flows into information that is ready for storage and processing by higher layers. One of the basic principles of this reference model is that information processing is initiated as early and as close to the edge of the network as possible.
  • 19. INTERNET OF THINGS 18CS81 AnithaMCAsst.Prof DEPT. OF ISE,SVIT Page 19 Upper Layers: Layers 4–7 IT and OT Responsibilities in the IoT Reference Model  The bottom of the stack is generally in the domain of OT. For an industry like oil and gas, this includes sensors and devices connected to pipelines, oil rigs, refinery machinery, and so on.  The top of the stack is in the IT area and includes things like the servers, databases, and applications, all of which run on a part of the network controlled by IT.  At the bottom, in the OT layers, the devices generate real-time data at their own rate— sometimes vast amounts on a daily basis.
  • 20. INTERNET OF THINGS 18CS81 AnithaMCAsst.Prof DEPT. OF ISE,SVIT Page 20 Additional IoT Reference Models 1.10 A SIMPLIFIED IOT ARCHITECTURE
  • 21. INTERNET OF THINGS 18CS81 AnithaMCAsst.Prof DEPT. OF ISE,SVIT Page 21 Nearly every published IoT model includes core layers including “things,” a communications network, and applications. However, unlike other models, the framework presented here separates the core IoT and data management into parallel and aligned stacks, allowing you to carefully examine the functions of both the network and the applications at each stage of a complex IoT system. This separation gives you better visibility into the functions of each layer. The presentation of the Core IoT Functional Stack in three layers is meant to simplify your understanding of the IoT architecture into its most foundational building blocks. Of course, such a simple architecture needs to be expanded on. The network communications layer of the IoT stack itself involves a significant amount of detail and incorporates a vast array of technologies. Consider for a moment the heterogeneity of IoT sensors and the many different ways that exist to connect them to a network. The network communications layer needs to consolidate these together, offer gateway and backhaul technologies, and ultimately bring the data back to a central location for analysis and processing. Unlike with most IT networks, the applications and analytics layer of IoT doesn’t necessarily exist only in the data center or in the cloud. Due to the unique challenges and requirements of IoT, it is often necessary to deploy applications and data management throughout the architecture in a tiered approach, allowing data collection, analytics, and intelligent controls at multiple points in the IoT system. In the model presented in this book, data management is aligned with each of the three layers of the Core IoT Functional Stack. The three data management layers are the edge layer (data management within the sensors themselves), the fog layer (data management in the gateways and transit network), and the cloud layer (data management in the cloud or central data center). The communications layer is broken down into four separate sub-layers: the access network, gateways and backhaul, IP transport, and operations and management sub-layers.
  • 22. INTERNET OF THINGS 18CS81 AnithaMCAsst.Prof DEPT. OF ISE,SVIT Page 22 The applications layer of IoT networks is quite different from the application layer of a typical enterprise network. Instead of simply using business applications, IoT often involves a strong big data analytics component. One message that is stressed throughout that IoT is not just about the control of IoT devices but, rather the useful insights gained from the data generated by those devices. Thus, the applications layer typically has both analytics and industry-specific IoT control system components. 1.11 THE CORE IOT FUNCTIONAL STACK IoT networks are built around the concept of “things,” or smart objects performing functions and delivering new connected services. These objects are “smart” because they use a combination of contextual information and configured goals to perform actions. From an architectural standpoint, several components have to work together for an IoT network to be operational: A. “Things” layer: At this layer, the physical devices need to fit the constraints of the environment in which they are deployed while still being able to provide the information needed. B. Communications network layer: When smart objects are not self-contained, they need to communicate with an external system. In many cases, this communication uses a wireless technology. This layer has four sublayers: C. Access network sublayer: The last mile of the IoT network is the access network. This is typically made up of wireless technologies such as 802.11ah, 802.15.4g, and LoRa. The sensors connected to the access network may also be wired. D. Gateways and backhaul network sublayer: A common communication system organizes multiple smart objects in a given area around a common gateway. The gateway communicates directly with the smart objects. The role of the gateway is to forward the collected information through a longer-range medium (called the backhaul) to a headend central station where the information is processed. This information exchange is a Layer 7 (application) function, which is the reason this object is called a gateway. On IP networks, this gateway also forwards packets from one IP network to another, and it therefore acts as a router. E. Network transport sublayer: For communication to be successful, network and transport layer protocols such as IP and UDP must be implemented to support the variety of devices to connect and media to use. F. IoT network management sublayer: Additional protocols must be in place to allow the headend applications to exchange data with the sensors. Examples include CoAP and MQTT. G. Application and analytics layer: At the upper layer, an application needs to process the collected data, not only to control the smart objects when necessary, but to make intelligent decision based on the information collected and, in turn, instruct the “things” or other systems H. to adapt to the analyzed conditions and change their behaviors or parameters.
  • 23. INTERNET OF THINGS 18CS81 AnithaMCAsst.Prof DEPT. OF ISE,SVIT Page 23 The following sections examine these elements and help you architect your IoT communication network. Layer 1: Things: Sensors and Actuators Layer a) Battery-powered or power-connected: This classification is based on whether the object carries its own energy supply or receives continuous power from an external power source. Battery-powered things can be moved more easily than line-powered objects. However, batteries limit the lifetime and amount of energy that the object is allowed to consume, thus driving transmission range and frequency. b) Mobile or static: This classification is based on whether the “thing” should move or always stay at the same location. A sensor may be mobile because it is moved from one object to another (for example, a viscosity sensor moved from batch to batch in a chemical plant) or because it is attached to a moving object (for example, a location sensor on moving goods in a warehouse or factory floor). The frequency of the movement may also vary, from occasional to permanent. The range of mobility (from a few inches to miles away) often drives the possible power source. c) Low or high reporting frequency: This classification is based on how often the object should report monitored parameters. A rust sensor may report values once a month. A motion sensor may report acceleration several hundred times per second. Higher frequencies drive higher energy consumption, which may create constraints on the possible power source (and therefore the object mobility) and the transmission range. d) Simple or rich data: This classification is based on the quantity of data exchanged at each report cycle. A humidity sensor in a field may report a simple daily index value (on a binary scale from 0 to 255), while an engine sensor may report hundreds of parameters, from temperature to pressure, gas velocity, compression speed, carbon index, and many others. Richer data typically drives higher power consumption. This classification is often combined with the previous to determine the object data throughput (low throughput to high throughput). You may want to keep in mind that throughput is a combined metric. A medium-throughput object may send simple data at rather high frequency (in which case the flow structure looks continuous), or may send rich data at rather low frequency (in which case the flow structure looks bursty). e) Report range: This classification is based on the distance at which the gateway is located. For example, for your fitness band to communicate with your phone, it needs to be located a few meters away at most. The assumption is that your phone needs to be at visual distance for you to consult the reported data on the phone screen. If the phone is far away, you typically do not use it, and reporting data from the band to the phone is not necessary. By contrast, a moisture sensor in the asphalt of a road may need to communicate with its reader several hundred meters or even kilometers away.
  • 24. INTERNET OF THINGS 18CS81 AnithaMCAsst.Prof DEPT. OF ISE,SVIT Page 24 f) Object density per cell: This classification is based on the number of smart objects (with a similar need to communicate) over a given area, connected to the same gateway. An oil pipeline may utilize a single sensor at key locations every few miles. By contrast, telescopes like the SETI Colossus telescope at the Whipple Observatory deploy hundreds, and sometimes thousands, of mirrors over a small area, each with multiple gyroscopes, gravity, and vibration sensors. From a network architectural standpoint, your initial task is to determine which technology should be used to allow smart objects to communicate. Layer 2: Communications Network Layer Once you have determined the influence of the smart object form factor over its transmission capabilities (transmission range, data volume and frequency, sensor density and mobility), you are ready to connect the object and communicate. Compute and network assets used in IoT can be very different from those in IT environments. The difference in the physical form factors between devices used by IT and OT is obvious even to the most casual of observers. What typically drives this is the physical environment in which the devices are deployed. What may not be as inherently obvious, however, is their operational differences. The operational differences must be understood in order to apply the correct handling to secure the target assets. Temperature variances are an easily understood metric. The cause for the variance is easily attributed to external weather forces and internal operating conditions. Remote external locations, such as those associated with mineral extraction or pipeline equipment can span from the heat to the cold .
  • 25. INTERNET OF THINGS 18CS81 AnithaMCAsst.Prof DEPT. OF ISE,SVIT Page 25  Humidity fluctuations can impact the long-term success of a system as well.  Shock and vibration needs vary based on the deployment scenario.  Solid particulates can also impact the gear. Most IT environments must contend with dust build-up that can become highly concentrated due to the effect of cooling fans.  Hazardous location design may also cause corrosive impact to the equipment. Caustic materials can impact connections over which power or communications travel.  Furthermore, they can result in reduced thermal efficiency by potentially coating the heat transfer surfaces.  In some scenarios, the concern is not how the environment can impact the equipment but how the equipment can impact the environment.  Power supplies in OT systems are also frequently different from those commonly seen on standard IT equipment. A wider range of power variations are common attributes of industrial compute components. Access Network Sublayer Range estimates are grouped by category names that illustrate the environment or the vertical where data collection over that range is expected. Common groups are as follows:  PAN (personal area network): Scale of a few meters. This is the personal space around a person. A common wireless technology for this scale is Bluetooth.  HAN (home area network): Scale of a few tens of meters. At this scale, common wireless technologies for IoT include ZigBee and Bluetooth Low Energy (BLE).  NAN (neighborhood area network): Scale of a few hundreds of meters. The term NAN is often used to refer to a group of house units from which data is collected.
  • 26. INTERNET OF THINGS 18CS81 AnithaMCAsst.Prof DEPT. OF ISE,SVIT Page 26  FAN (field area network): Scale of several tens of meters to several hundred meters. FAN typically refers to an outdoor area larger than a single group of house units. The FAN is often seen as “open space” (and therefore not secured and not controlled). A FAN is sometimes viewed as a group of NANs, but some verticals see the FAN as a group of HANs or a group of smaller outdoor cells.  LAN (local area network): Scale of up to 100 m. This term is very common in networking, and it is therefore also commonly used in the IoT space when standard networking technologies (such as Ethernet or IEEE 802.11) are used. Figure 2-11 combines cost, range, power consumption, and typical available bandwidth for common IoT access technologies. The amount of data to carry over a given time period along with correlated power consumption (driving possible limitations in mobility and range) determines the wireless cell size and structure. Similar ranges also do not mean similar topologies. Some technologies offer flexible connectivity structure to extend communication possibilities:  Point-to-point topologies: These topologies allow one point to communicate with another point. This topology in its strictest sense is uncommon for IoT access, as it would imply that a single object can communicate only with a single gateway. However, several technologies are referred to as “point-to-point” when each object establishes an individual session with the gateway. The “point-to-point” concept, in that case, often refers to the communication structure more than the physical topology.  Point-to-multipoint topologies: These topologies allow one point to communicate with more than one other point. Most IoT technologies where one or more than one gateways communicate with multiple smart objects are in this category. However, depending on the features available on each communicating mode, several subtypes need to be considered. A particularity of IoT networks is that some nodes (for example, sensors) support both data
  • 27. INTERNET OF THINGS 18CS81 AnithaMCAsst.Prof DEPT. OF ISE,SVIT Page 27 collection and forwarding functions, while some other nodes (for example, some gateways) collect the smart object data, sometimes instruct the sensor to perform specific operations, and also interface with other networks or possibly other gateways. For this reason, some technologies categorize the nodes based on the functions (described by a protocol) they implement. To form a network, a device needs to connect with another device. When both devices fully implement the protocol stack functions, they can form a peer-to-peer network. However, in many cases, one of the devices collects data from the others. For example, in a house, temperature sensors may be deployed in each room or each zone of the house, and they may communicate with a central point where temperature is displayed and controlled. The sensor can implement a subset of protocol functions to perform just a specialized part (communication with the coordinator). Such a device is called a reduced-function device (RFD). An RFD cannot be a coordinator. An RFD also cannot implement direct communications to another RFD. The coordinator that implements the full network functions is called, by contrast, a full-function device (FFD). An FFD can communicate directly with another FFD or with more than one FFD, forming multiple peer-to-peer connections. Topologies where each FFD has a unique path to another FFD are called cluster tree topologies. FFDs in the cluster tree may have RFDs, resulting in a cluster star topology. Point-to-multipoint technologies allow a node to have more than one path to another node, forming a mesh topology. This redundancy means that each node can communicate with more than just one other node. This communication can be used to directly exchange information between nodes (the receiver directly consumes the information received) or to extend the range of the communication link. In this case, an intermediate node acts as a relay between two other nodes. These two other
  • 28. INTERNET OF THINGS 18CS81 AnithaMCAsst.Prof DEPT. OF ISE,SVIT Page 28 nodes would not be able to communicate successfully directly while respecting the constraints of power and modulation dictated by the PHY layer protocol. Another property of mesh networks is redundancy. The disappearance of one node does not necessarily interrupt network communications. Nodes A and D are too far apart to communicate directly. In this case, communication can be relayed through nodes B or C. Node B may be used as the primary relay. However, the loss of node B does not prevent the communication between nodes A and D. Here, communication is rerouted through another node, node C. Gateways and Backhaul Sublayer Data collected from a smart object may need to be forwarded to a central station where data is processed. As this station is often in a different location from the smart object, data directly received from the sensor through an access technology needs to be forwarded to another medium (the backhaul) and transported to the central station. The gateway is in charge of this inter-medium communication. In the DSRC case, the entire “sensor field” is moving along with the gateway, but the general principles of IoT networking remain the same. The range at which DSRC can communicate is limited. Similarly, for all other IoT architectures, the choice of a backhaul technology depends on the communication distance and also on the amount of data that needs to be forwarded. When the smart object’s operation is controlled from a local site, and when the environment is stable (for example, factory or oil and gas field), Ethernet can be used as a backhaul. Mesh is a common topology to allow communication flexibility in this type of dynamic environment. Table 2-4 compares the main solutions from an architectural angle.
  • 29. INTERNET OF THINGS 18CS81 AnithaMCAsst.Prof DEPT. OF ISE,SVIT Page 29 Distribution automation (DA) allows your meter to communicate with neighboring meters or other devices in the electrical distribution grid. With such communication, consumption load balancing may be optimized. For example, your air conditioning pulses fresh air at regular intervals. With DA, your neighbor’s AC starts pulsing when your system pauses; in this way, the air in both houses is kept fresh, but the energy consumed from the network is stable instead of spiking up and down with uncoordinated start and stop points. Similarly, your smart meter may communicate with your house appliances to evaluate their type and energy demand. With this scheme, your washing machine can be turned on in times of lower consumption from other systems, such as at night, while power to your home theater system will never be deprived, always turning on when you need it. Once the system learns your consumption pattern, charging of your electric car can start and stop at intervals to achieve the same overnight charge without creating spikes in energy demand. Data may flow locally, or it may have to be orchestrated by a central application to coordinate the power budget between houses. Network Transport Sub- llllayer
  • 30. INTERNET OF THINGS 18CS81 AnithaMCAsst.Prof DEPT. OF ISE,SVIT Page 30 This communication structure thus may involve peer-to-peer, point-to-point, point-to-multipoint, unicast and multicast communications. In a multitenant environment (for example, electricity and gas consumption management), different systems may use the same communication pathways. This communication occurs over multiple media (for example, power lines inside your house or a short- range wireless system like indoor Wi-Fi and/or ZigBee), a longer-range wireless system to the gateway, and yet another wireless or wired medium for backhaul transmission. To allow for such communication structure, a network protocol with specific characteristics needs to be implemented. The protocol needs to be open and standard-based to accommodate multiple industries and multiple media. Scalability (to accommodate thousands or millions of sensors in a single network) and security are also common requirements. IP is a protocol that matches all these requirements. The advantages of IP are covered in depth in Chapter 5. The flexibility of IP allows this protocol to be embedded in objects of very different natures, exchanging information over very different media, including low-power, lossy, and low-bandwidth networks. For example, RFC 2464 describes how an IPv6 packet gets encapsulated over an Ethernet frame and is also used for IEEE 802.11 Wi-Fi. Similarly, the IETF 6LoWPAN working group specifies how IPv6 packets are carried efficiently over lossy networks, forming an “adaption layer” for IPv6, primarily for IoT networks. Finally, the transport layer protocols built above IP (UDP and TCP) can easily be leveraged to decide whether the network should control the data packet delivery (with TCP) or whether the control task should be left to the application (UDP). UDP is a much lighter and faster protocol than TCP. However, it does not guarantee packet delivery. Both TCP and UDP can be secured with TLS/SSL (TCP) or DTLS (UDP). Chapter 6 takes a closer look at TCP and UDP for IoT networks. IoT Network Management Sub-layer IP, TCP, and UDP bring connectivity to IoT networks. Upper-layer protocols need to take care of data transmission between the smart objects and other systems. Multiple protocols have been leveraged or created to solve IoT data communication problems. Some networks rely on a push model (that is, a sensor reports at a regular interval or based on a local trigger), whereas others rely on a pull model (that is, an application queries the sensor over the network), and multiple hybrid approaches are also possible. Following the IP logic, some IoT implementers have suggested HTTP for the data transfer phase. After all, HTTP has a client and server component. The sensor could use the client part to establish a connection to the IoT central application (the server), and then data can be exchanged. You can find HTTP in some IoT applications, but HTTP is something of a fat protocol and was not designed to operate in constrained environments with low memory, low power, low bandwidth, and a high rate of packet failure. Despite these limitations, other web-derived protocols have been suggested for the IoT space. One example is WebSocket. WebSocket is part of the HTML5 specification, and provides a simple bidirectional connection over a single connection. Some IoT solutions use WebSocket to
  • 31. INTERNET OF THINGS 18CS81 AnithaMCAsst.Prof DEPT. OF ISE,SVIT Page 31 manage the connection between the smart object and an external application. WebSocket is often combined with other protocols, such as MQTT (described shortly) to handle the IoT-specific part of the communication. To respond to the limits of web-based protocols, another protocol was created by the IETF Constrained Restful Environments (CoRE) working group: Constrained Application Protocol (CoAP). CoAP uses some methods similar to those of HTTP (such as Get, Post, Put, and Delete) but implements a shorter list, thus limiting the size of the header. CoAP also runs on UDP (whereas HTTP typically uses TCP). CoAP also adds a feature that is lacking in HTTP and very useful for IoT: observation. Observation allows the streaming of state changes as they occur, without requiring the receiver to query for these changes. Layer 3: Applications and Analytics Layer Analytics Versus Control Applications A. Analytics application: - collects data from multiple smart objects - processes the collected data - displays information resulting from the data that was processed - application processes the data to convey a view of the network that cannot be obtained from solely looking at the information displayed by a single smart object. B. Control application: - controls the behavior of the smart object or the behavior of an object related to the smart object. - used for controlling complex aspects of an IoT network with a logic that cannot be programmed inside a single IoT object An example of control system architecture is SCADA. SCADA was developed as a universal method to access remote systems and send instructions. One example where SCADA is widely used is in the control and monitoring of remote terminal units (RTUs) on the electrical distribution grid. Data Versus Network Analytics A. Data analytics: - processes the data collected by smart objects and combines it to provide an intelligent view related to the IoT system. - data processing can be very complex and may combine multiple changing values over complex algorithms. - Data analytics can also monitor the IoT system itself. For example, a machine or robot in a factory can report data about its own movements.
  • 32. INTERNET OF THINGS 18CS81 AnithaMCAsst.Prof DEPT. OF ISE,SVIT Page 32 B. Network analytics: - A loss of connectivity may result in an accident or degradation of operations efficiency. - the control module cannot modify local object behaviors anymore. Data Analytics Versus Business Benefits A smarter architectural choice may be to allow for an open system where the network is engineered to be flexible enough that other sensors may be added in the future, and where both upstream and downstream operations are allowed. This flexibility allows for additional processing of the existing sensors and also deeper and more efficient interaction with the connected objects. This enhanced data processing can result in new added value for businesses that are not envisioned at the time when the system is initially deployed. An example of a flexible analytics and control application is Cisco Jasper, which provides a turnkey cloud-based platform for IoT management and monetization. Consider the case of vending machines deployed throughout a city. At a basic level, these machines can be connected, and sensors can be deployed to report when a machine is in an error state. A repair person can be sent to address the issue when such a state is identified. This type of alert is a time saver and avoids the need for the repair team to tour all the machines in turn when only one may be malfunctioning. This alert system may also avoid delay between the time when a machine goes into the error state and the time when a repair team visits the machine location. With a static platform, this use case is limited to this type of alert. With a flexible platform like Cisco Jasper, new applications may be imagined and developed over time. For example, the machine sensors can be improved to also report when an item is sold. The central application can then be enhanced to process this information and analyze what item is most sold, in what location, at what times. This new view of the machines may allow for an optimization of the items to sell in machines in a given area. Systems may be implemented to adapt the goods to time, season, or location—or many other parameters that may have been analyzed. In short, architecting open systems opens the possibility for new applications. Smart Services Fundamentally, smart services use IoT and aim for efficiency. For example, sensors can be installed on equipment to ensure ongoing conformance with regulations or safety requirements. This angle of efficiency can take multiple forms, from presence sensors in hazardous areas to weight threshold violation detectors on trucks. Smart services can also be used to measure the efficiency of machines by detecting machine output, speed, or other forms of usage evaluation. Entire operations can be optimized with IoT. In hospitality, for example, presence and motion sensors can evaluate the number of guests in a lobby and redirect personnel accordingly. The same type of action can be taken in a store where a customer is detected as staying longer than the typical amount of time in front of a shelf. Personnel can be
  • 33. INTERNET OF THINGS 18CS81 AnithaMCAsst.Prof DEPT. OF ISE,SVIT Page 33 deployed to provide assistance. Movement of people and objects on factory floors can be analyzed to optimize the production flow. Smart services can be integrated into an IoT system. For example, sensors can be integrated in a light bulb. A sensor can turn a light on or off based on the presence of a human in the room. An even smarter system can communicate with other systems in the house, learn the human movement pattern, and anticipate the presence of a human, turning on the light just before the person enters the room. An even smarter system can use smarter sensors that analyze multiple parameters to detect human mood and modify accordingly the light color to adapt to the learned preferences, or to convey either a more relaxing or a more dynamic environment. Light bulbs are a simple example. By connecting to other systems in the house, efficiencies can be coordinated. For example, the house entry alarm system or the heating system can coordinate with the presence detector in a light bulb to adapt to detected changes. The alarm system can disable volumetric movement alarms in zones where a known person is detected. The heating system can adapt the temperature to human presence or detected personal preferences. Similar efficiency can be extended to larger systems than a house. For example, smart grid applications can coordinate the energy consumption between houses to regulate the energy demand from the grid. We already mentioned that your washing machine may be turned on at night when the energy demand for heating and cooling is lower. Just as your air conditioning pulses can be coordinated with your neighbor’s, your washing machine cycles can be coordinated with the appliances in your house and in the neighborhood to smooth the energy demand spikes on the grid. Efficiency also applies to M2M communications. In mining environments, vehicles can communicate to regulate the flows between drills, draglines, bulldozers, and dump trucks, for example, making sure that a dump truck is always available when a bulldozer needs it. In smart cities, vehicles communicate. A traffic jam is detected and anticipated automatically by public transportation, and the system can temporarily reroute buses or regulate the number of buses servicing a specific line based on traffic and customer quantity, instantaneous or learned over trending. 1.12 IOT DATA MANAGEMENT AND COMPUTE STACK One of the key messages in the first two chapters of this book is that the massive scale of IoT networks is fundamentally driving new architectures. For instance, Figure 1-2 in Chapter 1 illustrates how the “things” connected to the Internet are continuing to grow exponentially, with a prediction by Cisco that by 2020 there will be more than 50 billion devices connected to some form of an IP network. Clearly, traditional IT networks are not prepared for this magnitude of network devices. However, beyond the network architecture itself, consider the data that is generated by these devices. If the number of devices is beyond conventional numbers, surely the data generated by these devices must also be of serious concern.
  • 34. INTERNET OF THINGS 18CS81 AnithaMCAsst.Prof DEPT. OF ISE,SVIT Page 34 In fact, the data generated by IoT sensors is one of the single biggest challenges in building an IoT system. In the case of modern IT networks, the data sourced by a computer or server is typically generated by the client/server communications model, and it serves the needs of the application. In sensor networks, the vast majority of data generated is unstructured and of very little use on its own. For example, the majority of data generated by a smart meter is nothing more than polling data; the communications system simply determines whether a network connection to the meter is still active. This data on its own is of very little value. The real value of a smart meter is the metering data read by the meter management system (MMS). However, if you look at the raw polling data from a different perspective, the information can be very useful. For example, a utility may have millions of meters covering its entire service area. If whole sections of the smart grid start to show an interruption of connectivity to the meters, this data can be analyzed and combined with other sources of data, such as weather reports and electrical demand in the grid, to provide a complete picture of what is happening. This information can help determine whether the loss of connection to the meters is truly a loss of power or whether some other problem has developed in the grid. Moreover, analytics of this data can help the utility quickly determine the extent of the service outage and repair the disruption in a timely fashion. In most cases, the processing location is outside the smart object. A natural location for this processing activity is the cloud. Smart objects need to connect to the cloud, and data processing is centralized. However, this model also has limitations. As data volume, the variety of objects connecting to the network, and the need for more efficiency increase. These new requirements include the following:  Minimizing latency: Analyzing data close to the device that collected the data can make a difference between averting disaster and a cascading system failure.  Conserving network bandwidth: It is not practical to transport vast amounts of data from thousands or hundreds of thousands of edge devices to the cloud. Nor is it necessary because many critical analyses do not require cloud-scale processing and storage.  Increasing local efficiency: Collecting and securing data across a wide geographic area with different environmental conditions may not be useful. The volume of data also introduces questions about bandwidth management. As the massive amount of IoT data begins to funnel into the data center, does the network have the capacity to sustain this volume of traffic? Does the application server have the ability to ingest, store, and analyze the vast quantity of data that is coming in? This is sometimes referred to as the “impedance mismatch” of the data generated by the IoT system and the management application’s ability to deal with that data. As illustrated in Figure 2-14, data management in traditional IT systems is very simple. The endpoints (laptops, printers, IP phones, and so on) communicate over an IP core network to servers in the data center or cloud. Data is generally stored in the data center, and the physical links from access to core are typically high bandwidth, meaning access to IT data is quick.
  • 35. INTERNET OF THINGS 18CS81 AnithaMCAsst.Prof DEPT. OF ISE,SVIT Page 35 IoT systems function differently. Several data-related problems need to be addressed: a) Bandwidth in last-mile IoT networks is very limited. When dealing with thousands/millions of devices, available bandwidth may be on order of tens of Kbps per device or even less. b) Latency can be very high. Instead of dealing with latency in the milliseconds range, large IoT networks often introduce latency of hundreds to thousands of milliseconds. c) Network backhaul from the gateway can be unreliable and often depends on 3G/LTE or even satellite links. Backhaul links can also be expensive if a per-byte data usage model is necessary. d) The volume of data transmitted over the backhaul can be high, and much of the data may not really be that interesting (such as simple polling messages). e) Big data is getting bigger. The concept of storing and analyzing all sensor data in the cloud is impractical. The sheer volume of data generated makes real-time analysis and response to the data almost impossible. Fog Computing The solution to the challenges mentioned in the previous section is to distribute data management throughout the IoT system, as close to the edge of the IP network as possible. The best-known embodiment of edge services in IoT is fog computing. Any device with computing, storage, and network connectivity can be a fog node. Examples include industrial controllers, switches, routers, embedded servers, and IoT gateways. Analyzing IoT data close to where it is collected minimizes latency, offloads gigabytes of network traffic from the core network, and keeps sensitive data inside the local network.
  • 36. INTERNET OF THINGS 18CS81 AnithaMCAsst.Prof DEPT. OF ISE,SVIT Page 36 i. Fog services are typically accomplished very close to the edge device, sitting as close to the IoT endpoints as possible. ii. The fog node has contextual awareness of the sensors it is managing because of its geographic proximity to those sensors. iii. The fog node is able to analyze information from all the sensors and can provide contextual analysis of the messages it is receiving and may decide to send back only the relevant information over the backhaul network to the cloud. IoT fog computing enables data to be preprocessed and correlated with other inputs to produce relevant information. This data can then be used as real-time, actionable knowledge by IoT-enabled applications. Longer term, this data can be used to gain a deeper understanding of network behavior and systems for the purpose of developing proactive policies, processes, and responses. Fog applications are as diverse as the Internet of Things itself. What they have in common is data reduction—monitoring or analyzing real-time data from network-connected things and then initiating an action, such as locking a door, changing equipment settings, applying the brakes on a train, zooming a video camera, opening a valve in response to a pressure reading, creating a bar chart, or sending an alert to a technician to make a preventive repair.
  • 37. INTERNET OF THINGS 18CS81 AnithaMCAsst.Prof DEPT. OF ISE,SVIT Page 37 Characteristic of fog computing are as follows: a) Contextual location awareness and low latency: The fog node sits as close to the IoT endpoint as possible to deliver distributed computing. b) Geographic distribution: In sharp contrast to the more centralized cloud, the services and applications targeted by the fog nodes demand widely distributed deployments. c) Deployment near IoT endpoints: Fog nodes are typically deployed in the presence of a large number of IoT endpoints. For example, typical metering deployments often see 3000 to 4000 nodes per gateway router, which also functions as the fog computing node. d) Wireless communication between the fog and the IoT endpoint: Although it is possible to connect wired nodes, the advantages of fog are greatest when dealing with a large number of endpoints, and wireless access is the easiest way to achieve such scale. e) Use for real-time interactions: Important fog applications involve real-time interactions rather than batch processing. Preprocessing of data in the fog nodes allows upper-layer applications to perform batch processing on a subset of the data. Edge Computing Fog computing solutions are being adopted by many industries, and efforts to develop distributed applications and analytics tools are being introduced at an accelerating pace. The natural place for a fog node is in the network device that sits closest to the IoT endpoints, and these nodes are typically spread throughout an IoT network. IoT devices and sensors often have constrained resources, however, as compute capabilities increase. Some new classes of IoT endpoints have enough compute capabilities to perform at least low-level analytics and filtering to make basic decisions. For example, consider a water sensor on a fire hydrant. While a fog node sitting on an electrical pole in the distribution network may have an excellent view of all the fire hydrants in a local neighborhood, a node on each hydrant would have clear view of a water pressure drop on its own line and would be able to quickly generate an alert of a localized problem. The fog node would have a wider view and would be able to ascertain whether the problem was more than just localized but was affecting the entire area. Another example is in the use of smart meters. Edge compute–capable meters are able to communicate with each other to share information on small subsets of the electrical distribution grid to monitor localized power quality and consumption, and they can inform a fog node of events that may pertain to only tiny sections of the grid. Models such as these help ensure the highest quality of power delivery to customers. The Hierarchy of Edge, Fog, and Cloud This model suggests a hierarchical organization of network, compute, and data storage resources. At each stage, data is collected, analyzed, and responded to when necessary, according to the capabilities of the resources at each layer. As data needs to be sent to the cloud, the latency becomes higher.
  • 38. INTERNET OF THINGS 18CS81 AnithaMCAsst.Prof DEPT. OF ISE,SVIT Page 38 Edge and fog thus require an abstraction layer that allows applications to communicate with one another. The abstraction layer : - exposes a common set of APIs for monitoring, provisioning, and controlling the physical resources in a standardized way. - requires a mechanism to support virtualization, with the ability to run multiple operating systems or service containers on physical devices to support multitenancy and application consistency across the IoT system. - From an architectural standpoint, fog nodes closest to the network edge receive the data from IoT devices. The fog IoT application then directs different types of data to the optimal place for analysis:  The most time-sensitive data is analyzed on the edge or fog node closest to the things generating the data.  Data that can wait seconds or minutes for action is passed along to an aggregation node for analysis and action.  Data that is less time sensitive is sent to the cloud for historical analysis, big data analytics, and long-term storage. For example, each of thousands or hundreds of thousands of fog nodes might send periodic summaries of data to the cloud for historical analysis and storage.