Download as PDF, PPTX
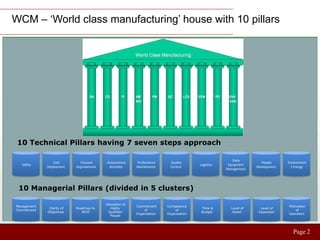
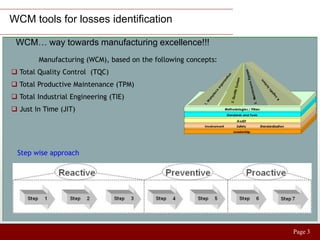


The document discusses World Class Manufacturing (WCM) and its 10 pillars and 10 technical steps. It outlines approaches to identify losses at various levels including plant, logistics, and yard management. Specific cases show optimizing finished goods inventory and automating invoicing processes to reduce space, inventory levels, and processing time. A second case demonstrates deploying improvements horizontally by changing body transportation to increase carrying capacity and reduce costs. The key is to measure losses, prioritize high impact projects, apply WCM tools to resolve issues, track results and horizontally expand successes.