
Recommended
More Related Content
Recently uploaded
Recently uploaded (20)
Featured
Featured (20)
Tree diagrams Lesson
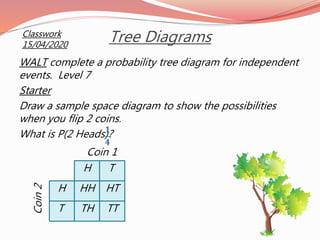
- 1. Tree Diagrams WALT complete a probability tree diagram for independent events. Level 7 Starter Draw a sample space diagram to show the possibilities when you flip 2 coins. What is P(2 Heads)? Classwork 15/04/2020 Coin 1 Coin2 H T H T HH HT TH TT 𝟏 𝟒
- 2. I flip two coins, what is the probability that I get two heads? Heads Tails Heads Tails Heads Tails 1 2 1 2 1 2 1 2 1 2 1 2 P(HH) = x =1 2 1 2 1 4 P(HT) = x =1 2 1 2 1 4 P(TH) = x =1 2 1 2 1 4 P(TT) = x =1 2 1 2 1 4 Coin 1 Coin 2 Probabilities on each branch add up to 1 Possible outcomes are shown on the end of the branches Multiply along the branches to work out the probabilities P(HH) = 1 4
- 3. Helen passes through 2 sets of traffic lights on her way to work. The probability that she stops at the first set is 0.3 The probability that she stops at the second set is 0.2 What is the probability that she has to stop exactly once? Stops Doesn’t Stop Stops Doesn’t Stop Stops Doesn’t Stop 3 10 0.7 0.8 0.2 0.8 0.2 P(SS) = 0.3 x 0.2 = 0.06 P(SD) = 0.3 x 0.8 = 0.24 P(DS) = 0.7 x 0.2 = 0.14 P(DD) = 0.7 x 0.8 = 0.56 Lights 1 Lights 2 = 0.24 + 0.14 = 0.38
- 4. Red Blue Blue Blue Red Red 7 10 6 9 3 9 3 10 2 9 7 9 I have a bag of sweets, 3 blue and 7 red. I pick one sweet out without looking, eat it and then pick out and eat a second sweet. What is the probability that I eat one blue and one red sweet? Sweet 1 Sweet 2 P(RR) = x =7 10 6 9 42 90 P(RB) = x =7 10 3 9 21 90 P(BR) = x =3 10 7 9 21 90 P(BB) = x =3 10 2 9 6 90 42 90 7 15 =
Editor's Notes
- Plenary