
Recommended
Recommended
More Related Content
What's hot
What's hot (20)
Similar to Indiana Public Finance Weekly Review - Market Data & Analysis (04-01-2019)
Similar to Indiana Public Finance Weekly Review - Market Data & Analysis (04-01-2019) (13)
Recently uploaded
Recently uploaded (20)
Indiana Public Finance Weekly Review - Market Data & Analysis (04-01-2019)
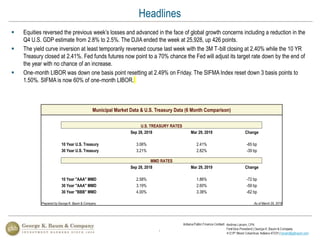
- 1. 1 Municipal Market Data & U.S. Treasury Data (6 Month Comparison) U.S. TREASURY RATES Sep 28, 2018 Mar 29, 2019 Change 10 Year U.S. Treasury 3.06% 2.41% -65 bp 30 Year U.S. Treasury 3.21% 2.82% -39 bp MMD RATES Sep 28, 2018 Mar 29, 2019 Change 10 Year "AAA" MMD 2.58% 1.86% -72 bp 30 Year "AAA" MMD 3.19% 2.60% -59 bp 30 Year "BBB" MMD 4.00% 3.38% -62 bp Prepared by George K. Baum & Company As of March 29, 2019 Equities reversed the previous week’s losses and advanced in the face of global growth concerns including a reduction in the Q4 U.S. GDP estimate from 2.8% to 2.5%. The DJIA ended the week at 25,928, up 426 points. The yield curve inversion at least temporarily reversed course last week with the 3M T‐bill closing at 2.40% while the 10 YR Treasury closed at 2.41%. Fed funds futures now point to a 70% chance the Fed will adjust its target rate down by the end of the year with no chance of an increase. One‐month LIBOR was down one basis point resetting at 2.49% on Friday. The SIFMA Index reset down 3 basis points to 1.50%. SIFMA is now 60% of one‐month LIBOR. Headlines
- 2. 2 Current Municipal Market Data Maturity "AAA" "AA" "A" "BBB" 5-year 1.57% 1.63% 1.89% 2.28% 10-year 1.86% 1.98% 2.22% 2.61% 20-year 2.44% 2.64% 2.87% 3.22% 30-year 2.60% 2.80% 3.03% 3.38% Prepared by George K. Baum & Company As of March 29, 2019 Rates continue to be lower than historical averages. To date, 30 Year ‘AAA’ MMD is 152 basis points below the 20 year historical average. Historical Fixed Rate Analysis UST Rates 'AAA' MMD Bond Buyer Indices Data 10-Year 30-Year 10-Year % UST 30-Year % UST 20 GO 25 Rev Spot Rate 2.41 2.82 1.86 77.3 2.60 92.4 3.79 4.26 1-Mo Prior 2.76 3.12 2.13 77.3 3.00 96.0 4.19 4.66 1-Yr Prior 2.74 2.97 2.42 88.3 2.95 99.2 3.89 4.37 5 Yr Avg 2.34 2.92 2.10 89.7 2.92 99.8 3.74 4.17 10 Yr Avg 2.50 3.33 2.28 91.2 3.38 101.6 4.00 4.57 Historical Data Since March 1999 (20 Years) Min 1.36 2.10 1.31 96.4 1.95 92.9 2.80 2.98 Max 6.77 6.70 5.37 79.4 6.04 90.2 6.09 6.48 Avg 3.57 4.19 3.13 87.8 4.12 98.2 4.44 4.92 Prepared by George K. Baum & Company As of March 29, 2019 Today’s Capital Markets
- 3. 3 0.00 1.00 2.00 3.00 4.00 5.00 6.00 7.00 1 5 10 15 20 25 30 % Maturity As of March 29, 2019 'AAA' MMD 'AA' MMD 'A' MMD 'BBB' MMD Current Market "MMD" Yield CurveCurrent MMD Yield Curve The Current MMD yield curve continues to remain positively sloped. Long Term Fixed Interest Rates
- 4. 4 0.00 0.50 1.00 1.50 2.00 2.50 3.00 3.50 1 5 10 15 20 25 30 % Maturity March 2018 to Present Mar 29, 2019 Mar 01, 2019 Sep 28, 2018 Mar 30, 2018 Historical 'AAA' MMD Yield Curve Long Term Fixed Interest Rates Since March 16, 2018, 30 Year ‘AAA’ MMD rates have decreased 35 basis points.
- 5. 5 0.00 1.00 2.00 3.00 4.00 5.00 6.00 7.00 8.00 1999 2000 2001 2002 2003 2004 2005 2006 2007 2008 2009 2010 2011 2012 2013 2014 2015 2016 2017 2018 2019 % April 1999 to Present UST 2 Yr UST 5 Yr UST 10 Yr UST 30 Yr 20 Year Historical U.S. Treasury Data Long Term Fixed Interest Rates
- 6. 6 0.00 1.00 2.00 3.00 4.00 5.00 6.00 7.00 8.00 1999 2000 2001 2002 2003 2004 2005 2006 2007 2008 2009 2010 2011 2012 2013 2014 2015 2016 2017 2018 2019 % April 1999 to Present 10 Yr 'AAA' MMD 10 Yr 'AAA' MMD Avg 10 Yr UST 10 Yr UST Avg 10 Yr UST to MMD % Current Market "MMD" Yield Curve20 Year Historical 'AAA' MMD & U.S. Treasury Data 10 Year U.S. Treasuries and 10 Year ‘AAA’ MMD remain highly correlated at 97%. Long Term Fixed Interest Rates
- 7. 7 0.00 2.00 4.00 6.00 8.00 10.00 12.00 1986 1988 1990 1992 1994 1996 1998 2000 2002 2004 2006 2008 2010 2012 2014 2016 2018 % July 1986 to Present BB 25 Rev Bond Index Average (5.61%) Current (4.26%) Current Market "MMD" Yield CurveHistorical Bond Buyer 25 Revenue Bond Index The Bond Buyer 25 Revenue Bond Index is currently at 4.26% compared to the average of 5.61%. Long Term Fixed Interest Rates
- 8. 8 0.00 0.50 1.00 1.50 2.00 2.50 3.00 3.50 4.00 4.50 2009 2010 2011 2012 2013 2014 2015 2016 2017 2018 2019 % April 2009 to Present SIFMA Swap 30 Yr SIFMA Swap 20 Yr SIFMA Swap 10 Yr 67% 1M LIBOR Swap 30 Yr 67% 1M LIBOR Swap 20 Yr 67% 1M LIBOR Swap 10 Yr Current Market "MMD" Yield Curve10 Year Hist Swap Rates: 10, 20, 30 Yr SIFMA & 67% of 1M LIBOR The 30 Year SIFMA swap rate decreased 4 basis points, while the 30 Year 67% of 1M LIBOR swap rate decreased 3 basis points from the prior week. Long Term Swap Rates
- 9. 9 0.00 1.00 2.00 3.00 4.00 5.00 6.00 7.00 8.00 9.00 1999 2000 2001 2002 2003 2004 2005 2006 2007 2008 2009 2010 2011 2012 2013 2014 2015 2016 2017 2018 2019 % April 1999 to Present SIFMA Index 67% of 1M LIBOR SIFMA Index Current Market "MMD" Yield Curve20 Year Variable Rate History: 67% of 1M LIBOR & SIFMA DataCurrent Market "MMD" Yield Curve20 Year Variable Rate History: 67% of 1M LIBOR & SIFMA Data The SIFMA Index set at 1.50, down 3 basis points from the prior week. Short Term Variable Interest Rates
- 10. 10 0.00 1.00 2.00 3.00 4.00 5.00 6.00 7.00 1 5 10 15 20 25 30 % Maturity As of March 29, 2019 BBB SIFMA Swap Rate 67% of 1M LIBOR Swap Rate Current Market "MMD" Yield CurveCurrent Market 'BBB' MMD Yield Curve & Swap Rates Current 30 Year 67% of 1M LIBOR swap rates and 30 Year SIFMA swap rates are showing much lower rates than Current ‘BBB’ rates in the market. Current ‘BBB’ MMD & Variable Interest Rates
- 11. 11 0.00 1.00 2.00 3.00 4.00 5.00 6.00 7.00 8.00 9.00 1999 2000 2001 2002 2003 2004 2005 2006 2007 2008 2009 2010 2011 2012 2013 2014 2015 2016 2017 2018 2019 % April 1999 to Present SIFMA Index 1M LIBOR BB 25 Rev Index UST 10 Yr 20 Year Historical Benchmark Rates The following data shows the divergence between current variable and fixed rate indices. Historical Benchmark Rates
- 12. 12 0 50 100 150 200 250 300 0.00 1.00 2.00 3.00 4.00 5.00 6.00 7.00 8.00 9.00 10.00 1999 2001 2003 2005 2007 2009 2011 2013 2015 2017 2019 Spread (bps)% April 1999 to Present 30 Yr 'BBB' MMD Spread 30 Yr 'A' MMD Spread 30 Yr 'AA' MMD Spread 30 Yr 'AAA' MMD Current Market "MMD" Yield Curve20 Year Historical 'AAA' MMD Tax -Exempt Credit Spread Data Current Tax Exempt Credit Spreads are 20, 43, and 78, basis points for ‘AA’, ‘A’, and ‘BBB’ respectively ‘AAA’ MMD Tax-Exempt Credit Spreads
- 13. 13 ($4,000) ($2,000) $0 $2,000 $4,000 $6,000 $8,000 2014 2015 2016 2017 2018 2019 $000's April 2014 to Present 5 Year Historical Municipal Bond Fund Flow Changes Municipal Bond Funds increased by $1.24 Billion from the prior week Municipal Bond Fund Flow Changes
- 14. 14 Money Market Fund Flow Changes Tax Exempt Money Market Funds decreased $1.06 Billion from the prior week. Money Market Funds increased $31.60 Billion from the prior week. $(70,000) $(50,000) $(30,000) $(10,000) $10,000 $30,000 $50,000 2014 2015 2016 2017 2018 2019 $000's April 2014 to Present 5 Year Historical Money Market Fund Flow Changes $(10,000) $(5,000) $- $5,000 $10,000 $15,000 2014 2015 2016 2017 2018 2019 $000's April 2014 to Present 5 Year Historical Tax-Exempt Money Market Fund Flow Changes
- 15. 15 $- $5,000 $10,000 $15,000 $20,000 $25,000 Nov 2015 May 2016 Nov 2016 May 2017 Nov 2017 May 2018 Nov 2018 $ Millions November 2015 to Present Historical Tax-Exempt Bond Issuance Tax Exempt Bond Issuance increased by $9.67 Billion from the prior week. Tax Exempt Bond Issuance
- 16. 16 George K. Baum & Company does not endorse, guaranty or approve, and assumes no responsibility for, the content, accuracy, reliability, or completeness of the information contained in the following presentation. The information in the following presentation was compiled from sources believed to be reliable for informational purposes only. Presentations are intended for educational purposes only and do not replace independent, professional judgment. You should not take, or refrain from taking action based on its content. The opinions expressed by each presenter are theirs alone and may not necessarily represent those of employers, institutions or other entity affiliated with each presenter. Any and all information contained therein is not intended to constitute legal advice and accordingly, you should consult with your own attorneys regarding the application or impact of any of the information for your specific situation, needs or use. Disclaimer