
Recommended
Recommended
More Related Content
What's hot
What's hot (20)
Similar to Coupling the water and carbon cycles using transpiration and primary production data for improved global land-surface modelling
Similar to Coupling the water and carbon cycles using transpiration and primary production data for improved global land-surface modelling (20)
Recently uploaded
Recently uploaded (20)
Coupling the water and carbon cycles using transpiration and primary production data for improved global land-surface modelling
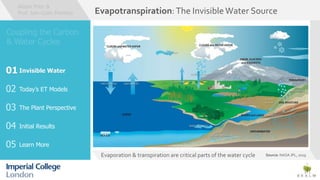
- 1. Evaporation & transpiration are critical parts of the water cycle Evapotranspiration:The InvisibleWater Source Source: NASA JPL, 2019 Invisible Water Today’s ET Models Learn More 01 The Plant Perspective Initial Results
- 2. Global error in satellite-based ET estimates against Source: Talsma et al. (2018) DOI: 10.1016/j.agrformet.2018.05.010 ALEXI CMRSET SSEBop MODIS Variation in satellite-based ET estimates in the Mékrou River Basin, Niger tributary, Africa Source: A. Prior (2016). Masters Thesis. Evapotranspiration: A Need for Reliable Data Invisible Water Today’s ET Models Learn More 02 Total ET Error: 35 - 49% r2: 0.61 - 0.75 Transpiration Error: 54 - 114%, r2: 0.33 - 0.55 Evaporation Error: 90 - 114%, r2: 0.14 - 0.25 Interception Error: 62 - 181%, r2: 0.39 - 0.85 The Plant Perspective Initial Results
- 3. Plants: Exchanging Carbon & Water Click ‘next’ or tap screen to see more! Invisible Water Today’s ET Models Learn More The Plant Perspective03 Initial Results
- 4. Initial Results Tap & Explore! ModelTest Sites A Coupled Model: Initial GPP &Transpiration Results GPPTranspiration Average daily transpiration estimates (mm) for all displayed sites for the period 2002 to 2012 showing [a] annual variation for the period and [b] seasonality. Daily GPP estimates for all displayed sites for the period 2002 to 2012. Invisible Water Today’s ET Models Learn More The Plant Perspective Initial Results04
- 5. More information about the P model Preliminary results: Simultaneous prediction ofTranspiration (T) & Global Primary Production (GPP) Next steps in this research Limitations The P Model Team Learn More about this research! PICO Screen 5b.3 Invisible Water Today’s ET Models Learn More05 The Plant Perspective Initial Results
- 6. Initial Results Tap & Explore! ModelTest Sites A Coupled Model: Initial GPP &Transpiration Results GPPTranspiration Average daily transpiration estimates (mm) for Finland’s Hyytiala FLUXNET site for the period 2002 to 2012 showing [a] annual variation and [b] seasonality. Average daily GPP estimates at Hyytalia for the period 2002 to 2012. USA“FI-Hyy” Hyytiala, Finland Elevation: 185 m Landuse: Evergreen Needleleaf Forest Period: 2002 - 2012 Validated against FLUXNET latent heat flux (converted to ET) Initial Transpiration & GPP calculations complete Transpiration too high. Input data needs pre-formatting. Site Information Calculation time step to be reviewed. Consider soil moisture effects. GPP: LOW Transpiration: MEDIUM Invisible Water Today’s ET Models Learn More The Plant Perspective Initial Results04
- 7. Initial Results Tap & Explore! ModelTest Sites A Coupled Model: Initial GPP &Transpiration Results GPPTranspiration Average daily transpiration estimates (mm) for France’s Puechabon FLUXNET site for the period 2002 to 2012 showing [a] annual variation and [b] seasonality. Average daily GPP estimates at Puechabon for the period 2002 - 2012. USA“FR- Pue” Puechabon, France Elevation: 211 m Landuse: Mixed Forests Period: 2002 - 2012 Validated against FLUXNET latent heat flux (converted to ET) Initial Transpiration & GPP calculations complete Transpiration too high. Input data needs pre-formatting. Site Information Calculation time step to be reviewed. Consider soil moisture effects. GPP: MEDIUM Transpiration: HIGH Invisible Water Today’s ET Models Learn More The Plant Perspective Initial Results04
- 8. Initial Results Tap & Explore! ModelTest Sites A Coupled Model: Initial GPP &Transpiration Results GPPTranspiration Average daily transpiration estimates (mm) for Italy’s Collelongo FLUXNET site for the period 2002 to 2012 showing [a] annual variation and [b] seasonality. Average daily GPP estimates at Collelongo for the period 2002 to 2012. USA“IT-Col” Collelongo, Italy Elevation: 1,645 m Landuse: Deciduous Broadleaf Forest Period: 2002 - 2012 Validated against FLUXNET latent heat flux (converted to ET) Initial Transpiration & GPP calculations complete GPP too high (compared with obs). Input data needs pre-formatting. Site Information Try with alternative input data to cross-check output. GPP: HIGH Transpiration: VERY LOW Invisible Water Today’s ET Models Learn More The Plant Perspective Initial Results04
- 9. Initial Results Tap & Explore! ModelTest Sites A Coupled Model: Initial GPP &Transpiration Results GPPTranspiration Average daily transpiration estimates (mm) for Belgium’s Brasschaat FLUXNET site for the period 2002 to 2012 showing [a] annual variation and [b] seasonality. Average daily GPP estimates at Brasschaat for the period 2002 to 2012. USA“BE-Bra” Brasschaat, Belgium Elevation: 15 m Landuse: Mixed Forests Period: 2002 - 2012 Re-run model and assess input data for suitability. Initial Transpiration & GPP calculations failed. Transpiration and GPP cannot be assessed. Failed model run. Site Information Data missing. Possible error occurred in PPFD calculation. GPP: ERROR Transpiration: ERROR Invisible Water Today’s ET Models Learn More The Plant Perspective Initial Results04
- 10. Initial Results Tap & Explore! ModelTest Sites A Coupled Model: Initial GPP &Transpiration Results GPPTranspiration Average daily transpiration estimates (mm) for Germany’s Hainich FLUXNET site for the period 2002 to 2012 showing [a] annual variation and [b] seasonality. Average daily GPP estimates at Hainich for the period 2002 to 2012. USA“DE-Hai” Hainich, Germany Elevation: 433 m Landuse: Mixed Forests Period: 2002 - 2012 Validated against FLUXNET latent heat flux (converted to ET) Initial Transpiration & GPP calculations complete Predicted transpiration fits well to observations. GPP high. Site Information GPP prediction significantly higher than observation data. Run with alternative fAPAR input. GPP: HIGH Transpiration: MEDIUM Invisible Water Today’s ET Models Learn More The Plant Perspective Initial Results04
- 11. Initial Results Tap & Explore! ModelTest Sites A Coupled Model: Initial GPP &Transpiration Results GPPTranspiration Average daily transpiration (mm) for the Uni of Michigan Biological Station from 2002 to 2012 showing [a] annual variation for the period and [b] seasonality. Daily average GPP for the University of Michigan FLUXNET site, 2002 to 2012. ‘US-UMB’ Uni of Michigan, USA Elevation: 228 m Landuse: Deciduous Broadleaf Forest Period: 2002 - 2012 Validated against FLUXNET latent heat flux (converted to ET). Initial Transpiration & GPP calculations complete. Values are higher than expected and higher than observations. Site Information Re-run model with alternative meteorological and fAPAR data. GPP: HIGH Transpiration: HIGH EU Invisible Water Today’s ET Models Learn More The Plant Perspective Initial Results04
- 12. One model to simulate Global Primary Production (GPP) & Transpiration (T). The P Model effectively predicts CO2 uptake by plants Based on fundamental scientific knowledge: • Light Use Efficiency (LUE) • Standard model of photosynthesis Readily available input data: No land use or vegetation map required! The P model calculates stomatal conductance to determine photosynthetic trade-offs. This can be modified to estimate transpiration. P Model: Effectively Predicting CO2 Go back Example GPP Results See the Algorithm Required Input Data Press the buttons to learn more! Did you know? The ”P” in P model stands for production! Invisible Water Today’s ET Models Learn More05 The Plant Perspective Initial Results
- 13. TEST NEW INPUT DATA ( E.G. SENTINEL 3) TO OBTAIN LIVE T & GPP ESTIMATES TESTING P MODEL RESULTS IN HYDROLOGICAL MODELS THE BASIS FOR A NEW GLOBAL SATELLITE PRODUCT TO PREDICT T AND GPP? BENCHMARK NEW PRODUCT AGAINST OTHERS FOR QUALITY CONTROL IMPROVE ET PARTITIONING & ANALYSE RESULTS BY VEGETATION TYPE Next Steps: Planning & Dreaming Go back Invisible Water Today’s ET Models Learn More05 The Plant Perspective Initial Results
- 14. 𝑚 = (𝐶 𝑎 − Γ∗ ) 𝐶 𝑎 + 2Γ∗ + 3Γ∗ 1.6 ∙ 𝜂∗∙ 𝐷0 ∙ 𝛽−1 𝐾 + Γ∗ −1 𝑮𝑷𝑷 = 𝑰𝑷𝑨𝑹 × 𝒇𝑨𝑷𝑨𝑹 × 𝑳𝑼𝑬 𝒎𝒂𝒙 P Model:The Algorithm C3C4 𝐺𝑃𝑃 = 𝐼 𝑎𝑏𝑠 ∙ 𝜙0 Go back See: Han et al. (2017)Towards a universal model for carbon dioxide uptake by plants. Nature Plants volume 3, pages 734–741. https://www.nature.com/articles/s41477-017-0006-8 Example GPP Results Required Input Data 𝑮𝑷𝑷 = 𝑰𝑷𝑨𝑹 × 𝒇𝑨𝑷𝑨𝑹 × 𝑳𝑼𝑬 𝒎𝒂𝒙 𝐺𝑃𝑃 = 𝐼 𝑎𝑏𝑠 ∙ 𝜙0 ∙ 𝑚 1 − 𝑐∗/𝑚 2/3 𝐺𝑃𝑃 = 𝐼 𝑎𝑏𝑠 ∙ 𝜙0 𝑮𝑷𝑷 = 𝑰𝑷𝑨𝑹 × 𝒇𝑨𝑷𝑨𝑹 × 𝑳𝑼𝑬 𝒎𝒂𝒙 𝐺𝑃𝑃 = 𝐼 𝑎𝑏𝑠 ∙ 𝜙0 𝐺𝑃𝑃 = 𝐼 𝑎𝑏𝑠 ∙ 𝜙0 ∙ 𝑚 1 − 𝑐∗/𝑚 2/3𝐺𝑃𝑃 = 𝐼 𝑎𝑏𝑠 ∙ 𝜙0 ∙ 𝑚 1 − 𝑐∗/𝑚 2/3𝐺𝑃𝑃 = 𝐼 𝑎𝑏𝑠 ∙ 𝜙0 ∙ 𝑚 1 − 𝑐∗/𝑚 2/3 𝑚 = (𝐶 𝑎 − Γ∗ ) 𝐶 𝑎 + 2Γ∗ + 3Γ∗ 1.6 ∙ 𝜂∗∙ 𝐷0 ∙ 𝛽−1 𝐾 + Γ∗ −1 𝜑0 is the intrinsic quantum yield (1.02 g C / mol), 𝐼 𝑎𝑏𝑠 is the absorbed photosynthetic photon flux density (PPFD, mol /m2/s), Γ∗ is the photorespiratory compensation point (Pa), K is the effective Michaelis-Menten coefficient of Rubisco (Pa), 𝜂∗ is the viscosity of water relative to its value at 25 degrees Celsius, 𝛽 ≈240 from the constant C in the equation for optimal leaf internal to external carbon dioxide ratio (𝜒0), 𝑐∗ ≈ 0.41 is estimated from observed 𝐽 𝑚𝑎𝑥: 𝑉𝑐 𝑚𝑎𝑥 ratios proportional to the unit carbon cost for the maintenance of electron transport capacity. Invisible Water Today’s ET Models Learn More05 The Plant Perspective Initial Results
- 15. P Model: Input Data Requirements Go back Example GPP Results See the Algorithm bitbucket.org/labprentice github.com/stineb/rsofunCheck out the code & try the model yourself! Invisible Water Today’s ET Models Learn More05 The Plant Perspective Initial Results
- 16. P Model: Sample Global GPP Result Go back See the Algorithm Work by ShirleyWenjia Cai. Learn more at her talk @ EGU!Required Input Data Invisible Water Today’s ET Models Learn More05 The Plant Perspective Initial Results
- 17. Validation: verification of transpiration estimates at global scale is difficult due to scarcity of high quality observations. Uptake: how could this knowledge and potential new product be implemented into ESMs, Hydrological Models, etc? The P model works effectively on land, but has difficulty accurately predicting GPP over water bodies and in very arid areas. The team are busy testing new features, like how soil moisture impacts GPP and what happens when 𝜑0 becomes temperature- dependent? P Model: Limitations & Potential Challenges Go back Invisible Water Today’s ET Models Learn More05 The Plant Perspective Initial Results
- 18. P Model: Related Research This research is funded by the Reinventing Ecosystem And Land Surface Models (REALM) project More information: a.prior18@imperial.ac.uk P Model Development Prof. Iain-Colin Prentice EGU2019-7806: Thursday 14:15 ■ Room 2.44 GlobalGPP Product ShirleyWenjia Cai EGU2019-15713: Wednesday 16:30 ■ Room 2.31 GPP Predication at Altitude David Sandoval EGU2019-10436: Tuesday 10:45 am ■ Hall X5 Tree RingValidation of GPP Alienor Lavergne EGU2019-11197: Friday 10:45 am ■ Hall A Go back ★see example!★ Invisible Water Today’s ET Models Learn More05 The Plant Perspective Initial Results