
Recommended
Recommended
More Related Content
What's hot
What's hot (16)
Similar to Pricing analysis with DataRobot at NTUC Income
Similar to Pricing analysis with DataRobot at NTUC Income (20)
Recently uploaded
Recently uploaded (20)
Pricing analysis with DataRobot at NTUC Income
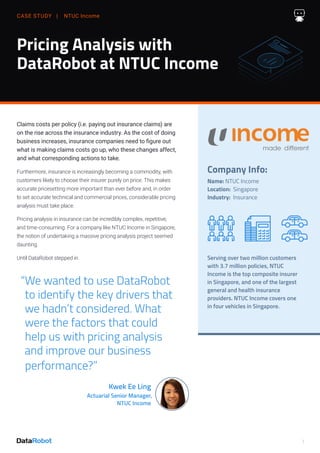
- 1. CASE STUDY | NTUC Income 1 Pricing Analysis with DataRobot at NTUC Income “We wanted to use DataRobot to identify the key drivers that we hadn’t considered. What were the factors that could help us with pricing analysis and improve our business performance?” Kwek Ee Ling Actuarial Senior Manager, NTUC Income Claims costs per policy (i.e. paying out insurance claims) are on the rise across the insurance industry. As the cost of doing business increases, insurance companies need to figure out what is making claims costs go up, who these changes affect, and what corresponding actions to take. Furthermore, insurance is increasingly becoming a commodity, with customers likely to choose their insurer purely on price. This makes accurate pricesetting more important than ever before and, in order to set accurate technical and commercial prices, considerable pricing analysis must take place. Pricing analysis in insurance can be incredibly complex, repetitive, and time-consuming. For a company like NTUC Income in Singapore, the notion of undertaking a massive pricing analysis project seemed daunting. Until DataRobot stepped in. Company Info: Name: NTUC Income Location: Singapore Industry: Insurance Serving over two million customers with 3.7 million policies, NTUC Income is the top composite insurer in Singapore, and one of the largest general and health insurance providers. NTUC Income covers one in four vehicles in Singapore.
- 2. Life at NTUC Income Before DataRobot NTUC Income is part of the National Trades Union Congress, the sole national trade union center in Singapore comprised of 58 trade unions and 10 social enterprises. These social enterprises were established by the government to help stabilize the price of commodities and services, strengthen the purchasing power of workers, and to promote better labor-management relations. Social enterprises within NTUC include NTUC FairPrice (a national grocery chain), NTUC Health, and NTUC Income. NTUC Income is the only insurance cooperative in Singapore, providing life, health, and general insurance products to over two million customers across the country. It is both the top composite insurer in Singapore, as well as the largest automobile insurer. NTUC Income was no stranger to the rising claims costs that have been affecting the insurance industry as a whole and turned to DataRobot in 2017. “We wanted to use DataRobot to identify the key drivers that we hadn’t considered,” said Kwek Ee Ling, NTUC Income’s Actuarial Senior Manager. “What were that factors that could help us with pricing analysis and ultimately improve our business performance?” Traditionally, actuaries use Generalized Linear Models (GLMs) to undertake a pricing analysis project, and NTUC Income’s actuarial team was no different. Unfortunately, GLMs are not the ideal solution for a variety of reasons: GLMs assume that the relationship between a rating factor and claim costs is a straight line, but that isn’t always true. If you fit GLM to data that assumes a straight line relationship when there isn’t one, you’ll get a weak model that misprices insurance policies. Because of that, the overall process then becomes very time-consuming. Actuaries end up spending a lot of time looking for the right mathematical transformations for rating factors, to turn crooked lines into straight ones. This requires a lot of manual coding, experimentation, and iterative improvements. Since actuaries don’t have time to test all possible patterns and math functions, they stick with what they are comfortable with, resulting in models that could be vastly improved and more accurate with more time and resources. Claim descriptions can provide vital information about claims trends. Yet GLMs cannot analyze text. “DataRobot is able to automate the analysis and it comes with a wide variety of machine learning models built-in.” — Moo Suh Sin, Actuary at NTUC Income CASE STUDY | NTUC Income 2
- 3. It is too time-consuming to identify and quantify interaction effects using GLMs. Yet many of these interaction effects are important for risk pricing relativities, e.g. inexperienced drivers operating high-performance vehicles is a much higher risk than can be independently explained by their inexperience or the vehicle type.With a scarcity of skilled data scientists, getting resources wasn’t a simple option for NTUC Income. Additionally, because such complex analysis required methods that most actuarial teams aren’t familiar with, there was a knowledge gap on the NTUC team to overcome. NTUC needed a solution that could address their price analysis challenges and scale with their team.The team used Feature Impact in DataRobot to identify the exposure factors with the most significant changes in a portfolio. “Before using DataRobot, we analyzed the data in Excel, which has many limitations in handling big data; slow speed, inability to process millions of rows, and an overall time-consuming process for us in building statistical models,” said Moo Suh Sin, an actuary at NTUC Income. “DataRobot is able to automate the analysis and it comes with a wide variety of machine learning models built-in.” “The speed of the platform is its strength where it can generate results in less than an hour, instead of a few days,” added Ee Ling. “The speed encourages more people in the department and company to be involved with data science.” Pricing Analysis via Automated Machine Learning Here’s a typical step-by-step process of what the pricing analysis project at NTUC Income generally looks like. All the data, findings, and screenshots below are taken from dummy data, and do not represent NTUC’s actual work. Colin Priest, DataRobot’s Director of Product Marketing (and former actuary) presenting with NTUC Income at the 10th General Insurance Conference in Singapore CASE STUDY | NTUC Income 3
- 4. STEP 1: LOOK FOR CHANGES IN EXPOSURE To start,the actuary team at NTUC used DataRobot to identify changes in exposure; was NTUC writing different risks? This analysis is important to discern the relative importance of different rating factors affecting insurance coverage and pricing. The team used Feature Impact in DataRobot to identify the exposure factors with the most significant changes in a portfolio. STEP 2. LOOK FOR CHANGES IN CLAIM FREQUENCY, AS WELL AS THE SEVERITY AND NATURE OF CLAIMS Similarly to changes in exposure, the actuaries at NTUC wanted to identify patterns related to how frequently claims were being paid out, as well as the severity and nature of these claims. With claims – and claims costs – going up, it was critical to zero in on why these claims were going up, as well as when they were going up and how they were increasing. Two capabilities within the DataRobot platform were used by the NTUC team: Feature Effects and the Word Cloud. Feature Effects helped the team see patterns in claim frequency and home in on details for the rating factor effects on claim frequency. Using this, the team was able to identify when claim frequency started increasing dramatically, and how the pattern has changed since its initial spike. In this (dummy data) example, claim frequency started increasing 18 months ago, stabilizing around 12 months ago. In this (dummy) example, the geographic mix and vehicle age mix are changing the most dramatically, an important piece of insight for the actuary team to know. CASE STUDY | NTUC Income 4
- 5. Meanwhile, the Word Cloud provided a simple and easy-to-understand visualization of how claim descriptions were changing over time, and which types of claims were emerging. The darker the color, the more predictive , with the size of the word representing how frequently it appeared within claims reports: According to this (dummy data) Word Cloud, which focused on workers compensation claims, recent claims have more soft tissue injuries – as indicated by the words strain, lifting etc – and fewer simple bruises and lacerations. The Word Cloud feature painted a much clearer picture for the actuarial team at NTUC Income to determine claims frequency and severity - and how they could be changing over time. STEP 3: SELECT A TIME PERIOD In order to isolate the changes, the team needed to figure out when they happened, selecting a time period for their analysis. It’s important to balance stability and responsiveness i.e. that the time period they choose be long enough that the patterns are credible, but short enough that it’s still relevant and meaningful. It’s also important to allow for external trends that might have occurred during your selected time period, such as inflation. STEP 4: TECHNICAL EXPOSURE PRICING When information within NTUC’s data about changes in exposure, claims frequency, and severity was uncovered withDataRobot’s automated machine learning platform, the actuaries at NTUC could now start setting more accurate technical pricing, at cost-plus. Taking into account the insights revealed in the steps above, NTUC’s actuaries could get a better estimate of the risk premium, for both the overall average risk premium and the risk relativities for individuals, while allowing for trends like inflation. They are now able to identify exposures that are currently mispriced, relative to sound premiums. Understanding and predicting time-based trends allows the team to account for future inflation, and price accordingly. CASE STUDY | NTUC Income 5
- 6. v10242019.0657 STEP 5: COMMERCIAL PRICING The next and final step is to take the leap from technical pricing to commercial pricing; out in the real world, how can NTUC Income position themselves and their coverages against competitors for maximum margins? As mentioned earlier, insurance has become increasingly commodified, making accurate pricing vis-a-vis both consumers and competitors critical. Using DataRobot, actuaries can analyse a sample of competitor quotes and generalize out to see what competitors will price for different types of policies. Without DataRobot, getting that type of competitor information requires manually doing lots of quotes, a process that is both time-consuming and suspicion-arousing. But once actuaries, using predictive machine learning models, can figure out what competitors are charging and where they rank in the market, they can better balance profit margin vs. volume. They can find the sweet spot, a practical premium rate that customers will pay, without charging lower than they have to or risking anti-selection by charging too high. Conclusion Pricing analysis is hard! Without an Enterprise AI platform like DataRobot, the process of pricing analysis was complex, arduous, and required highly skilled data scientists for NTUC Income. But by combining human strengths – qualities such as communication, creativity, empathy and general knowledge and common sense – with DataRobot, actuaries become levelled up can tackle pricing analysis projects with ease. DataRobot not only automates and expedites many of the manual, repetitive tasks that actuaries have to undertake; the platform also helps with data manipulation and, most importantly, simplifying complexity. With tools such as Feature Impact, Feature Effects, Prediction Explanations, Word Cloud, the insights uncovered by DataRobot can be easily communicated to other business owners, allowing for corresponding actions and positive change to be enacted quickly. “The speed of the platform is its strength where it can generate results in less than an hour, instead of a few days” — Kwek Ee Ling NTUC Income Singapore Office Contact Us DataRobot 225 Franklin Street, 13th Floor Boston, MA 02110, USA www.datarobot.com info@datarobot.com © 2019 DataRobot, Inc. All rights reserved. DataRobot and the DataRobot logo are trademarks of DataRobot, Inc. All other marks are trademarks or registered trademarks of their respective holders. CASE STUDY | NTUC Income