1. CROSSTABS
/TABLES=Q2 BY RT1A RT1B RT1C
/FORMAT=AVALUE TABLES
/STATISTICS=CHISQ
/CELLS=COUNT
/COUNT ROUND CELL.
Crosstabs
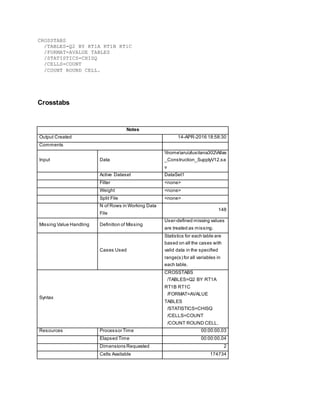
Notes
Output Created 14-APR-2016 18:58:30
Comments
Input Data
homearuizlusitana302Atlas
_Construction_SupplyV12.sa
v
Active Dataset DataSet1
Filter <none>
Weight <none>
Split File <none>
N of Rows in Working Data
File
148
Missing Value Handling Definition of Missing
User-defined missing values
are treated as missing.
Cases Used
Statistics for each table are
based on all the cases with
valid data in the specified
range(s) for all variables in
each table.
Syntax
CROSSTABS
/TABLES=Q2 BY RT1A
RT1B RT1C
/FORMAT=AVALUE
TABLES
/STATISTICS=CHISQ
/CELLS=COUNT
/COUNT ROUND CELL.
Resources Processor Time 00:00:00.03
Elapsed Time 00:00:00.04
Dimensions Requested 2
Cells Available 174734
2. [DataSet1] homearuizlusitana302Atlas_Construction_SupplyV12.sav
Case Processing Summary
Cases
Valid Missing Total
N Percent N Percent N Percent
Age * Does currentand
projected seniority
compromise Atlas’s abilityto
bid new projects at
competitive rates?
140 94.6% 8 5.4% 148 100.0%
Age * Will Atlas be
negatively impacted by a
flood of unexpected
retiring/resigning senior
personnel?
140 94.6% 8 5.4% 148 100.0%
Age * Is the aging workforce
having a negative effect on
the current working
environment?
140 94.6% 8 5.4% 148 100.0%
Age * Does current and projected seniority compromise Atlas’s ability to
bid new projects at competitive rates?
Crosstab
Count
Does current and projected seniority compromise Atlas’s ability to bid new projects at
competitive rates?
1.00 1.11 1.17 1.22 1.33 1.43 1.50
Age 18-30 0 0 0 0 3 0 0
31-45 2 1 1 0 1 0 0
46-60 1 0 1 1 3 1 3
61 or older 0 0 0 1 1 0 1
Total 3 1 2 2 8 1 4
Crosstab
Count
Does current and projected seniority compromise Atlas’s ability to bid new projects at
competitive rates?
3. 1.56 1.67 1.71 1.78 1.83 1.86 2.00
Age 18-30 0 1 0 0 1 0 1
31-45 0 3 0 1 2 1 2
46-60 1 1 1 1 1 1 1
61 or older 0 0 0 1 0 0 1
Total 1 5 1 3 4 2 5
Crosstab
Count
Does current and projected seniority compromise Atlas’s ability to bid new projects at
competitive rates?
2.11 2.14 2.17 2.22 2.29 2.33 2.43
Age 18-30 1 1 6 0 0 1 0
31-45 1 2 2 1 0 5 0
46-60 0 2 2 0 1 3 1
61 or older 1 1 1 0 0 0 0
Total 3 6 11 1 1 9 1
Crosstab
Count
Does current and projected seniority compromise Atlas’s ability to bid new projects at
competitive rates?
2.50 2.57 2.67 2.71 2.78 2.83 3.00
Age 18-30 0 0 3 1 0 0 1
31-45 1 0 2 2 1 2 2
46-60 3 1 1 1 0 3 3
61 or older 0 0 0 1 0 0 0
Total 4 1 6 5 1 5 6
Crosstab
Count
Does current and projected seniority compromise Atlas’s ability to bid new projects at
competitive rates?
3.14 3.17 3.29 3.33 3.38 3.50 3.67
Age 18-30 0 0 0 2 0 3 1
31-45 1 1 1 2 0 1 1
46-60 0 1 1 1 2 1 2
61 or older 0 0 0 1 0 0 0
Total 1 2 2 6 2 5 4
Crosstab
Count
Does current and projected seniority compromise Atlas’s ability to bid new projects at
competitive rates?
4. 3.71 3.83 4.00 4.17 4.29 4.33 5.00
Age 18-30 0 0 2 1 0 2 1
31-45 1 1 1 1 1 1 0
46-60 0 0 1 2 0 0 0
61 or older 0 1 0 0 0 0 0
Total 1 2 4 4 1 3 1
Crosstab
Count
Total
Age 18-30 32
31-45 48
46-60 49
61 or older 11
Total 140
Chi-Square Tests
Value df Asymp. Sig. (2-
sided)
Pearson Chi-Square 98.117a
123 .952
Likelihood Ratio 105.116 123 .876
Linear-by-Linear Association 4.949 1 .026
N of Valid Cases 140
a. 168 cells (100.0%) have expected countless than 5. The minimum
expected count is .08.
Age * Will Atlas be negatively impacted by a flood of unexpected
retiring/resigning senior personnel?
Crosstab
Count
Will Atlas be negatively impacted by a flood of unexpected retiring/resigning senior
personnel?
1.00 1.13 1.14 1.25 1.38 1.50 1.63
Age 18-30 1 1 0 2 1 0 1
31-45 0 0 1 3 3 2 2
5. 46-60 0 3 0 1 2 3 5
61 or older 2 0 0 1 0 0 1
Total 3 4 1 7 6 5 9
Crosstab
Count
Will Atlas be negatively impacted by a flood of unexpected retiring/resigning senior
personnel?
1.75 1.88 2.00 2.13 2.25 2.38 2.43
Age 18-30 1 1 1 2 1 4 0
31-45 0 2 0 4 2 7 1
46-60 1 2 4 2 3 2 0
61 or older 1 0 0 1 0 1 0
Total 3 5 5 9 6 14 1
Crosstab
Count
Will Atlas be negatively impacted by a flood of unexpected retiring/resigning senior
personnel?
2.50 2.63 2.75 2.88 3.00 3.13 3.25
Age 18-30 0 0 4 0 1 1 0
31-45 2 1 0 2 3 2 3
46-60 4 2 0 2 1 2 1
61 or older 1 0 1 0 0 1 0
Total 7 3 5 4 5 6 4
Crosstab
Count
Will Atlas be negatively impacted by a flood of unexpected retiring/resigning senior
personnel?
3.38 3.50 3.63 3.75 3.88 4.00 4.13
Age 18-30 1 1 0 3 2 0 2
31-45 0 1 1 1 1 2 1
46-60 0 1 2 0 2 2 0
61 or older 1 0 0 0 0 0 0
Total 2 3 3 4 5 4 3
Crosstab
Count
Will Atlas be negatively impacted by a flood of
unexpected retiring/resigning senior personnel?
Total
4.25 4.88 5.00
Age 18-30 0 0 1 32
31-45 0 1 0 48
6. 46-60 2 0 0 49
61 or older 0 0 0 11
Total 2 1 1 140
Chi-Square Tests
Value df Asymp. Sig. (2-
sided)
Pearson Chi-Square 98.782a
90 .247
Likelihood Ratio 105.034 90 .133
Linear-by-Linear Association 3.599 1 .058
N of Valid Cases 140
a. 124 cells (100.0%) have expected countless than 5. The minimum
expected count is .08.
Age * Is the aging workforce having a negative effect on the current
working environment?
Crosstab
Count
Is the aging workforce having a negative effect on the current working environment?
1.00 1.08 1.09 1.17 1.18 1.25 1.27
Age 18-30 0 0 0 0 0 0 1
31-45 1 0 0 0 1 1 0
46-60 0 1 1 1 0 0 2
61 or older 0 1 0 1 0 0 0
Total 1 2 1 2 1 1 3
Crosstab
Count
Is the aging workforce having a negative effect on the current working environment?
1.33 1.36 1.45 1.55 1.58 1.64 1.73
Age 18-30 0 1 2 0 0 0 0
31-45 0 0 2 1 1 1 3
46-60 1 1 1 1 0 1 3
61 or older 0 0 1 0 0 0 0
Total 1 2 6 2 1 2 6
7. Crosstab
Count
Is the aging workforce having a negative effect on the current working environment?
1.82 1.83 1.91 2.00 2.09 2.18 2.20
Age 18-30 1 0 3 0 0 2 0
31-45 0 1 1 0 3 2 1
46-60 0 1 1 1 2 3 0
61 or older 0 1 2 0 0 1 0
Total 1 3 7 1 5 8 1
Crosstab
Count
Is the aging workforce having a negative effect on the current working environment?
2.27 2.33 2.36 2.42 2.45 2.55 2.64
Age 18-30 1 1 1 0 1 1 0
31-45 1 1 4 1 1 0 2
46-60 0 0 3 1 3 1 0
61 or older 0 0 0 1 1 0 0
Total 2 2 8 3 6 2 2
Crosstab
Count
Is the aging workforce having a negative effect on the current working environment?
2.67 2.73 2.82 2.91 3.00 3.09 3.17
Age 18-30 0 2 1 1 1 1 0
31-45 1 0 0 1 2 2 1
46-60 0 2 3 2 1 0 0
61 or older 0 0 0 0 0 0 0
Total 1 4 4 4 4 3 1
Crosstab
Count
Is the aging workforce having a negative effect on the current working environment?
3.18 3.25 3.27 3.36 3.45 3.55 3.58
Age 18-30 1 0 0 1 0 1 0
31-45 0 1 1 1 2 0 0
46-60 1 0 1 0 1 0 2
61 or older 0 0 1 0 0 0 0
Total 2 1 3 2 3 1 2
Crosstab
Count
Is the aging workforce having a negative effect on the current working environment?
3.64 3.73 3.75 3.82 3.91 4.00 4.18
8. Age 18-30 1 1 0 1 2 1 0
31-45 1 1 0 1 1 1 1
46-60 1 0 1 0 0 1 0
61 or older 0 0 0 0 0 1 0
Total 3 2 1 2 3 4 1
Crosstab
Count
Is the aging workforce having a negative effect on the current working
environment?
Total
4.27 4.36 4.45 4.55 5.00
Age 18-30 0 1 0 0 1 32
31-45 0 0 0 1 0 48
46-60 1 2 1 0 0 49
61 or older 0 0 0 0 0 11
Total 1 3 1 1 1 140
Chi-Square Tests
Value df Asymp. Sig. (2-
sided)
Pearson Chi-Square 123.755a
159 .982
Likelihood Ratio 139.047 159 .871
Linear-by-Linear Association 3.659 1 .056
N of Valid Cases 140
a. 216 cells (100.0%) have expected countless than 5. The minimum
expected count is .08.
CROSSTABS
/TABLES=Q2 BY RT1D RT1E
/FORMAT=AVALUE TABLES
/STATISTICS=CHISQ
/CELLS=COUNT
/COUNT ROUND CELL.
Crosstabs
Notes
Output Created 14-APR-2016 18:58:57
9. Comments
Input Data
homearuizlusitana302Atlas
_Construction_SupplyV12.sa
v
Active Dataset DataSet1
Filter <none>
Weight <none>
Split File <none>
N of Rows in Working Data
File
148
Missing Value Handling Definition of Missing
User-defined missing values
are treated as missing.
Cases Used
Statistics for each table are
based on all the cases with
valid data in the specified
range(s) for all variables in
each table.
Syntax
CROSSTABS
/TABLES=Q2 BY RT1D
RT1E
/FORMAT=AVALUE
TABLES
/STATISTICS=CHISQ
/CELLS=COUNT
/COUNT ROUND CELL.
Resources Processor Time 00:00:00.03
Elapsed Time 00:00:00.18
Dimensions Requested 2
Cells Available 174734
[DataSet1] homearuizlusitana302Atlas_Construction_SupplyV12.sav
Case Processing Summary
Cases
Valid Missing Total
N Percent N Percent N Percent
Age * Is Atlas prepared to
effectively and efficiently
engineer a workplace
transition plan?
140 94.6% 8 5.4% 148 100.0%
Age * Is the sales force at
Atlas properly trained and
50 33.8% 98 66.2% 148 100.0%
10. effectively using company
resources to make sales?
Age * Is Atlas prepared to effectively and efficiently engineer a workplace
transition plan?
Crosstab
Count
Is Atlas prepared to effectively and efficiently engineer a workplace transition plan?
1.00 1.13 1.22 1.25 1.33 1.38 1.44
Age 18-30 1 1 0 2 0 1 0
31-45 0 1 1 2 2 1 0
46-60 0 3 1 0 0 2 1
61 or older 2 0 0 1 0 0 0
Total 3 5 2 5 2 4 1
Crosstab
Count
Is Atlas prepared to effectively and efficiently engineer a workplace transition plan?
1.50 1.56 1.63 1.67 1.75 1.78 1.88
Age 18-30 0 0 1 0 1 0 1
31-45 2 0 2 0 0 0 1
46-60 1 1 3 2 1 1 1
61 or older 0 1 0 0 1 0 0
Total 3 2 6 2 3 1 3
Crosstab
Count
Is Atlas prepared to effectively and efficiently engineer a workplace transition plan?
1.89 2.00 2.11 2.13 2.22 2.25 2.38
Age 18-30 0 1 0 2 1 1 3
31-45 1 1 2 2 1 1 7
46-60 0 5 0 1 1 2 2
61 or older 0 0 1 0 1 0 0
Total 1 7 3 5 4 4 12
Crosstab
Count
Is Atlas prepared to effectively and efficiently engineer a workplace transition plan?
2.44 2.50 2.56 2.63 2.67 2.75 2.78
11. Age 18-30 0 0 0 0 1 3 0
31-45 1 2 0 0 0 0 1
46-60 3 1 1 1 0 0 1
61 or older 1 0 0 0 1 0 0
Total 5 3 1 1 2 3 2
Crosstab
Count
Is Atlas prepared to effectively and efficiently engineer a workplace transition plan?
2.88 2.89 3.00 3.11 3.13 3.25 3.33
Age 18-30 0 1 0 0 1 0 0
31-45 2 1 2 0 1 3 1
46-60 1 0 1 0 2 1 0
61 or older 0 0 0 1 1 0 0
Total 3 2 3 1 5 4 1
Crosstab
Count
Is Atlas prepared to effectively and efficiently engineer a workplace transition plan?
3.38 3.50 3.56 3.63 3.67 3.75 3.78
Age 18-30 1 1 0 0 0 3 0
31-45 0 0 1 1 0 0 2
46-60 0 1 1 2 1 0 0
61 or older 0 0 0 0 0 0 0
Total 1 2 2 3 1 3 2
Crosstab
Count
Is Atlas prepared to effectively and efficiently engineer a workplace transition plan?
3.88 3.89 4.00 4.13 4.25 4.56 5.00
Age 18-30 2 0 0 2 0 0 1
31-45 1 0 0 1 0 1 0
46-60 1 1 1 0 1 0 0
61 or older 0 0 0 0 0 0 0
Total 4 1 1 3 1 1 1
Crosstab
Count
Total
Age 18-30 32
31-45 48
46-60 49
61 or older 11
12. Total 140
Chi-Square Tests
Value df Asymp. Sig. (2-
sided)
Pearson Chi-Square 154.998a
144 .251
Likelihood Ratio 152.637 144 .295
Linear-by-Linear Association 4.274 1 .039
N of Valid Cases 140
a. 196 cells (100.0%) have expected countless than 5. The minimum
expected count is .08.
Age * Is the sales force at Atlas properly trained and effectively using
company resources to make sales?
Crosstab
Count
Is the sales force at Atlas properly trained and effectively using company resources to
make sales?
1.00 1.10 1.50 1.90 2.00 2.20 2.30
Age 18-30 0 0 0 0 2 0 0
31-45 0 2 1 0 10 1 1
46-60 1 1 1 1 10 0 0
61 or older 0 0 1 1 3 0 1
Total 1 3 3 2 25 1 2
Crosstab
Count
Is the sales force at Atlas properly trained and effectively using company resources to
make sales?
2.40 2.70 3.00 3.10 3.20 3.22 3.25
Age 18-30 0 0 0 1 0 0 0
31-45 1 1 0 1 1 0 0
46-60 0 0 1 0 0 1 1
61 or older 1 0 0 0 1 0 0
Total 2 1 1 2 2 1 1
13. Crosstab
Count
Is the sales force at Atlas properly trained and effectively
using company resources to make sales?
Total
3.30 4.10 5.00
Age 18-30 0 0 1 4
31-45 0 0 0 19
46-60 1 1 0 19
61 or older 0 0 0 8
Total 1 1 1 50
Chi-Square Tests
Value df Asymp. Sig. (2-
sided)
Pearson Chi-Square 42.408a
48 .700
Likelihood Ratio 39.314 48 .810
Linear-by-Linear Association .882 1 .348
N of Valid Cases 50
a. 66 cells (97.1%) have expected count less than 5. The minimum
expected count is .08.
![[DataSet1] homearuizlusitana302Atlas_Construction_SupplyV12.sav
Case Processing Summary
Cases
Valid Missing Total
N Percent N Percent N Percent
Age * Does currentand
projected seniority
compromise Atlas’s abilityto
bid new projects at
competitive rates?
140 94.6% 8 5.4% 148 100.0%
Age * Will Atlas be
negatively impacted by a
flood of unexpected
retiring/resigning senior
personnel?
140 94.6% 8 5.4% 148 100.0%
Age * Is the aging workforce
having a negative effect on
the current working
environment?
140 94.6% 8 5.4% 148 100.0%
Age * Does current and projected seniority compromise Atlas’s ability to
bid new projects at competitive rates?
Crosstab
Count
Does current and projected seniority compromise Atlas’s ability to bid new projects at
competitive rates?
1.00 1.11 1.17 1.22 1.33 1.43 1.50
Age 18-30 0 0 0 0 3 0 0
31-45 2 1 1 0 1 0 0
46-60 1 0 1 1 3 1 3
61 or older 0 0 0 1 1 0 1
Total 3 1 2 2 8 1 4
Crosstab
Count
Does current and projected seniority compromise Atlas’s ability to bid new projects at
competitive rates?](data:image/gif;base64,R0lGODlhAQABAIAAAAAAAP///yH5BAEAAAAALAAAAAABAAEAAAIBRAA7)