Electrical resistivity sounding for subsurface delineation and evaluation of groundwater potential of araromi akungba akoko ondo state southwestern nigeria
•
3 likes•3,238 views

International Journals Call for Paper: http://www.iiste.org/Journals

Recommended
Recommended
More Related Content
What's hot
What's hot (19)
Similar to Electrical resistivity sounding for subsurface delineation and evaluation of groundwater potential of araromi akungba akoko ondo state southwestern nigeria
Similar to Electrical resistivity sounding for subsurface delineation and evaluation of groundwater potential of araromi akungba akoko ondo state southwestern nigeria (20)
More from Alexander Decker
More from Alexander Decker (20)
Recently uploaded
Recently uploaded (20)
Electrical resistivity sounding for subsurface delineation and evaluation of groundwater potential of araromi akungba akoko ondo state southwestern nigeria
- 1. Journal of Environment and Earth Science www.iiste.org ISSN 2224-3216 (Paper) ISSN 2225-0948 (Online) 0948 Vol 2, No.7, 2012 Electrical Resistivity Sounding for Subsurface Delineation and al Evaluation of Groundwater Potential of Araromi Akungba Akungba-Akoko Ondo State Southwestern Nigeria Muraina Z. Mohammed1* Thompson H. T. Ogunribido2 & Adedamola T. Funmilayo3 1, 2, 3 Department of Geology & Applied Geophysics, Adekunle Ajasin University, Akungba Akoko PMB 001, Akungba Akungba-Akoko, Ondo state. Nigeria. * E-mail of the correspondence author: drmmohammed@yahoo.com mail Abstract Electrical resistivity sounding of Araromi area of Akungba Akoko was conducted with a view to de delineating the subsurface units and evaluating the groundwater potential of the area. Forty (40) Schlumberger vertical electrical resistivity soundings were acquired with ABEM SAS 1000 Resistivity Meter. The electrode spacing (AB/2) was electrode varied from 1 – 65 m with maximum spread length of 130 m. The interpretation of the data was quantitative, and involved partial curve matching and computer iteration technique using WinResist software. Three to four distinct subsurface geologic layers were identified from the geoelectric layers, aided by borehole face lithological logs. These included a lateritic clay/sandy clay/clayey sand/sandy topsoil, clayey weathered layer, partially weathered/fractured basement and the fresh basement with resistivity and thickness values of 3 basement 3-174 ohm-m and 0.7-1.5 m; 196-472 ohm and 3.9-20.1 m; 533-742 ohm-m and 1.8-4.2 m; and infinity ohm 472 ohm-m 4.2 ohm-m respectively.. The depth to bedrock varied from 0 to 20.1 m. The bedrock relief was generally uneven, with . bedrock elevations that varied between 312 and 346 m above sea level. The bedrock relief map delineated two major parallel basement depressions striking approximately NW NW-SE as the major groundwater collecting centers centers. The isopach map of the overburden show generally thin overburden (< 15 m). The weathered/fractured layer showed constituted the dominant aquifer units with tendency for low groundwater potential rating arising from the clayey and thin nature of the overburden. Future groundwater resource development in the study area is considered development feasible in few places characterized by relatively thick and sandy column of the overburden units. Keywords: Schlumberger, Sounding, Electrode, Resistivity, Thickness, Groundwater, Rating 1. Introduction The availability of safe and potable water in an environment is a veritable index of a tremendous role to the development and growth of a community. Araromi area of Akungba Akoko is a new settlement notably for staff and students of Adekunle Ajasin University in Akungba town. It is bounded in the east and south by neighboring town. towns of Iwaro- Oka and Etioro - Supare Akoko respectively, and it is situated southeast of Akungba town between Ikare and Owo towns in the northern part of Ondo state southwestern Nigeria. Araromi-Akungba community has witnessed an exponential increase in population of various groups of ungba people in recent times. The inhabitants range from students to civil workers and artisans/local traders that migrated to earn livings with the relocation of a state university to Akungba Akoko few years ago. This university development heralded an increased local economy of the community as well as impacted heavy demands on potable water for domestic uses. Inhabitants depend primarily on shallow water wells/handwells/hand-dug wells and surface water resources which usually run dry during the dry season. During this period, limited amount of ace potable water for consumption is usually sourced from water vendors and few boreholes sunk by the state government and few individuals. These provisions are grossly inadequate as further efforts by group of individuals and governmental agencies are not meeting expectations as two out of three boreholes sunk for water supplies usually fail as soon as works are completed on them. At present, groundwater via shallow hand dug wells and few borehole constructions constitutes a major source of drinking water supply in this area. The yields are somewhat variable and less than expected average considered enough for the overall populace. In order to ease the problem of water scarcity and improve the problem living standard of the community this study was initiated to delineate the subsurface geological sequences and their hydrogeological characteristics/groundwater potentials in the light of the notably sustainable groundw groundwater yield of typical basement terrains. Generally, surface water accumulates after precipitation under the influence of gravity in rock cavities as a vast groundwater reservoir supplying wells, boreholes, springs and flowing streams (Harr 1962). In a typical Precambrian Basement Complex area this groundwater reservoir is usually contained cal area, within the weathered and the tectonically induced geological features; fractured/fissured, sheared or jointed/faulted basement columns of the rock unit(s). These geological processes alter the rock units to reduce resistivity at depth cal of burial and hence increase the porosity and permeability of such units for groundwater accumulation, discharge 29
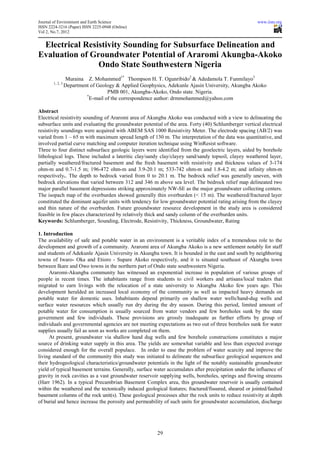
- 2. Journal of Environment and Earth Science www.iiste.org ISSN 2224-3216 (Paper) ISSN 2225-0948 (Online) 0948 Vol 2, No.7, 2012 and exploitation. This, therefore, constitutes the basis of the choice of geoelectrical resistivity sounding survey in geoelectrical this present study. The method has been successfully employed in the delineation of subsurface geological sequence, geological structures/features of interest, aquifer units, types and depth extent in almost all g geological terrains. This is because of the significant resistivity contrasts that exist between different earth materials ( Olorunfemi & Fasuyi 1993). The resistivity method can therefore map interface along which a resistivity contrast exists. This . interface may or may not coincide with geological boundary (Telford et al. 1990). The electrical resistivity ace survey / method works on the basis of energizing the subsurface via the use of two current electrodes with the resulting potential difference measured by another two electrodes termed the potential electrodes. 2. Site Description 2.1 Site Location and Physiography The study area is located in Araromi Akungba-Akoko, Ondo State, Southwestern, Nigeria (Figure 1). It is Araromi- Akoko, confined within latitudes 70 27’ 5.82” and 70 27’ 41.63” and longitudes 50 43’ 41.43” and 50 44’ 29.43” which approximate To AAUA Campus 825600 825400 To Supare Akoko 825200 825000 ATIARO QTRS To Iwaro-Oka 824800 V.C. Lodge Abuja 824600 From Akure 801200 801400 801600 801800 802000 802200 802400 802600 LEGEND 0m 500m Major Roads Block Industry Minor Roads Garage Church Filling Station Building Outcrop 4 30'E 5 00'E 5 30'E 6 00'E Akoko KOGI STATE N/W EKITI STATE Ikare 7 30'N Oka Isua Akoko 7 30'N Ifedore Iju/ Akoko Itaogbolu S/W Ile-Oluji/ OSUN STATE Oke-Igbo Akure North Owo Ondo East 7 00' Ondo West Idanre 7 00' OGUN STATE Odigbo/Ose Okitipupa Irele 6 30' 6 30' Igbokoda/ Ilaje LEGEND Ese Odo State Boundary Regional Boundary Study Area 6 00'N ATLANTIC 6 00'N OCEAN SCALE - 1:400, 000 DELTA STATE 4 30'E 5 00'E 5 30'E 6 00'E Figure 1. Map of Ondo State showing the Study Area and the Layout 30
- 3. Journal of Environment and Earth Science www.iiste.org ISSN 2224-3216 (Paper) ISSN 2225-0948 (Online) 0948 Vol 2, No.7, 2012 northings and eastings of 825739 mN and 802713 mN and 801047 mE and 824429 mE of the Universal Traverse Mercator (UTM) Minna Zone 31 coordinates respectively. It covers an areal extent of about 1.5 km sq. a The study area is characterized by relatively gentle undulating terrain with elevations of between 326 and 350 mm. Bordering the site in the far north and south ends are hills and inselbergs. The features create a b hills broad valley for the infrastructural development on the land expanse of the area. The hills trend between 0900 and 1250. The mean annual rainfall is about 1300 mm and mean temperature of 270C (Duze & Ojo 19 1982). The vegetation is characterized by wooden shrubs, palms, moist deciduous trees and herbaceous plants. The site is usually with dense vegetation in the rainy season and sparse in the dry season. However, human interference has reduced the vegetation. The area is generally drained by river Alatan. s 2.2 Geology and Hydrogeology The survey area is underlain by the Precambrian Basement Complex rock of southwestern Nigeria The basement Nigeria. rock exposures are however found as lowland outcrop in few places within the survey area particularly where basement is shallow and erosional activities are active. However, according to Rahaman (1976 & 1988 a), the area is underlain by Migmatite - gneiss-quartzite Complex with the granite gneiss and grey gneiss being the major units quartzite while the minor units include Mafic, granodiorite, pegmatite, garnet sillimanite gneiss and quartzite (Fig garnet-sillimanite (Figure 2). The area is sandwiched between two parallel prominent E W ridges/inselbergs of granite gneiss composition found at the E-W north and south ends. The features create a broad vall for groundwater resource development Generally, in a valley development. typical basement complex area, groundwater is usually contained in the weathered column and fractured/ column fractured/fissured, sheared or jointed/faulted basement columns. These geological processes alter rock units to reduce resistivity and hence increase the porosity and permeability of such units for groundwater accumulation. The study area is units covered with variety of lateritic soil 50 44' 5045' E 7028'N 7027' LEGEND Migmatite Major Roads Granite Minor Roads Gneiss Geological (Rock) Boundary Granite Gneiss Figure 2. Geological Map of Akungba Akoko (modified after Farotimi, 2002). Akungba-Akoko being a product of in situ weathered of the parent rocks. These weathered zones typically have been the source of groundwater in hand dug wells. The static water level of wells and few boreholes in the area range between 1.5 boreholes to 8.0 m. 31
- 4. Journal of Environment and Earth Science www.iiste.org ISSN 2224-3216 (Paper) ISSN 2225-0948 (Online) 0948 Vol 2, No.7, 2012 3. Methods of Study 3.1 Field Survey/Data Acquisition Technique Forty (40) Schlumberger vertical electrical resistivity soundings were acquired at selected stations not more than 75 m station – station interval particularly along and/ or few meters away from major / minor roads / footpaths al and built – ups (Figure 3). The electrode spacing (AB/2) was varied from 1 – 65 m with maximum spread length of 130 m. The ABEM SAS 1000 Resistivity Meter was used for the measurement of the ground resistance. The measurement ground apparent resistivity measured is a function of electrode spacing, geometry of electrode array, subsurface layer thickness, angle of dip and anisotropic properties (Ako, 1979). The product of the measured grou ground resistance (R) value and the geometric factor (G) of the electrode array for each set up gave the ground apparent resistivity values. To AAUA Campus 825600 A V30 V39 825400 To Supare Akoko C V18 K V31 V40 V17 V14 V38 E V16 V1 V32 V19 V12 825200 V15 V13 V11 V2 D V37 V33 V34 V20 M V3 V36 V35 F B 825000 ATIARO QTRS G V4 V21 To Iwaro-Oka V24 V10 I V5 V22 V25 824800 V29 V23 V9 V26 V6 J V7 V.C. Lodge V27 V28 L V8 824600 H From Akure 801200 801400 801600 801800 802000 802200 802400 802600 LEGEND 0m 500m Major Roads Block Industry Minor Roads Garage Church Filling Station Building Outcrop VES Stations Study Area Figure 3 Data Acquisition Map of the Study Area. 3. 3.2 Data Processing/Analysis The data obtained from each station were plotted on transparent bi-logarithms graph paper to obtain a smooth logarithms curve for subsequent interpretation by manual partial curve matching. The partial curve matching technique involved the matching of successive segments of the field curve by a set of two-layer theoretical Schlumberger layer curves (Orellana and Mooney, 1966) and the corresponding auxiliary curves. The geoelectric parameters obtained from the partial curve matching were refined by computer iteration technique using WinRESIST software ( (Vander Velpen, 1988). The interpretation by forward and inverse modeling techniques was an interactive ion computer-graphic display system (Ghosh, 1974; Sharma, 2000). The system made use of a fast computer to graphic calculate an apparent resistivity curve for a given layer sequence. From the above, the refinement of the results of the partial curve matching interpretation was obtained and found satisfactory with the root square mean (rsm) of less than 10 % . 32
- 5. Journal of Environment and Earth Science www.iiste.org ISSN 2224-3216 (Paper) ISSN 2225-0948 (Online) 0948 Vol 2, No.7, 2012 4. Results and Discussion 4.1 Results Presentation The results of the data obtained from the field are presented as tables, depth sounding curves, geo geo-electric sections and maps. However, the qualitative interpretation applied to the quantitative interpretation results of the depth sounding curves enabled the classification of the VES data into curve types. The classification ranged from classification simple two electrical layers to four layer curves arising from the layer resistivity combinations. layered 4.2 Field Curves and Geoelectric Sections The field curves obtained within the study area are the H (6), A (16), HA (8), AA (1) and KH (7) types with the study A-type being the dominant. The typical VES c . curve types are shown in Figures 4 (a & b). Seven geoelectric sections were drawn in the NW NW-SE and approximately SW-NE directions within the study area. NE The sections generally delineate three to four major geoelectric/subsurface geologic layers which include; the topsoil, the weathered layer, fractured basement and the fresh bedrock (Fig red (Figures 5 a – g). The resistivity of the first layer ranges from 38 - 3533 Ωm with thickness of 0 - 3.7 m. The topsoil is composed of clay, sandy clay and laterites. The resistivity of the underlying weathered layer ranges from 32 - 632 Ωm with thickness values that vary between 0 and 8.5 m. It is composed of clay, sandy clay and sand. The weathered layer is underlain by the fractured basement in few places. The resistivity of the fractured zones varies between 432 and 90 Ωm and 907 the thickness ranges from 4.2-10.7 m. The basal unit is the fresh bedrock with resistivity that varies from 1050 to 10.7 infinity ohm-m and the depth to the bedrock ranges from 0 to 14.1 m. The geoelectric sections show that the overburden is generally thin. The overburden/weathered basement is absent in places particularly beneath VES station 39 and beneath VES stations 16, 25, 26 and 28 where basement rock outcropped/thin overburden respectively. The generally thin nature of the overburden of less than 10 m in most places make the area less than hydrogeologically appeal except where exist a significantly saturated thickness column of greater than 10 m in ally the area. . Figure 4 a: Typical HA Curve Type. Figure 4 b: Typical KH Curve Type. 33
- 6. Journal of Environment and Earth Science www.iiste.org ISSN 2224-3216 (Paper) ISSN 2225-0948 (Online) 0948 Vol 2, No.7, 2012 A V30 V39 V31 V32 V33 V34 V35 B 220 213 91 163 63 271 430 730 0 32 38 159 127 254 5 133 Depth (m) 10 15 20 LEGEND Figure 5 a: A NW-SE Geoelectric Section obtained along Line A B (Resistivity values in Ωm). SE A-B C V18 V17 V14 V12 V11 D 124 222 91 182 219 101 59 413 0 205 70 94 432 527 696 Depth (m) 10 4145 20 6488 33598 30 Figure 5 b: A NW-SE Geoelectric Section obtained along Line C D (Resistivity values in Ωm). SE C-D E V16 V15 V13 V3 F 123 302 312 207 479 0 110 51 75 10419 86 ) 5 942 Depth (m 10 13115 15 20 Figure 5 c: A NW-SE Geoelectric Section obtained along Line E (Resistivity values in Ωm) SE E-F ues G V21 V24 V25 V26 V28 V8 H 93 124 322 626 0 129 375 4869 287 352 5487 1224 487 Depth (m) 5 10 2677 8257 10347 15 20 Figure 5 d: A NW-SE Geoelectric Section obtained along Line G H (Resistivity values in Ωm) SE G-H I V22 V21 V20 V19 V18 C 98 93 79 67 124 270 101 0 383 375 95 432 Depth (m) 10 2677 1413 20 6488 30 Figure 5 e: A SW-NE Geoelectric Section obtained along Line I C (Resistivity values in Ωm). NE I-C J V26 V29 V4 V3 V1 V31 K 237 125 312 106 91 479 75 0 287 57 298 252 159 5 5487 2294 Depth (m) 5787 10 13115 15 1528 20 Figure 5 f: A SW-NE Geoelectric Section obtained along Line J K (Resistivity values in Ωm) NE J-K 34
- 7. Journal of Environment and Earth Science www.iiste.org ISSN 2224-3216 (Paper) ISSN 2225-0948 (Online) 0948 Vol 2, No.7, 2012 L V28 V7 V6 V9 V36 M 322 725 179 206 134 127 0 352 257 907 116 5 Depth (m) 1224 10 2980 1702 15 8257 20 LEGEND 100m 0 Topsoil Weathered Layer 10m Fractured Basement Fresh Basement Figure 5 g: A SW-NE Geoelectric Section obtained along Line L M (Resistivity values in Ωm). NE L-M 4.3 Geo-electrical Maps The isoresistivity map of the topsoil in Araro area of Akungba-Akoko is shown in (Figure 6 a). The map Araromi Akoko shows the variation in the resistivity of the topsoil within the study area. The topsoil resistivity varies from 38 to greater than 1000 ohm-m typical of hard m hard-pan laterite and/or bedrock. The resistivity is generally high (>1000 tivity ohm-m) at VES 23 stations and 39 nearest to an outcrop. The resistivity is moderately high (between 300 and m) 1000 ohm-m) in the eastern part of the area particularly at the extreme north east and south m) north-east south-east. The resistivity of the topsoil is generally low with resistivity that is less than 300 ohm-m in the western, central and f northeastern portions of the area. The map in Figure (6 b) shows the variation in the thickness of the topsoil within the study area. It shows that the thickness of the topsoil varies from 0 to 3.8 m. This generally indicates that the topsoil in the area rarely goes beyond 1 m thickness except in the western portion and in the extreme north (beneath VES station 30), including VES stations 2 and 9 where the thickness values go beyond 1.6 m. e This thin nature of the topsoil is a reflection of basement highs in most places thus hinders handhand-dug wells and hydrogeologically unappealed. The isoresistivity map of the weathered layer is shown in Figure 6 c. The map shows the distribution in the resistivity of the weathered layer within the study area. The resistivity varies from 32 to greater than 1000 d ohm-m. The region which shows resistivity values greater than 700 ohm m is observed in the north (beneath m. ohm-m VES station 39) and southwest (beneath VES station 23). No weathered layer was encountered in these areas but the fresh basement. The resistivity of the wweathered layer is generally less than 200 ohm- and it is observed in -m the central portion of the study area while the resistivity is moderately high (200-700 ohm ral 700 ohm-m) in the north and southern portions of the area. The low resistivity may be indicative of a clayey matrix while the moderately high resistivity may be indicative of a sandy nature of the column. Figure 6 d shows the distribution in the thickness of the weathered layer within the study area. The thickness varies from 0 to 8.5 m. The isopach map shows that the weathered layer is generally thin and averagely (< 4 m) and absent in some places especially b beneath VES stations 23 and 39. Nevertheless, it shows pockets of fairly thick weathered layer (> 7 m) especially beneath fairly VES stations 3, 8, 38, etc. The distribution of the overburden thickness within the study area is generally shown in (Figure 6 e). Appreciable overburden thickness zones are possible groundwater collecting zones. Hence, unconsolidated reciable materials could contain reliable aquifer if thick and sandy. (Satpathy and Kanungo, 1976; Olorunfemi and Olorunniwo, 1985; Dan Hassan and Olorunfemi, 1999; Bala and Ike, 2001; Mohammed and Olorunfemi, 2007; Ojo et al., 2007). Also related geophysical studies in a typical basement terrain identified thick overburden as ). zone of high groundwater potential (Olorunfemi and Okhue, 1992; Bala and Ike, 2001; Mohamm et al., 2012). Mohammed The map shows overburden thickness with values that vary from 0 - 14.1 m. A relatively uniform thickness is observed throughout the study area with overburden that is very thin and rarely greater than 10 m in most places. The overburden is relatively fair in thickness (10 14 m) in the northwestern and southeastern portions in the s (10-14 vicinity of VES stations 14, 18 and 37. These zones are suggestive of possible groundwater potential zones in the area. Figure 6 f shows the variation in the bedrock topography of the study area. Previous geoelec bedrock geoelectrical studies have identified hydrogeological significance of bedrock depressions (Satpathy & Kanungo, 1976,.Olorunfemi (Satpathy and Okhue, 1992; Dan Hassan and Olorunfemi, 1999; Bala and Ike, 2001 Mohammed, 2007 Oladapo and 2001; 2007; Akintorinwa, 2007; Omosuyi., 2010) as groundwater collecting centers and are usually characterized by thick 2010) overburden. Conversely, 35
- 8. Journal of Environment and Earth Science www.iiste.org ISSN 2224-3216 (Paper) ISSN 2225-0948 (Online) 0948 Vol 2, No.7, 2012 To AAUA Campus 825600 V30 V39 825400 To Supare Akoko V18 V31 V40 V17 V38 V14 V1 V32 V19 V16 V12 825200 V15 V13 V11 V2 V37 V33 V34 V20 V3 V36 V35 825000 ATIARO QTRS V4 V21 To Iwaro-Oka V24 V10 V5 V22 V25 824800 V29 V23 V9 V26 V6 V7 V.C. Lodge V27 V28 V8 824600 From Akure 801200 801400 801600 801800 802000 802200 802400 802600 (a) To AAUA Campus 825600 V30 V39 825400 To Supare Akoko V18 V31 V40 V17 V38 V14 V1 V32 V19 V16 V12 825200 V15 V13 V11 V2 V37 V33 V34 V20 V3 V36 V35 825000 ATIARO QTRS V4 To Iwaro-Oka V21 V24 V10 V5 V22 V25 824800 V29 V23 V9 V26 V6 V7 V.C. Lodge V27 V28 V8 824600 From Akure 801200 801400 801600 801800 802000 802200 802400 802600 LEGEND 0m 500m Major Roads Block Industry Minor Roads Garage Church Filling Station Building Outcrop VES Stations Study Area (b) Figure 6. (a) Isoresis Isoresistivity Map, (b) Isopach Map of the Topsoil of the Study Area 36
- 9. Journal of Environment and Earth Science www.iiste.org ISSN 2224-3216 (Paper) ISSN 2225-0948 (Online) 0948 Vol 2, No.7, 2012 To AAUA Campus 825600 V30 V39 825400 To Supare Akoko V18 V31 V40 V17 V38 V14 V1 V32 V19 V16 V12 825200 V15 V13 V11 V2 V37 V33 V34 V20 V3 V36 V35 825000 ATIARO QTRS V4 V21 To Iwaro-Oka V24 V10 V5 V22 V25 824800 V29 V23 V9 V26 V6 V7 V.C. Lodge V27 V28 V8 824600 From Akure 801200 801400 801600 801800 802000 802200 802400 802600 (c) To AAUA Campus 825600 V30 V39 825400 To Supare Akoko V18 V31 V40 V17 V38 V14 V1 V32 V19 V16 V12 825200 V15 V13 V11 V2 V37 V33 V34 V20 V3 V36 V35 825000 ATIARO QTRS V4 V21 To Iwaro-Oka V24 V10 V5 V22 V25 824800 V29 V23 V9 V26 V6 V7 V.C. Lodge V27 V28 V8 824600 From Akure 801200 801400 801600 801800 802000 802200 802400 802600 LEGEND 0m 500m Major Roads Block Industry Minor Roads Garage Church Filling Station Building Outcrop VES Stations Study Area (d) Figure 6. (c) Isoresistivity Map (d) Isopach Map of the Weathered Layer of the Study Area Map, 37
- 10. Journal of Environment and Earth Science www.iiste.org ISSN 2224-3216 (Paper) ISSN 2225-0948 (Online) 0948 Vol 2, No.7, 2012 To AAUA Campus 825600 V30 V39 825400 To Supare Akoko V18 V31 V40 V17 V38 V14 V1 V32 V19 V16 V12 825200 V15 V13 V11 V2 V37 V33 V34 V20 V3 V36 V35 825000 ATIARO QTRS V4 To Iwaro-Oka V21 V24 V10 V5 V22 V25 824800 V29 V23 V9 V26 V6 V7 V.C. Lodge V27 V28 V8 824600 From Akure 801200 801400 801600 801800 802000 802200 802400 802600 (e) To AAUA Campus 825600 V30 V39 825400 To Supare Akoko V18 V31 V40 V17 V38 V14 V1 V32 V19 V16 V12 825200 V15 V13 V11 V2 V37 V33 V34 V20 V3 V36 V35 825000 ATIARO QTRS V4 To Iwaro-Oka V21 V24 V10 V5 V22 V25 824800 V29 V23 V9 V26 V6 V7 V.C. Lodge V27 V28 V8 824600 From Akure 801200 801400 801600 801800 802000 802200 802400 802600 LEGEND 0m 500m Major Roads Block Industry Minor Roads Garage Church Filling Station Building Outcrop VES Stations Study Area (f) Figure 6. (e) Overburden Thickness Map, (f) Bedrock Relief Map of the Study Area 38
- 11. Journal of Environment and Earth Science www.iiste.org ISSN 2224-3216 (Paper) ISSN 2225-0948 (Online) 0948 Vol 2, No.7, 2012 ridges are usually associated with thin overburden cover and are groundwater diverting centers. These two water characteristic features are observed in (Figure 6 f). The zone with a relatively low relief is indicative of a depression. The depression found sandwiched betwe two highs/bedrock ridges run parallel and trends between runs approximately NW-SE direction of the study area where contours are closed. Hence, the lone major depression SE . serves as groundwater collecting centre in this area and is suggestive of a major NW SE suspected regional fault NW-SE in-filled with weathering products. This result correlates with that obtained from the overburden thickness map filled map. 5. Conclusions Three to four geoelectric layers were delineated within the study area. These include; the topsoil, the weathered layer, partially weathered/fractured basement and the fresh basement rock. The resistivity of the topsoil reveals that its composition varies from clay to laterite. Maps generated using the obtained geoelectrical parameters revealed the variation of the different layer resistivity and thicknesses within the area. The study revealed that there exists a variable potential for groundwater development in the area. This is because of the variable l area. thickness of saprolite/weathered/fractured columns within a short distance. The weath he weathered/ partially weathered/fractured column is generally thin across the area except for the fairly thick columns as pockets of d sandy materials found scattered the study area particularly towards the northwestern part The part. weathered/fractured layer constituted the dominant aquifer units with tendency for low groundwater potential with rating arising from the clayey and thin nature of the overburden. Future groundwater resource development in the study area is considered feasible in few places characterized by relatively thick and sandy column of the overburden units. Hence, the groundwater potential of the study area is generally of a low level rating, at the roundwater s very best. References Ako, B. D. (1979). Geophysical prospecting for groundwater in parts of Southwestern Nigeria. Unpublished Ph.D Thesis. O.A.U, Ife. Pp. 70 s. 70-100. Bala, A. E. and Ike, E. C. (2001 . “The Aquifer of the Crystalline Basement Rocks in Gusau Area, 2001). North-Western Nigeria”. Journal of Mining and Geology 37(2): 177 – 184. Geology. Dan Hassan, M. A. and Olorunfemi, M. O. (1999). Hydrogeophysical Investigation of a Basement Terrain in the North central part of Kaduna State, Nigeria. Journal of Mining and Geology, Vol. 35 (2), pp. 189 189-206. Duze, M. and Ojo, A. (1982). Senior School Atlas Macmillan. Pp. 113. . Farotimi, A. (2002). Geological Map of Akungba Akoko town. ological Ghosh, D. P. (1971). The application of linear filter theory to the direct interpretation of geoelectric resistivity soundings measurements. Geophysical Prospecting. Vol. 19, No. 2, Pp. 192 192-217. Keller, G. V., and Frischknecht, F. C., (1966). Electrical Methods in Geophysical Prospecting, Oxford: ischknecht, . Pergamon. Mohammed, M. Z., (2007). Hydrogeophysical Investigation of parts of the River Jama are Floodplain, West Chad Basin, Northeastern Nigeria. Unpubl. Ph.D T Thesis Obafemi Awolowo Univ. Ile – Ife. Nigeria. Pp. mi Univ., 1 – 289. Mohammed, M. Z. and Olorunfemi, M. O., (2007) Geoelectric Investigation of the Sedimentary/Basement (2007). Transition Zone of parts of River Jama’are Flodplain in the West Chad Basin, Northeastern Nigeria. In Journal of Science Research Annals. Vol.3 No.2, pp. 44 44-59. Mohammed, M. Z., Olorunfemi, M. O. and Idornigie, A. I. (2012) Geoelectric sounding for evaluating soil (2012). corrosivity and the vulnerability of porous media aquifers in parts of the Chad Basin F Fadama Floodplain, Northeastern Nigeria. Journal of S. Dev., Vol. 5, No. 7; Canadian Center of Sc.& Ed., doi:10.5539/jsd.v5n7p111 Ojo, J. S., Olorunfemi, M. O. & Omosuyi, G. O. (2007). Geoelectric Sounding to Delineate Shallow Aquifers in the Coastal Plain Sands of Okitipupa Area S.W. Nigeria. Online J. of Earth Sciences, vol. 1(4), pp. 170 – 179. lain Oladapo, M. I. and Akintorinwa, O. J. (2007). Hydrogeophysical Study of Ogbese, Southwestern, Nigeria. . Global J. Pure and Applied Sci. 13(1): 5555-61. Oladapo, M. I., Mohammed, M. Z. Adeoye, O. O. and Adetola, B. A. (2004). Geoelectrical Investigation of the . Ondo State Housing Corporation Estate, Ijapo, Akure, Southwestern, Nigeria. Journal of Mining and Geology, Vol 40(1), pp. 41 41-48. Olorunfemi, M. O. and Fasuyi, S. A. (1993) Aquifer types and the geoelectric/hydrogeologic characteristics of , (1993). part of the central basement terrain of Nigeria (Niger State). Jour. of African Earth Sciences. 16, Pp. 309-317. Olayinka A. I. and Olorunfemi, M. O., (1992). “Geoelectric Investigation in Okene and its Implication for Borehole Sitting”. Journal of Mining and Geology, pp 403403-411. 39
- 12. Journal of Environment and Earth Science www.iiste.org ISSN 2224-3216 (Paper) ISSN 2225-0948 (Online) 0948 Vol 2, No.7, 2012 Olorunfemi, M. O. and Okhue, E. T. (1991). Hydrogeological and Geologic Significance of a Geoelectric Survey . at Ile-Ife, Nigeria. Journal of Mining and Geosciences Society, Vol. 28, pp. 221-229. Ife, 229. Olorunfemi, M. O. and Olorunniwo, M. O. (1985). Geoelectric Parameters and Aquifer Characteristics of some . parts of Southwestern, Nigeria. Geologic Applicate E. Hydrogeological XX, Part 1, pp. 9999-109. Olorunfemi, M. O., Ojo, J. S. and Akintunde, O. M. (1999). “Hydrogeophysical Evaluation of the Groundwater . Potential of Akure Metropolis, South South-Western Nigeria”. Journal of Mining and Geology. 35(2):207 – 228. Omosuyi, G. O., (2010). Geoelectric Assessment of Groundwater Prospect and vulnerability of overburden . aquifer. Ozean Journal of Applied Sciences 3(1), pp. 123 123-132. Orellana, E. and Mooney, H. M., (1996). Two-Layer Master Curve for Vertical Electrical Sounding over Layer Layered Earth Structures. Rahaman, M. A. (1976). “Review of the Basement Geology of Southwestern Nigeria”. In: Geology of Nigeria. . Kogbe, C.A. (ed). Elizabethan Publishing: Lagos, Nigeria. Rahaman, M. A., (1988 a). Recent advances in the study of the basement complex of Nigeria. In: P. O. Oluy . Oluyide (Co-ordinator), Precambrian Geology of Nigeria. Geol. Surv. Nigeria. Publ., p. 11 ordinator), 11-43. Sharma, P. V. (2000). Environmental and Engineering Geophysics. Cambridge University Press. Cambridge. Pp. 1-468 Satpathy, B. N. and Kanungo, B. N. (1976). Groundwater Exploration in Hard Rock, A Case Study; Geoph. ater Prosp. Vol. 24, No. 4, pp. 725 725-736. Vander Velpen, B. P. A. (1988). RESIST Software Version 1.0. M. Sc Research Project. ITC, Delft, Netherlands. Project. Copyright © 2004, ITC, IT IT-RSG/DSG. Acknowledgements Adekunle Ajasin University, Akungba Akoko is gratefully acknowledged for the use of her field facilities available in the Department of Geology/Applied Geophysics The encouraging comment from the anonymous Geophysics. reviewers is also acknowledged. Muraina Z. Mohammed born in Ogbagi Akoko Ondo state, southwestern Nigeria. He received a B. Tech. (1992) and an M. Tech. (1997) Degrees in Applied/Exploration Geophysics from the Federal University of Technology, Akure and a Ph.D (2007) Degree in Applied Geophysics from O Obafemi Awolowo Univesity, Ile – Ife, Nigeria. His major field of study is Exploration and Environmental Geophysics. His other interests are in Applied /Exploration Geophysics Control Source Electromagnetic ( Geophysics; (CSEM) for Hydrocarbon Exploration and GPR studies of active faults. 40
- 13. This academic article was published by The International Institute for Science, Technology and Education (IISTE). The IISTE is a pioneer in the Open Access Publishing service based in the U.S. and Europe. The aim of the institute is Accelerating Global Knowledge Sharing. More information about the publisher can be found in the IISTE’s homepage: http://www.iiste.org The IISTE is currently hosting more than 30 peer-reviewed academic journals and collaborating with academic institutions around the world. Prospective authors of IISTE journals can find the submission instruction on the following page: http://www.iiste.org/Journals/ The IISTE editorial team promises to the review and publish all the qualified submissions in a fast manner. All the journals articles are available online to the readers all over the world without financial, legal, or technical barriers other than those inseparable from gaining access to the internet itself. Printed version of the journals is also available upon request of readers and authors. IISTE Knowledge Sharing Partners EBSCO, Index Copernicus, Ulrich's Periodicals Directory, JournalTOCS, PKP Open Archives Harvester, Bielefeld Academic Search Engine, Elektronische Zeitschriftenbibliothek EZB, Open J-Gate, OCLC WorldCat, Universe Digtial Library , NewJour, Google Scholar