This document appears to be a strategic marketing report for Liverpool Football Club. It includes a situational analysis covering a PESTLE analysis, industry analysis using Porter's 5 Forces and a forecast, market analysis of domestic and global markets, competitor analysis, financial analysis, customer analysis, and an internal analysis. It also includes sections on objectives and strategy, tactics, and references. The overall goal is to develop a 5-year strategic marketing plan to give the club strategic direction and competitive advantage by clarifying its mission, vision, and value proposition.


![14
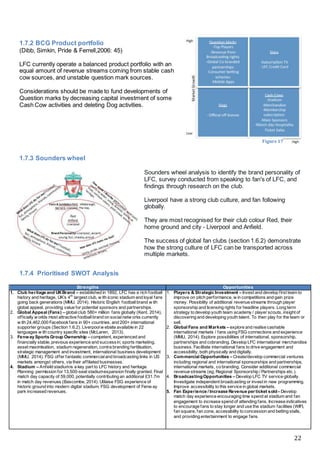
Launch of City Square in 2010 (Manchester City , [no date])
Arsenal
Qualif ied f or Champions League f or 16th
consecutiv e y ear, securing additional
broadcasting rights
Commercial rev enue increase helped by shirt
and stadium sponsorship f rom Emirates
New lucrativ e kit supplier deal f rom Puma in
2014 of £150m will increase commercial
rev enues going f orward (Mintel, 2014)
Chelsea
Receiv ed €20m less in broadcasting in
2012/13 than in 2011/12 af ter winning
Champions League
New commercial deals with Delta and
Gazprom, plus shirt sponsorship renewal
with Samsung
Won UEFA Cup in 2012/13
Tottenham Hotspur
Only made it into the Champions League once, in 2010/11.
It can be v ery benef icial f inancially to participate in the
Champions League as v iewership f igures are as high as 4
billion globally (Heineken, 2013)
New 5 y ear deal with Under Armour worth £10m per
season
Dual shirt sponsorship agreement
Match day rev enue decreased –limited by stadium capacity
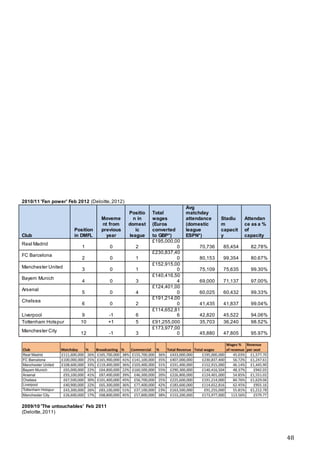
1.5.5 Total wages as a percentage of revenue over 5 years
Real Madrid, Bayern Munich and Manchester
United benefit from economies of scale, enabling
them to sustain financially healthy low wage bills.
(Fig. 10)
Manchester City has invested, on average, 95% of
their total revenue on wages over the past 5 years
(Fig.12). Although they have since been penalised
by UEFA for breaching FFP rules (Herbert, 2014),
the investment in players contributed to doubling
their broadcasting revenue and increasing their
commercial revenue by 800% over a 5 year
period, resulting in lower wage bills effective from
2011/12.
Investment in the team manager and players is
core to the success of the team and the overall business success (MMU, 2014). According to Deloitte
(2014b), six of the seven clubs that finished at the top of the Premier League in 2012/13 had above
average wage bills at £89m.
1.5.6 Revenue per ticket sold (RPTS)
Close rivals Chelsea lead the way on average RPTS, over the seasons 2008/09 – 2012/13, with a figure of
£1,724. (Fig. 11)
This could be a result of the affluent area around the
stadium, as well as the multiple hospitality package
offerings, the Michelin Star restaurants and hotel facilities
on-site (Chelsea, [no date] a).
Manchester City boast the lowest season ticket of the
Premier League (Deloitte, 2014), which likely contributes
to their low average RPTS.
However, it is noted that this figure is increasing year on
year (Fig. 10) potentially due to a rise in fan pride, glory
seekers and wealthy international visitors, and the
introduction of ‘City Square’ in 2010 (Manchester City,
[no date]a).
LFC’s RPTS is reasonable, however, there is “scope for
improvement “(MMU, 2014).
Figure10
Figure11](https://image.slidesharecdn.com/559c8e84-fc0e-4ba0-b256-087244fa88db-150716121440-lva1-app6892/85/LFC-Case-Study-14-320.jpg)


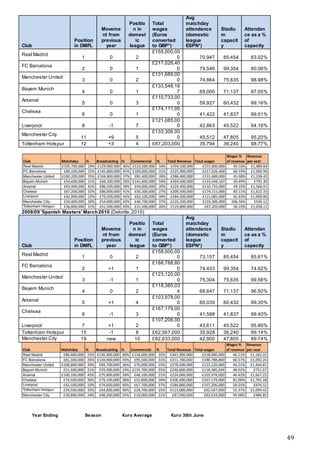
![21
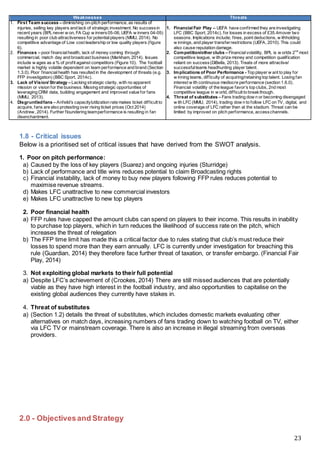
1.7 - Internal analysis
1.7.1 Dynamic Capabilities Value chain: Brand Heritage and Community of Fans
Supporting Activities
Owner:Fenway Sports Group (FSG) took ov er the club in October 2010 and hav e ‘…a prov en track record in sports marketing, asset maximization, stadium regeneration, contra branding f ertilization, strategic management and
inv estment, and international business dev elopment’ (MMU, 2014:23). The takeov er helped LFC negotiate higher v alued sponsorships, howev er, on-pitch perf ormance has not been as successf ul (MMU, 2014). FSG is based in
North America and also owns Major League Baseball team Boston Red Sox, Fenway Sports Management (FSM) and New England Sports Network (NESN), amongst other companies (MMU, 2014). This could prov ide additional
exposure and sponsorship opportunities f or LFC.
HQ & Management:Managing Director Ian Ay re brought all commercial aspects of the organisation in-house to enable LFC to hav e more control ov er its prof itability . LFC saw commercial rev enue up 85% ov er 2007-2012 af ter
this change was implemented (MMU, 2014). A new of f ice has been opened in London ‘to realise commercial potential’ (Joy , 2014), and Billy Hogan was hired as the Chief Commercial Director in 2012 to boost the v alue of the
brand (Joseph, 2012).
Newly appointed Chief Media Of f icer, Matthew Baxter, has been employ ed in an ef f ort to boost reach of digital content to ov erseas f ans (Joseph, 2013a).
Managementand support (Football Team): Brendan Rodgers manages the f irst team, along with 19 other staf f who support the team, comprising of assistant coaches, analy sts, phy siotherapists and consultants to name a
f ew (Liv erpool FC, [no date]a). Brendan Rogers joined the club in 2012, and has since signed 24 play ers f or LFC – many of those signed hav e been y oung play ers inv ested in f or the f uture, howev er, Sav age (2014) believ es that 20
of the signings don’t meet the mark. LFC also hav e ov er 40 play ers signed to their Under 21s and Under 18s squads through the ‘Academy ’, which current captain Gerrard joined when he was nine y ears old (BBC Sport, 2015),
prov ing the Academy has a history of success. They also hav e a successf ul women’s team – Liv erpool Ladies FC (ITV News, 2014).
Corporate Social Responsibility:LFC were awarded the ‘Community Mark’ in 2009 f or their inv estment in local and ov erseas communities, with a f ocus on ‘…education, health, social inclusion, phy sical activ ity and charity
support…’ (MMU, 2014:20). Although their community work benef its ev ery one, most initiatives aid y ounger people in the community by partnering with local schools.
Brand and Marketing:LFC has a strong brand, rich with heritage (Rogers, 2013), with the brand being v alued at £279m in 2014 and ranked 8th
highest f ootball brand in the world (Brand Finance, 2014). The LFC brand is
reportedly the 5th
most inf luential sports brand in licensing (Crookes, 2013). Brand Finance CEO, believ es that brand v alue can be lev eraged to grow rev enue (Brand Finance, 2014). The LFC brand is ‘…about inclusiv eness,
society , community and respect’ (MMU, 2014:22), resonating with f ans internationally . LFC works with its partners to create ‘…innov ativ e and measurable marketing programmes that consistently meet and surpass their business
objectiv es’ (Liv erpool FC, [no date]b).
Primary Activities
Players & Team:LFC
currently employ 3 of the top
100 f ootball play ers in the
world (Sedghi and Arnett,
2014), this could result in
increased brand attractiv eness
and improv e on-pitch
perf ormance, leading to
rev enue growth. Howev er,
long-serv ing captain Stev en
Gerrard is due to depart the
club at the end of the (Smith,
2015) and the team will need
to be strengthened (Brand
Finance, 2014). Wage bills are
also v ery high considering lack
of top play ers (Sav age, 2014).
The f irst team tour
international markets ahead of
the f ootball season (MMU,
2014) to grow interest.
Stadium & Facilities:Stadium capacity is
currently 45,522 with plans to expand to
58,000 (Menezes, 2014), as stadium capacity
utilisation rate is so high. As well as of f ering
v arious hospitality packages, conf erence
f acilities, stadium and museum tours (MMU,
2014), and prov iding additional f acilities f or
f amilies (Family Park & Family Zone), LFC are
committed to improv ing f an experience by
making changes based on f an f eedback
(Liv erpool FC, [no date]c). It is also used f or
hosting ev ents like tribute acts and Christmas
parties. (Liv erpool FC, [no date]d). The Anf ield
Stadium has receiv ed the highest percentage
of ‘excellent’ ratings on TripAdv isor, compared
to competitors (see appendix 3). LFC of f er f ree
Wi-Fi access to the f ans in the 12,000-seater
Centenary Stand, howev er, they hav e no
plans to roll this out to the rest of the stadium
(Rey nolds, 2013). LFC can collect data on the
f ans who use the Wi-Fi (Joseph, 2013b)
Stores & Merchandise:
LFC hav e a wide range of
branded and licensed
merchandise (MMU, 2014).
Branded merchandise can
be purchased at 8 of f icial
club stores throughout the
UK, Northern Ireland,
Republic of Ireland and
Malay sia, with concessions
in Indonesia (Liv erpool FC
Store, [no date]), online, and
through other partnered
retailers. Replica kits and
f ootball accessories, such
as f ootball boots, make up
the bulk of the sales (MMU,
2014). LFC also plan to
open of f icial stores in
Thailand and Indonesia
(Liv erpool FC, 2014).
Subscriptions (Membership &
TV/Web/Mobile):LFC of f er
competitiv ely priced junior, light, f ull and
international membership (MMU, 2014;
see appendix 1 f or price comparison with
competitors). They are also v ery
accessible, hav ing a TV channel av ailable
on pay -TV packages in the UK, and LFC
TV Go (an on-demand serv ice av ailable
digitally ) f or both UK and international
f ans, which generate ov er £5m annually
(MMU, 2014). LFC are the most activ e
sports brand on social media (MMU,
2014), creating localised pages to
increase engagement and loy alty
ov erseas (Joseph, 2013c; Joseph, 2013a)
and also hav e a dedicated online f an area
on their website – ‘theKOP’, increasing
f ans opportunities to interact f urther
(Liv erpool FC, [no date]e). There are also
multiple mobile apps av ailable to
download (Liv erpool FC, [no date]f ),
adding to f an experience.
On-pitch
Performance:
Broadcasting rev enue
increases with on-pitch
success (MMU, 2014).
In the 2012/13 season,
broadcasting rev enues
accounted f or 31% of
total rev enue at
£63.9m, approximately
£40m less than close
riv als Chelsea and
Manchester City
(Deloitte, 2014), On-
pitch success can also
be linked to an increase
in sales of
merchandise,
subscriptions and
match day tickets,
whilst enabling LFC to
negotiate bigger
sponsorship deals.
Sponsorship, Partnerships &
Franchises:LFC hav e 3 main
sponsors, 14 global partners and 4
regional marketing partners (in
Thailand, Malay sia, Singapore and
India). The partnerships are committed
to putting f an rewards and engagement
f irst (Liv erpool FC, [no date]b).
LFC of f er a co-branded rewards credit
card (MBNA, [no date]), which allows
LFC to collect data on f ans. LFC of f er
coaching to play ers all ov er the world
through their Soccer School and
International Football Academy
programmes (MMU, 2014). This driv es
f an recruitment and engagement
through brand exposure internationally .
Figure 16: Porter's (1980) Value Chain adapted by Atkinson (2010)
CompetitiveAdvantage](https://image.slidesharecdn.com/559c8e84-fc0e-4ba0-b256-087244fa88db-150716121440-lva1-app6892/85/LFC-Case-Study-21-320.jpg)


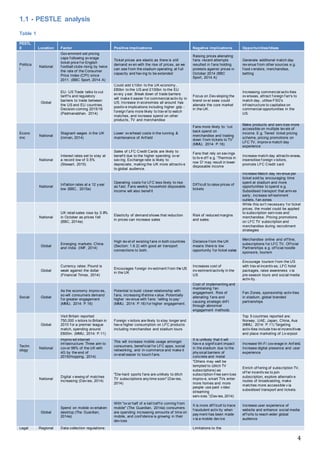
![27
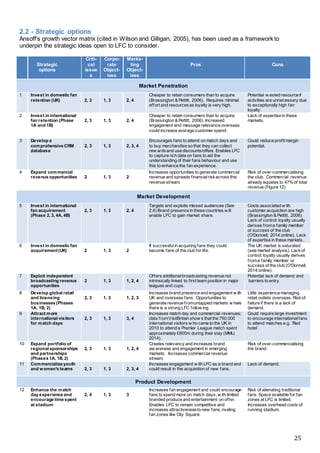
It is recommended that LFC increase engagement and interaction opportunities in these countries by
growing physical store presence, supporting international fan zones and continuation of overseas pre-
season tours, introduction of loyalty rewards and localised partnerships.
LFC may not currently have the capabilities in-house to exploit these markets to their full potential and
should look to recruit people or out-source local agencies with experience dealing in these markets in order
to meet fans wants and needs.
Strategic Choice 2 (ST2): Option 4; Expand commercial revenue income opportunities
LFC are in a poor position financially (Section 1.8) yet there are a significant number of opportunities
available to them to expand their commercial revenue stream, both in emerging and existing markets,
where fans exist in their millions (1.6). LFC can implement activities to increase brand loyalty and
preferability by building a stronger presence internationally, for example through regional sponsorships.
However, there is a risk of over-commercialising the brand.
Strategic Choice 3 (ST5): Invest in international fan acquirement (Phase 2, 3, 4A, 4B)
There are opportunities to attract potential fans in emerging markets that have an increasing interest in the
Premier League, specifically, the USA, Australia and South Africa, where LFC fan bases are growing
(Section 1.3).
There are also opportunities to acquire fans in countries that have shown high interest in football generally.
The four key market segments identified as the best targets for LFC are segments 2, 3, 4A and 4B (Section
2.6) with a primary focus year one on USA and Australia.
It will be beneficial for LFC to build further brand awareness in these markets to meet this demand.
However, as these markets are still in their infancy, high acquisition rates cannot be guaranteed.
Strategic Choice 4 (ST4): Option 14; Invest in, develop and restructure first team
Figure 7 shows the correlation between on-pitch success and club revenues. As the two are intrinsically
linked, LFC should place a strong focus on improving the first team through player investment, team
restructure and youth development.
LFC’s long-serving history of success means the club has the capabilities to support the strategy, however,
due to their poor financial status, there must be extreme care and consideration in terms of player
investment - taking into account wages as a percentage of revenue to ensure FFP guidelines are met.
It is recommended to also consider investing in players who are successful both on-pitch and off, in order to
strengthen commercial marketing messages through leveraging popular players’ personalities.
This strategy will also raise the likelihood of securing places in the European competitions, increasing
brand awareness and generating more broadcasting revenue.
Strategic Choice 5 (ST5): Option 16; Expand match day revenue income opportunities
Match day revenues currently account for the lowest proportion of LFC’s income (Section 1.5). As the
stadium expansion is now underway, it is the perfect time to instigate changes to the stadium that will
increase average revenue per ticket sold.
Close competitors Manchester City increased their match day revenues by nearly 60% from 2010 (Section
1.5). Contributing to this was the introduction of ‘City Square’ where fans are encouraged to attend pre and
post-match entertainment, as well as a bar and café (Manchester City, [no date]).
Although LFC may not have the land to replicate this, they can make changes within the stadium to
increase match day experience, such as trendy street food vendors (which reduces paid staff costs and
enables LFC to charge rent for the hiring of concession stalls), introduction of new technology to the
stadium and entertainment, encouraging fan attendance and engagement. There is a risk of alienating
traditional fans with this strategy.](https://image.slidesharecdn.com/559c8e84-fc0e-4ba0-b256-087244fa88db-150716121440-lva1-app6892/85/LFC-Case-Study-27-320.jpg)


![36
Abell, D. F. and Hammond J.S. (1979) Strategic Marketing Planning: Problems and Analytical
approaches. Englewood Cliffs, NJ: Prentice-Hall. Cited by: Wilson, R.M.S and Gilligan, C. (2005)
Strategic Marketing Management: Planning, Implementation & Control. 3rd
Ed., Oxford: Butterworth-
Heinemann
Adamson. G., Jones. W. & Tapp. A (2005) ‘From CRM to FRM: Applying CRM in the football industry.’
Journal of Database Marketing & Customer Strategy Management. Vol. 13, no. 2, pp.156-172
Allianz Arena (no date) General information about the Allianz Arena [Online] [Accessed on 6th
January
2015] https://www.allianz-arena.de/en/fakten/allgemeine-informationen/
Andrew, J. (2014). ‘Liverpool fans to continue protest over high ticket prices despite owner John Henry
making contact’ The Daily Mail [Online] [Accessed 15 December
2014]http://www.dailymail.co.uk/sport/football/article-2859189/Liverpool-fans-continue-protest-high-
ticket-prices-despite-owner-John-Henry-making-contact.html.
Arsenal ([no date]a) The real capacity of Emirates stadium [Online] [Accessed on 6th
January 2015]
http://www.arsenal.com/155/unhoused-import-pages/latest-stadium-news/the-real-capacity-of-emirates-
stadium
Arsenal ([no date]b) Arsenal memberships 2014/15 [Online] [Accessed on 6th
January 2015]
https://www.eticketing.co.uk/arsenal/memberships.aspx?findmembership=1
Arsenal (2011) Info for members and TV Online subscribers [Online] [Accessed on 6th
January 2015]
http://www.arsenal.com/news/news-archive/info-for-members-and-tv-online-subscribers
Atkinson, D. (2010) Dynamic Capabilities Lecture. Manchester; Manchester Metropolitan University
Banyan. A (2010). Kick-off Frenzy: Asia and English Premier League. Available:
http://www.economist.com/blogs/banyan/2010/08/asia_and_english_premier_league . [online] [Accessed
22nd January 2015].
Barca TV (no date) Barca TV [Online] [Accessed on 6th
January 2015]
http://barcatv.fcbarcelona.com/shows
Bascombe, C. (2014). ‘Liverpool FC news: Anfield stadium construction begins with £115m interest-free
loan from FSG.’ The Telegraph [Online] [Accessed on 11th January 2015]
http://www.telegraph.co.uk/sport/football/teams/liverpool/11273448/Liverpool-FC-news-Anfield-stadium-
construction-begins-with-115m-interest-free-loan-from-FSG.html. [Online] [Accessed 11th Dec 2014].
BBC (2009) Premier League giants target India. [Online] [Accessed 18th
January 2015]
http://news.bbc.co.uk/1/hi/business/8083210.stm
BBC (2014a) UK retail sales rose by 0.8% in October as prices fell. [Accessed on 10th
January 2015]
http://www.bbc.co.uk/news/business-30125972
BBC (2015a) UK interest rates held at 0.5% by Bank of England [Online] [Accessed on 10th
January
2015] http://www.bbc.co.uk/news/business-30726535
BBC (2012a). Premier League rights sold to BT and BSkyB for £3bn. Available:
http://www.bbc.co.uk/news/business-18430036. [online] [Accessed 12th December 2014].
BBC (2014b). Price of Football: Tickers increases outstrips cost of living. Available:
http://www.bbc.co.uk/sport/0/football/29614980. [online] [Accessed 28th November 2014].
BBC News (2014b) ‘Liverpool signs airline Garuda as training kit partner.’ BBC News. [Online] 27th
January. [Accessed on 5th
January 2015] http://www.bbc.co.uk/news/25909401
BBC Sport (2014b) Real Madrid reveal £330m design for new Bernabeu stadium. [Online] [Accessed on
6th
January 2015] http://www.bbc.co.uk/sport/0/football/25978150](https://image.slidesharecdn.com/559c8e84-fc0e-4ba0-b256-087244fa88db-150716121440-lva1-app6892/85/LFC-Case-Study-36-320.jpg)
![37
BBC Sport (2015) Steven Gerrard: Liverpool captain to leave at end of season. [Online] [Accessed on
20h
January 2015] http://www.bbc.co.uk/sport/0/football/30653547
BBC Sport. (2014c). ‘Liverpool under UEFA Financial Fair Play investigation.’ BBC News [Online]
[Accessed 15 December 2014] http://www.bbc.co.uk/sport/0/football/29356406.
BBC Sport. (2014a). Liverpool: Anfield protest against prices during Hull City game. [Online] [Accessed
on 7th
January 2015] http://www.bbc.co.uk/sport/0/football/29775393
Bingham, C. (2014) Customer Loyalty Is Dead. Long Live Engagement! Forbes [Online] [Accessed on
20h
January 2015] http://www.forbes.com/sites/oracle/2014/03/28/customer-loyalty-is-dead-long-live-
engagement/
Bland, B. (2013). Indonesia Football: English clubs pitch for fans as local league falls apart |
Beyondbrics. Available: http://blogs.ft.com/beyond-brics/2013/01/29/indonesia-bad-for-local-football-
teams-lucrative-for-uk-ones/ [online] [Accessed 18th November 2014].
Brand Finance (2014) BrandFinance® Football 50 2014 [Online] [Accessed on 10th
November
2014]http://www.brandfinance.com/knowledge_centre/reports/brandfinance-football-50-2014
Brassington, F. and Petitt, S. (2006), Principles of Marketing. 4th
Ed., Harlow: Financial Times Prentice
Hall.
Campbell, P. (2014). Manchester City top global pay table with average salaries of £5.3m a year.
[Online] [Accessed 22nd Jan 2015] http://www.theguardian.com/football/blog/2014/apr/15/manchester-
city-global-pay-table-chelsea-barcelona-real-madrid
Chelsea FC ([no date]a) On-site facilities. [Online] [Accessed 6th
January 2015]
http://events.chelseafc.com/on-site-facilities/
Chelsea FC ([no date]b) True Blue membership 2014/15 [Online] [Accessed on 6th
January 2015]
http://kr.chelseafc.com/membership
Chelsea FC ([no date]c) Videos [Online] [Accessed on 6th
January 2015]
http://www.chelseafc.com/videos/chelsea-tv-on-demand.html
Crookes, D (2014) Manchester United beat Liverpool to be names the most influential football club brand
in the world [Online] [Accessed 14th
January 2015] http://www.independent.co.uk/sport/football/news-
and-comment/manchester-united-beat-liverpool-to-be-named-the-most-influential-football-club-brand-in-
the-world-8932011.html
Crookes, D. (2013) ‘Manchester United beat Liverpool to be named the most influential football club
brand in the world.’ The Independent [Online] 11th
November [Accessed 19th
January 2015]
http://www.independent.co.uk/sport/football/news-and-comment/manchester-united-beat-liverpool-to-be-
named-the-most-influential-football-club-brand-in-the-world-8932011.html
Daily Mail. (2011). Manchester United tie up £40m shirt sponsor deal... for their training kit!. Available:
http://www.dailymail.co.uk/sport/football/article-2028801/DHL-spend-10m-year-sponsor-Manchester-
Uniteds-training-kit.html. [online] [Accessed 23rd December 2014].
Davies, P (2014) Spectator Sports – UK – April 2014 [Online] [Accessed December 20th
2014]
http://store.mintel.com/spectator-sports-uk-april-2014
Davies, P. (2014). Digital Trends Winter - UK - December 2014 – Executive Summary. [Accessed on 1st
January 2015] http://store.mintel.com/digital-trends-winter-uk-december-2014
Deloitte (2010) Spanish masters: Football Money League [Online] [Accessed 16th
November 2014]
https://www.deloitte.com/assets/Dcom-Ecuador/Local%20Assets/Documents/Estudios/100412-
ec_DeloitteFML2010.pdf](https://image.slidesharecdn.com/559c8e84-fc0e-4ba0-b256-087244fa88db-150716121440-lva1-app6892/85/LFC-Case-Study-37-320.jpg)
![38
Deloitte (2011) The untouchables: Football Money League [Online] [Accessed 16th
November 2014]
http://www.deloitte.com/assets/Dcom-
Chile/Local%20Assets/Documents/Nuevos/cl(es)_FML2011_140211.pdf
Deloitte (2012) Fan power: Football Money League [Online] [Accessed 16th
November 2014]
http://www.deloitte.com/assets/Dcom-
Sweden/Local%20Assets/Documents/FootballMoneyLeague%202012-uk-sbg-dfml-2012-final120209.pdf
Deloitte (2013) Captains of industry: Football Money League [Online] [Accessed 16th
November 2014]
http://www.deloitte.com/assets/Dcom-
Azerbaijan/Local%20Assets/Documents/footballmoneyleague2013.pdf
Deloitte (2014a) All to play for: Football Money League [Online] [Accessed 16th
November 2014]
http://www2.deloitte.com/content/dam/Deloitte/uk/Documents/sports-business-group/deloitte-uk-deloitte-
football-money-league-2014.pdf
Deloitte (2014b) Annual Review of Football Finance 2014 infographic [Online] [Accessed 16th
December
2014] http://www.deloitte.co.uk/aem/arff-2014-infographic.cfm
Deloitte. (2014). Annual Review of Football Finance 2014. [Online] [Accessed: 13th Jan 2015.]
http://www2.deloitte.com/uk/en/pages/sports-business-group/articles/annual-review-of-football-
finance.html
Dibb, S. Simkin, L. Pride, W. Ferrell, OC (2006) Marketing Concepts and strategies. 5th
edition. Boston:
Charles Hartford
DiBella M.F. (2013). Statistically Ranking the World's Top 20 Football Leagues. [Online] [Accessed 24th
December 2014] http://bleacherreport.com/articles/1458287-ranking-the-top-20-world-football-leagues-
statistically.
ESPN (no date) Football points table. [Online] [Accessed on 20th December 2014]
http://www.espn.co.uk/football/sport/tournament/points.html?event=28;season=2011%2F12
ESPN FC ([no date]a) Real Madrid statistics. [Online] [Accessed on 20th December 2014]
http://www.espnfc.com/club/real-madrid/86/statistics/performance
ESPN FC ([no date]b) Barcelona statistics. [Online] [Accessed on 20th December 2014]
http://www.espnfc.com/club/barcelona/83/statistics/performance
ESPN FC ([no date]c) Bayern Munich statistics. [Online] [Accessed on 20th December 2014]
http://www.espnfc.com/club/bayern-munich/132/statistics/performance
ESPN FC ([no date]d) Manchester United statistics. [Online] [Accessed on 20th December 2014]
http://www.espnfc.com/club/manchester-united/360/statistics/performance
ESPN FC ([no date]e) Manchester City statistics. [Online] [Accessed on 20th December 2014]
http://www.espnfc.com/club/manchester-city/382/statistics/performance
ESPN FC ([no date]f) Chelsea statistics. [Online] [Accessed on 20th December 2014]
http://www.espnfc.com/club/chelsea/363/statistics/performance
ESPN FC ([no date]g) Arsenal statistics. [Online] [Accessed on 20th December 2014]
http://www.espnfc.com/club/arsenal/359/statistics/performance
ESPN FC ([no date]h) Liverpool statistics. [Online] [Accessed on 20th December 2014]
http://www.espnfc.com/club/liverpool/364/index
ESPN FC ([no date]i) Tottenham Hotspur statistics. [Online] [Accessed on 20th December 2014]
http://www.espnfc.com/club/tottenham-hotspur/367/statistics/performance](https://image.slidesharecdn.com/559c8e84-fc0e-4ba0-b256-087244fa88db-150716121440-lva1-app6892/85/LFC-Case-Study-38-320.jpg)
![39
FAME (2014a) 10 year financial data (2004 – 2013), Chelsea Football Club Limited (01965149). [Online]
[Accessed on 7th November 2014] https://fame-bvdinfo-com.ezproxy.mmu.ac.uk/version-
2015115/Report.serv?_CID=130&context=1G7M9GN4BXWOQV3
FAME (2014b) 10 year financial data (2004 – 2013), Manchester City Limited (02989498). [Online]
[Accessed on 7th November 2014] https://fame-bvdinfo-com.ezproxy.mmu.ac.uk/version-
2015115/Report.serv?_CID=437&context=1G7M9GN4BXWOQV3
FAME (2014c) 10 year financial data (2004 – 2013), The Liverpool Football Club And Athletic Grounds
Limited (00035668). [Online] [Accessed on 7th November 2014] https://fame-bvdinfo-
com.ezproxy.mmu.ac.uk/version-2015115/Report.serv?_CID=287&context=1G7M9GN4BXWOQV3
FAME (2014d) 10 year financial data (2004 – 2013), Tottenham Hotspur Limited (01706358). [Online]
[Accessed on 7th November 2014] https://fame-bvdinfo-com.ezproxy.mmu.ac.uk/version-
2015115/Report.serv?_CID=512&context=1G7M9GN4BXWOQV3
FC Barcelona ([no date]a) Camp Nou. [Online] [Accessed on 6th
January 2015]
http://www.fcbarcelona.com/club/facilites-and-services/camp_nou
FC Barcelona ([no date]b) 2015 membership card renewal [Online] [Accessed on 6th
January 2015]
http://www.fcbarcelona.com/members/detail/card/2015-membership-card-renewal
FC Barcelona ([no date]c) Memòria Anual del FC Barcelona [Online] [Accessed 20th December 2014]
http://www.fcbarcelona.cat/club/premsa/detall/fitxa/memoria-anual-del-fc-
barcelona?_ga=1.126307976.402642577.1419427072
FC Bayern (2013) Bayern post landmark €400m plus turnover [Online] [Accessed 20th
December 2014]
http://www.fcbayern.de/en/news/news/2013/agm-2013-new-record-figures-400-million.php
FC Bayern (no date) My FCB.TV subscription [Online] [Accessed on 6th
January 2015]
https://www.fcbayern.de/en/registration/?service=FCBTV&returnUrl=http%3A///en
FC Bayern Forum (no date) How do I become a member of the club? [Online] [Accessed on 6th
January
2015] http://www.bayernforum.com/general-bayern-f13/how-do-i-become-a-member-of-the-club-
t6987.html
Financial Fair Play (2014) Financial Fair Play Explained [Online] [Accessed: 24th
January 2015]
http://www.financialfairplay.co.uk/financial-fair-play-explained.php
Financial Times. (2014).Currencies. [Online] [Accessed on 6h
December 2014]
http://markets.ft.com/research/Markets/Currencies
Foy, T., (2015) Building a global social network: A Case study on LFC. Southampton FC: Melbourne
Gibson, O. (2012) ‘Premier League TV rights set to top £5bn for first time.’ The Guardian [Online] 12th
November [Accessed 10th
December 2014] http://www.theguardian.com/football/2012/nov/12/premier-
league-tv-rights-5-bn
Gilligan. C. and Wilson, R. (2013) Strategic Marketing Management: Planning, implementation and
control. 3rd
Ed. New York: Routledge
Hall, R. (2014) ‘Juventus: Serie A alternative club guide’ The Guardian. [Online] 22nd
July [Accessed 10th
December 2014] http://www.theguardian.com/football/the-gentleman-ultra/2014/jul/22/juventus-serie-a-
alternative-club-guide-fans-trezeguet
Heineken (2013) HEINEKEN renews UEFA Champions League sponsorship. [Online] [Accessed 16th
December 2014] http://www.heineken.co.uk/article.php?article=1234567880
Herbert, I. (2014) ‘Manchester City fined £49m for breaching Uefa's financial fair play rules - and will see
their Champions League squad reduced.’ The Independent. [Online] 16th
May [Accessed on 5th
January](https://image.slidesharecdn.com/559c8e84-fc0e-4ba0-b256-087244fa88db-150716121440-lva1-app6892/85/LFC-Case-Study-39-320.jpg)
![40
2015] http://www.independent.co.uk/sport/football/premier-league/manchester-city-fined-49m-for-
breaching-uefas-financial-fair-play-rules-9388532.html
Hill, C. W. L. (1988), ‘Differentiation Versus Low Cost or Differentiation and Low Cost: A Contingency
Framework.’ Academy of Management Review, Vol. 13, no. 3, pp. 401-412.
Hunter, A. (2013) ‘La Liga seeks collective TV rights deal to close gap on Premier League.’ The
Guardian [Online] 11th
April [Accessed 20th
December 2014]
http://www.theguardian.com/football/2013/apr/11/la-liga-television-rights-premier-league
IMF -International Monetary Fund (2014). WORLD ECONOMIC OUTLOOK (WEO) UPDATE An Uneven
Global Recovery Continues. [Online] [Accessed on 20h
January 2015]
http://www.imf.org/external/pubs/ft/weo/2014/update/02/
Inman, P (2014) Starting Salaries stagnant across the UK and wages may fall. [Online] [Accessed on
10th
January 2015] http://www.theguardian.com/money/2014/aug/11/salaries-stagnent-cipd-survey-uk-
inflation-wages
ITV News (2014) ‘Liverpool ladies hoping success will continue’. ITV News [Online] 16th
October
[Accessed on 10th
January 2015] http://www.itv.com/news/granada/update/2014-10-16/liverpool-ladies-
look-for-success-in-europe/
Joseph, S. (2012) Liverpool names chief commercial director. Marketing Week [Online] [Accessed on
15th
January 2015] http://www.marketingweek.com/2012/05/25/liverpool-names-chief-commercial-
director/
Joseph, S. (2013a) Liverpool FC names digital media chief. Marketing Week [Online] [Accessed on 15th
January 2015] http://www.marketingweek.com/2013/02/05/liverpool-fc-names-digital-media-chief/
Joseph, S. (2013b) Football clubs offset match-day revenues dip with real-time marketing. Marketing
Week [Online] [Accessed on 15th
January 2015] http://www.marketingweek.com/2013/07/05/football-
clubs-offset-match-day-revenues-dip-with-real-time-marketing/
Joseph, S. (2013c) Liverpool eyes fan boost through social content push. Marketing Week [Online]
[Accessed on 5th
January 2015] http://www.marketingweek.com/2013/01/25/liverpool-eyes-fan-boost-
through-social-content-push/
Joseph, S. (2014) Man Utd leads rush from football clubs for regional sponsorships. Marketing Week
[Online] [Accessed on 16th
November 2014] http://www.marketingweek.com/2014/08/21/man-utd-leads-
rush-from-football-clubs-for-regional-sponsorships/
Joy, S. (2014a) Appeal of Man U brand grows with sponsors despite on-pitch woes. Marketing Week
[Online] [Accessed on 16th
November 2014] http://www.marketingweek.com/2014/09/10/appeal-of-man-
u-brand-grows-with-sponsors-despite-on-pitch-woes/
Joy, S. (2014b) Liverpool FC moves to London to ‘realise commercial potential’. Marketing Week
[Online] [Accessed on 16th
November 2014] http://www.marketingweek.com/2014/10/10/liverpool-fc-
moves-to-london-to-realise-commercial-potential/
Kent, D. (2014). ‘Liverpool claim they have a worldwide fan base 580m people... just as well they are
looking to increase Anfield's capacity.’ The Daily Mail. [Online] [Accessed on 11th January 2015]
http://www.dailymail.co.uk/sport/football/article-2792400/liverpool-claim-worldwide-fan-base-580m-
people-just-looking-increase-anfield-s-capacity.html. [Online] [Accessed 12th January 2015].
Kohli A.K., Jaworski B.J. (1990) “ Market Orientation: The Construct, Research Propositions, and
Managerial Implications”, Journal or Marketing, 54 (April, 1990) pp.1-18.
Liverpool FC ([no date]a) Team. [Online] [Accessed on 15th
January 2015]
http://www.liverpoolfc.com/team](https://image.slidesharecdn.com/559c8e84-fc0e-4ba0-b256-087244fa88db-150716121440-lva1-app6892/85/LFC-Case-Study-40-320.jpg)
![41
Liverpool FC ([no date]b) Corporate Charter. [Online] [Accessed on 15th
January 2015]
http://www.liverpoolfc.com/corporate/charter
Liverpool FC ([no date]c) Fan experience. [Online] [Accessed on 15th
January 2015]
http://www.liverpoolfc.com/fans/fan-experience
Liverpool FC ([no date]d) Events at Anfield. [Online] [Accessed on 15th
January 2015]
http://events.liverpoolfc.com/events-at-anfield
Liverpool FC ([no date]e) The Kop. [Online] [Accessed on 15th
January 2015]
http://www.liverpoolfc.com/fans/thekop/how-it-works
Liverpool FC ([no date]f) Apps and Games. [Online] [Accessed on 15th
January 2015]
http://www.liverpoolfc.com/fans/apps-and-games/uk
Liverpool FC ([no date]g) Benefits [Online] [Accessed on 6th
January 2015]
http://www.liverpoolfc.com/membership/benefits-prices
Liverpool FC ([no date]h) LFCTV Go [Online] [Accessed on 6th
January 2015]
http://www.liverpoolfc.com/video
Liverpool FC (2014) Reds open new store in Malaysia. [Online] [Accessed on 15th
January 2015]
http://www.liverpoolfc.com/news/latest-news/171572-reds-open-new-store-in-malaysia
Liverpool FC Store ([no date]) Store finder. [Online] [Accessed on 15th
January 2015]
http://store.liverpoolfc.com/stores/finder/
Manchester City ([no date]a) About City Square. [Online] [Accessed on 5th
January 2015]
http://www.mcfc.co.uk/Fans/City-Square/About-City-Square/About-City-Square
Manchester City ([no date]b) Be a Cityzen [Online] [Accessed on 6th
January 2015]
http://beacityzen.mcfc.co.uk
Manchester City ([no date]c) CityTV [Online] [Accessed on 6th
January 2015] http://www.mcfc.co.uk/citytv
Manchester United ([no date]a) Company information [Online] [Accessed on 6th
January 2015]
http://ir.manutd.com/company-information/history.aspx
Manchester United ([no date]b) Official membership [Online] [Accessed n 6th
January 2015]
http://www.manutd.com/en/Official-Membership/New-Prices.aspx
Manchester United ([no date]c) MUTV HD [Online] [Accessed on 6th
January 2015]
http://www.manutd.com/en/MUTV-New/MUTV-FaqsNew.aspx
Manchester United (2014) Manchester United. [Online] [Accessed 10th
December 2014]
http://ir.manutd.com/~/media/Files/M/Manutd-
IR/About%20Manchester%20United/manu_presentation.pdf
Markham, C. (2014). ‘Liverpool financial results: Reds post £50m loss, but insist club is moving in right
direction.’ [Online] [Accessed 15 December 2014] http://www.independent.co.uk/sport/football/premier-
league/liverpool-financial-results-reds-post-50m-loss-but-insist-club-is-moving-in-right-direction-
9167721.html.
MBNA (no date) The official Liverpool FC rewards credit card. [Online] [Accessed on 5th
January 2015]
https://apply.mbna.co.uk/UKNeoCCapp/entry?sc=1OASLFCIGC0041L&mc=OAGLFC005DP
McLaren D., (2013). ‘Liverpool FC’s Winning online presence’ The UK Sports Network [Online]
[Accessed 15th December 2014] http://www.theuksportsnetwork.com/liverpool-fcs-winning-online-
presence. [Online] [Accessed 22nd December 2014].](https://image.slidesharecdn.com/559c8e84-fc0e-4ba0-b256-087244fa88db-150716121440-lva1-app6892/85/LFC-Case-Study-41-320.jpg)
![42
McNulty, P. (2013) Which is the Premier League's biggest club? BBC Sport [Online] [Accessed on 5th
January 2015] http://www.bbc.co.uk/sport/0/football/20974695
Menezes, J.D. (2014) ‘Liverpool's stadium development plans approved as Anfield expansion gets the
green light.’ The Independent. [Online] 23rd
September
http://www.independent.co.uk/sport/football/news-and-comment/liverpools-anfield-development-plans-
approved-as-anfield-expansion-gets-the-green-light-9750977.html
Miller, A. (2014). Manchester United and Real Madrid continue to top replica shirt sales charts by selling
an average of 1.5 million each year. Available: http://www.dailymail.co.uk/sport/football/article-
2738568/Manchester-United-Real-Madrid-continue-replica-shirt-sales-charts-selling-average-1-5m-
year.html. [online] [Accessed 18th November 2014].
Mintel (2014) Football – UK – November 2014 [Online] [Accessed: 25th
Jan 2015]
http://reports.mintel.com/display/679670/
MMU (2014) ‘Liverpool Football Club Level 6 Strategic Marketing Case Study’ MMU Business School
Mullock, S. (2015). Premier League set for TV revolution with EVERY GAME available for streaming
under £4billion new deal. [Online] [Accessed: 13th Jan 2015]
http://www.mirror.co.uk/sport/football/news/premier-league-set-tv-revolution-4956046
Neville, G., (2013) Football needs to act now. The game is sleepwalking towards a crisis over
agents[Online] [Accessed 25th
January 2015] http://www.dailymail.co.uk/sport/football/article-
2279744/Football-sleepwalking-crisis-agents-It-act-Gary-Neville.html
O’donell. K (2013) My football club made me miserable, so I started supporting another team. [Online]
[Accessed 6th
January 2015] http://www.theguardian.com/football/when-saturday-comes-
blog/2013/mar/14/football-club-miserable-support-another-team
Oanda (no date) Currency converter [Online] [Accessed on 5th
January 2015]
http://www.oanda.com/currency/converter/
ON S (2013). Table A38 - Income and source of income by age of household reference person, 2013
(Excel sheet 46Kb). [Online] [Accessed: 22nd Jan 2015.]
http://www.google.co.uk/url?sa=t&rct=j&q=&esrc=s&source=web&cd=1&ved=0CCMQFjAA&url=http%3A
%2F%2Fwww.ons.gov.uk%2Fons%2Frel%2Ffamily-spending%2Ffamily-spending%2F2014-
edition%2Frft-a38-final-
2013.xls&ei=2qDGVIT5BoaW7AaavoG4Bw&usg=AFQjCNGDbyfzO5uUY1TqlDLKwNs6E5rOfQ&sig2=7r
WLZge1aNxFl6V1fqgKWA&bvm=bv.84349003,d.ZGU
Padmanabhan, L (2014) TTIP: The EU-US trade deal explained [Online] [Accessed on 10th
January
2015] http://www.bbc.co.uk/news/uk-politics-30493297
Pearce, J (2014) Exclusive – 580 million reasons why Liverpool FC Chief Bill Hogan is excited about
Red’s future. [Online] [Accessed 19th
January 2015]
http://www.liverpoolecho.co.uk/sport/football/football-news/exclusive---580-million-reasons-7922473
Platini, M (2014) Financial Fair Play: All you need to know about how it works [Accessed on 1st January
2015] http://www.bbc.co.uk/sport/0/football/29361839
Porter, M.E. (1980) Competitive Strategy. Free Press; New York. Cited by: Wilson, R.M.S and Gilligan,
C. (2005) Strategic Marketing Management: Planning, Implementation & Control. 3rd
Ed., Oxford:
Butterworth-Heinemann
Powell, M (2012) Marketing planning Manchester Metropolotan University, 15, 22/10/12 Lecture 5 Brand
Management
Premier League (no date) About the Premier League. [Online] [Accessed 16th
December 2014]
http://www.premierleague.com/en-gb/about/the-worlds-most-watched-league.html](https://image.slidesharecdn.com/559c8e84-fc0e-4ba0-b256-087244fa88db-150716121440-lva1-app6892/85/LFC-Case-Study-42-320.jpg)
![43
Premier League Survey. (2012) Premier League Fan Survey – Research and Insight Season 2011/12. .
[Online] [Accessed on 14th October 2014] http://fansurvey.premierleague.com
Premier League. (2013x). 2013 Asia Cup Trophy Line Up Announced. Available:
http://www.premierleague.com/en-gb/news/news/2012-13/mar/2013-barclays-asia-trophy-
announced.html. [online] [Accessed 22nd January 2015].
Real Madrid ([no date]a) International Madridistas [Online] [Accessed on 6th
January 2015]
http://www.realmadrid.com/en/fans/madridistas/international
Real Madrid ([no date]b) Realmadrid TV [Online] [Accessed on 6th
January 2015]
http://www.realmadrid.com/en/fans/real-madrid-tv
Real Madrid (2014) Real Madrid 2013-14 Annual Report. [Online] [Accessed on 15th
December 2014]
http://www.realmadrid.com/cs/Satellite?blobcol=urldata&blobheader=application%2Fpdf&blobkey=id&blo
btable=MungoBlobs&blobwhere=1203349468675&ssbinary=true
Repucom (2014a) World Football - full report [Online] [Accessed on 17th October 2014]
http://repucom.net/media/world-football
Repucom. (2014b). European Football Kit Supplier Report Online. Available:
http://repucom.net/reports/european-football-kit-supplier-report-2014. [online] [Accessed 19th November
2014].
Reynolds, C. (2014) ‘Chelsea announce plans that could lead to Stamford Bridge expansion.’ The
Independent [Online] 18th
June [Accessed on 6th
January 2015]
http://www.independent.co.uk/sport/football/premier-league/chelsea-announce-plans-that-could-lead-to-
stamford-bridge-expansion-9545508.html
Reynolds, J. (2013) Liverpool FC's Wi-Fi woes show football clubs are still struggling with unproven
technology. The Drum [Online] [Accessed on 6th
January 2015]
http://www.thedrum.com/opinion/2013/10/18/liverpool-fcs-wi-fi-woes-show-football-clubs-are-still-
struggling-unproven
Ritson, M. (2014) There’s only one Man Utd but several Manchester Cities. Marketing Week [Online]
[Accessed on 10th
January 2015] http://www.marketingweek.com/2014/08/20/theres-only-one-man-utd-
but-several-manchester-cities/
Rogers, P. (2013) England's greatest club – Infographic. Liverpool Football Club [Online] [Accessed on
15th
January 2015] http://www.liverpoolfc.com/news/latest-news/151404-england-s-greatest-club-
infographic
Savage, R. (2013). Robbie Savage reveals footballers' tricks to engineer a transfer. [Online] [Accessed
16th
Jan 2015] http://www.bbc.co.uk/sport/0/football/23703265
Savage, R. (2014) Liverpool signings by Brendan Rodgers - hits or misses? BBC Sport [Online]
[Accessed on 15th
January 2015] http://www.bbc.co.uk/sport/0/football/30516598
Sedghi, A. and Arnett, G. (2014) ‘The world's best footballers in 2014: by nationality, leagues and clubs.’
The Guardian. [Online] 24th
December [Accessed on 10th
January 2015]
http://www.theguardian.com/football/datablog/2014/dec/24/the-worlds-best-footballers-in-2014-by-
nationality-leagues-and-clubs
Smith, A (2013) Wealthy foreign investors in Premier League Clubs want more value for their buck
[Online] [Accessed 7th
January 2015] http://www.telegraph.co.uk/sport/football/teams/cardiff-
city/10540074/Wealthy-foreign-investors-in-Premier-League-clubs-want-more-value-for-their-buck.html
Smith, B. (2013) Steven Gerrard: Liverpool captain set for LA Galaxy move. BBC Sport [Online]
[Accessed on 15th
January 2015] http://www.bbc.co.uk/sport/0/football/30700069](https://image.slidesharecdn.com/559c8e84-fc0e-4ba0-b256-087244fa88db-150716121440-lva1-app6892/85/LFC-Case-Study-43-320.jpg)
![44
Stewart, H (2015) Interest rate delay and living standard rise good news for George Osborne. [Online]
[Accessed on 20h
January 2015] http://www.theguardian.com/business/2015/jan/21/interest-rate-living-
standard-george-osborne-economics
Tapp. A. & Clowes., J (2002) ‘From “Carefree Casuals” to “Proffessional Wanderers”: Segmentation
possibilities for football supporters.’ European Journal of Marketing. Vol. 36. Issue 11/12
Taylor, D. (2011). Manchester City bank record £400m sponsorship deal with Etihad Airways. Available:
http://www.theguardian.com/football/2011/jul/08/manchester-city-deal-etihad-airways. [online] [Accessed
28th November 2014].
The Economist. (2011). Little Red Card: China and Hong Kong football industries. Available:
http://www.economist.com/node/21541716. [online] [Accessed 22nd January 2015].
The Guardian (2014) ‘Liverpool to be investigated by Uefa over alleged breach of FFP rules.’ The
Guardian. [Online] 25th
September [Accessed on 10th
January 2015]
http://www.theguardian.com/football/2014/sep/25/liverpool-investigated-ffp-uefa-monaco
The Guardian (2014a) Online shopping on mobiles overtakes desktop for first time. [Accessed on 10th
December 2014] http://www.theguardian.com/business/2014/sep/02/online-shopping-mobiles-overtakes-
desktop
Tottenham Hotspur ([no date]a) History of White Hart Lane [Online] [Accessed on 6th
January 2015]
http://www.tottenhamhotspur.com/the-stadium/history/
Tottenham Hotspur ([no date]b) Join the club [Online] [Accessed on 6th
January 2015]
http://www.tottenhamhotspur.com/uploadedFiles/Shared_Assets/Documents/Membership/Adult-
Membership-Graphic.pdf
Tottenham Hotspur ([no date]c) Spurs TV. [Online] [Accessed on 6th
January 2015]
http://www.tottenhamhotspur.com/spurs-tv/ipb-broadcasters/
TripAdvisor ([no date]a) Bernabeu stadium (Estadio Santiago Bernabeu). [Online] [Accessed on 8th
January 2015] http://www.tripadvisor.co.uk/Attraction_Review-g187514-d796251-Reviews-
Bernabeu_Stadium_Estadio_Santiago_Bernabeu-Madrid.html
TripAdvisor ([no date]b) Camp Nou. [Online] [Accessed on 8th
January 2015]
http://www.tripadvisor.co.uk/Attraction_Review-g187497-d271009-Reviews-Camp_Nou-
Barcelona_Catalonia.html
TripAdvisor ([no date]c) Allianz Arena. [Online] [Accessed on 8th
January 2015]
http://www.tripadvisor.co.uk/Attraction_Review-g187309-d594437-Reviews-Allianz_Arena-
Munich_Upper_Bavaria_Bavaria.html
TripAdvisor ([no date]d) Old Trafford. [Online] [Accessed on 8th
January 2015]
http://www.tripadvisor.co.uk/Attraction_Review-g1020874-d2263052-Reviews-Old_Trafford-
Trafford_Greater_Manchester_England.html
TripAdvisor ([no date]e) Etihad stadium. [Online] [Accessed on 8th
January 2015]
http://www.tripadvisor.co.uk/Attraction_Review-g187069-d4302956-Reviews-Etihad_Stadium-
Manchester_Greater_Manchester_England.html
TripAdvisor ([no date]f) Stamford Bridge stadium. [Online] [Accessed on 8th
January 2015]
http://www.tripadvisor.co.uk/Attraction_Review-g186338-d6426418-Reviews-Stamford_Bridge_Stadium-
London_England.html
TripAdvisor ([no date]g) Emirates stadium. [Online] [Accessed on 8th
January 2015]
http://www.tripadvisor.co.uk/Attraction_Review-g186338-d1056442-Reviews-Emirates_Stadium-
London_England.html](https://image.slidesharecdn.com/559c8e84-fc0e-4ba0-b256-087244fa88db-150716121440-lva1-app6892/85/LFC-Case-Study-44-320.jpg)
![45
TripAdvisor ([no date]h) Anfield stadium. [Online] [Accessed on 8th
January 2015]
http://www.tripadvisor.co.uk/Attraction_Review-g186337-d999329-Reviews-Anfield_Stadium-
Liverpool_Merseyside_England.html
TripAdvisor ([no date]i) White Hart Lane. [Online] [Accessed on 8th
January 2015]
http://www.tripadvisor.co.uk/Attraction_Review-g186338-d6426421-Reviews-White_Hart_Lane-
London_England.html
UEFA. (2010). FFP Regulations. [Online] [Accessed 13th
January 2015]
http://www.uefa.com/MultimediaFiles/Download/Tech/uefaorg/General/01/50/09/12/1500912_DOWNLO
AD.pdf.
Walmsley, D (2014) Football – UK – November 2014 [Online] [Accessed: 25th
Jan 2015]
http://reports.mintel.com/display/679670/
White, D. (2011) ‘Manchester City plan for bigger stadium.’ The Telegraph [Online] 22nd
October
[Accessed on 6th
January 2015] http://www.telegraph.co.uk/sport/football/teams/manchester-
city/8843970/Manchester-City-plan-for-bigger-stadium.html
Wilson, B. (2009). Premier League Giants Target India. Available:
http://news.bbc.co.uk/1/hi/business/8083210.stm. [online] [Accessed 22nd January 2015].
Wilson, R.M.S and Gilligan, C. (2005) Strategic Marketing Management: Planning, Implementation &
Control. 3rd
Ed., Oxford: Butterworth-Heinemann
World Bank. (2014a). World Population Figures. Available:
http://data.worldbank.org/indicator/SP.POP.TOTL. [online] [Accessed 15th December 2014].
World Bank. (2014b). 5 Year GDP Figures. Available:
http://data.worldbank.org/indicator/NY.GDP.MKTP.CD. [online] [Accessed 15th December 2014].
World Bank. (2014c). UK Data Analysis. Available: http://data.worldbank.org/country/united-kingdom.
[online] [Accessed 15th December 2014].
World Bank. (2014d). Worldwide GDP per Capita. Available:
http://data.worldbank.org/indicator/NY.GDP.PCAP.CD. [online] [Accessed 20th January 2015].
Zolfagharifard, Z (2015) Global warming believers are like a hysterical ‘cult’: MIT scientist compares
‘climate alarmists’ to religious fanatics [Accessed on 1st January 2015]
http://www.dailymail.co.uk/sciencetech/article-2922553/Global-warming-believers-like-hysterical-cult-
MIT-scientist-compares-climate-alarmists-religious-fanatics.html](https://image.slidesharecdn.com/559c8e84-fc0e-4ba0-b256-087244fa88db-150716121440-lva1-app6892/85/LFC-Case-Study-45-320.jpg)


![52
Tottenham Hotspur 36,029 36,026 35,703 35,794 35,928 35,896
*Sources: ESPN FC ([no date]a), ESPN FC ([no date]b), ESPN FC ([no date]c), ESPN FC ([no date]d), ESPN FC
([no date]e), ESPN FC ([no date]f), ESPN FC ([no date]g), ESPN FC ([no date]h), ESPN FC ([no date]i),
Average Top 100 players (Sedghi
and Arnett, 2014)
Club 2014 2013 2012
Average
Top 100
players
Real Madrid 9 9 10 9
FC Barcelona 10 11 12 11
Bayem Munich 12 11 10 11
Manchester United 6 4 5 5
Manchester City 6 6 8 7
Chelsea 9 8 8 8
Arsenal 4 4 1 3
Liverpool 3 1 1 2
Tottenham Hotspur 1 3 2 2
Average adult membership
Club Adult
Membership
prices
Average adult
membership price
Euro to GBP
(conversion rate
0.781302 on 9th
Jan 2015)
Real Madrid 30-65 euros € 47.50 £37.11
FC Barcelona 177 euros € 177.00 £138.26
Bayem Munich 40-60 euros € 50.00 £39.05
Manchester United £32.00 £32.00 £32.00
Manchester City £35.00 £35.00 £35.00
Chelsea 25-45 £35.00 £35.00
Arsenal 34-39 £36.50 £36.50
Liverpool 26.99-43.99 £35.49 £35.49
Tottenham Hotspur 42-57 £49.50 £49.50
*Sources: Real Madrid ([no date]a), FC Barcelona ([no date]b), FC Bayern Forum (no date),
Manchester United ([no date]b), Manchester City ([no date]b), Chelsea FC ([no date]b),
Arsenal ([no date]b), Liverpool FC ([no date]g), Tottenham Hotspur ([no date]b).](https://image.slidesharecdn.com/559c8e84-fc0e-4ba0-b256-087244fa88db-150716121440-lva1-app6892/85/LFC-Case-Study-52-320.jpg)
![53
Appendix 2: Club accessibility
Club
Domestic
TV
subscripti
on
Dome
s-tic
TV
subscr
-iption
rating
Overseas
TV
subscripti
on
Overs-
eas TV
subscr
-iption
rating
On-
demand
subscripti
on
On-
deman
d
subscri
-ption
rating
Free
videos
and
highlig
-hts
Free
video
s and
highli
-ghts
rating
Total
rates
Real Madrid Yes (price
not known) 1 No 0 No 0 Yes 1 2
FC Barcelona Yes (price
not known) 1 No 0 No 0 Yes 1 2
Bayem Munich
No 0 No 0
Yes - 4
EUR 1 Yes 1 2
Manchester United
Yes - £6 1
Yes (some
countries) 1 No 0 Yes 1 3
Manchester City No 0 No 0 No 0 Yes 1 1
Chelsea
Yes - £6 1
Yes (some
countries) 1
Yes -
£5.99 1 Yes 1 4
Arsenal
No 0 No 0
Yes -
£3.99 1 Yes 1 2
Liverpool Yes - £7 1 No 0
Yes -
£4.99 1 Yes 1 3
Tottenham Hotspur No 0
Yes (some
countries) 1
Yes -
FREE 2 Yes 1 4
*Sources: Real Madrid ([no date]b), Barca TV (no date), FC Bayern (no date), Manchester United ([no
date]c), Manchester City ([no date]c), Chelsea FC ([no date]c), Arsenal (2011), Liverpool FC ([no date]h),
Tottenham Hotspur ([no date]c)](https://image.slidesharecdn.com/559c8e84-fc0e-4ba0-b256-087244fa88db-150716121440-lva1-app6892/85/LFC-Case-Study-53-320.jpg)
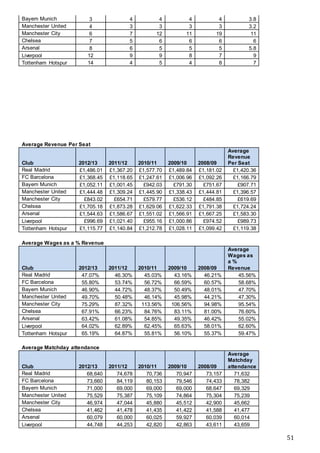
![54
Appendix 3: TripAdvisor ratings (stadium visits)- accessed 8th January 2015
Club and stadium
Total
number
of
reviews
Total
number
of
'Excellent'
reviews
Total
number
of 'Very
good'
reviews
Total
number
of
'Average'
reviews
Total
number
of 'Poor'
reviews
Total
number
of
'Terrible'
reviews
Percentage
of
'excellent'
ratings
Real Madrid
(Bernabeu) 4,466 2,926 1,155 298 45 42 66%
FC Barcelona (Camp
Nou) 8,342 5,052 2,292 754 170 74 61%
Bayem Munich
(Allianz) 1,869 1,091 570 156 38 14 58%
Manchester United
(Old Trafford) 608 469 105 21 5 8 77%
Manchester City
(Etihad) 431 284 100 21 11 15 66%
Chelsea (Stamford
Bridge) 119 78 27 10 4 0 65%
Arsenal (Emirates) 742 523 170 30 8 11 70%
Liverpool (Anfield) 1,526 1,202 222 55 18 29 79%
Tottenham Hotspur
(White Hart Lane) 45 24 15 4 1 1 53%
*Sources: TripAdvisor ([no date]a), TripAdvisor ([no date]b), TripAdvisor ([no date]c), TripAdvisor ([no date]d),
TripAdvisor ([no date]e), TripAdvisor ([no date]f), TripAdvisor ([no date]g), TripAdvisor ([no date]h), TripAdvisor ([no
date]i)](https://image.slidesharecdn.com/559c8e84-fc0e-4ba0-b256-087244fa88db-150716121440-lva1-app6892/85/LFC-Case-Study-54-320.jpg)