1. PORTFOLIO PUMPING IS NOT
AS RAMPANT AS COMMONLY PERCEIVED
IN THE BROAD MARKET
POTENTIAL PORTFOLIO PUMPING
REPORT FINDINGS:
• Dispelled misconception that portfolio pumping is rampant in Singapore, contrary to the broader market assumption
• Showed that appropriate regulatory framework and structures in place have played a critical role in deterring market manipulation
• Found at certain segmented market level, some degree of potential portfolio pumping, though they are not statistically significant
• Identified common traits among stocks which are potential subject of portfolio pumping
A study that analyses tick-by-tick data from January 2003
to December 2013 from the Singapore Stock Exchange
to gain insight into the degree of market manipulation
that was prevalent. The study was in response to the
2010 successful prosecution of a fund manager involving
portfolio pumping in Singapore.
Market manipulation
is the deliberate attempt to
interfere with free and fair
market operation and involves
the act of artificially inflating or
deflating the price of a security.
Window dressing occurs
when poorly performing stocks in
the portfolio are sold and replaced
with well-performing stocks,
in order to present a favorable
picture of the portfolio for the fund
manager for its annual report.
Portfolio pumping occurs
with the intent of manipulating
the prices of the chosen stocks to
increase the closing prices around a
reference period (usually at quarter-
ends and year-ends). For such
stocks to be considered “pumped”,
their prices should subsequently fall
when the activity ceases, i.e. these
stocks should return to their market
equilibrium prices once the artificial
inflation of stock prices ends.
Our two-day inflation* metric shows no definitive evidence of portfolio pumping
either at a quarter or yearly level for the market overall. In the presence of
pumping and subsequent reversal, the metric is expected to be positive. But, it
remains largely negative, especially in the second half.
Using reverse engineering and adopting a gaming proxy*
, findings revealed
some stocks which may have potential to be subject to portfolio pumping.
* Two-day Inflation metric represents the difference in returns between two consecutive trading days.
In the event of portfolio pumping, we would expect a strong positive return on the last day of the quarter
and a strong negative return on the beginning day of the next quarter, thereby making the two-day infla-
tion metric significantly positive.
* Gaming proxy assumes a value of 1 if absolute and excess (relative to FTSE STI) returns on the last
trading day of a quarter is greater than zero and absolute and excess returns on the first trading day of
the subsequent quarter is negative.
Stocks with potential to be subject to Portfolio Pumping:
• Mid-cap segment, especially those within the S$2-5 billion range
• Lower free float liquidity
• Not constituents of the SIMSCI
• Significantly higher degree of buyer-initiated trades
• Greater proportions of trades in the final 30 minutes of a quarter-end trading day
• S-chip stocks
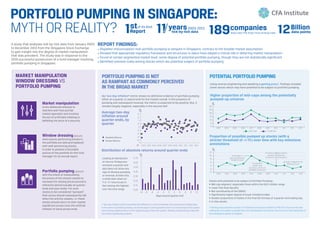
Average two-day
inflation around
quarter-ends, by
quarter
Distribution of absolute returns around quarter ends
Proportion of possible pumped up stocks (with a
stricter threshold of +/-1%) over time with key milestone
annotations
Higher proportion of mid-caps among the potentially
pumped-up universe
Excess Returns
Absolute Returns
MARKET MANIPULATION
WINDOW DRESSING VS
PORTFOLIO PUMPING
Looking at distribution
of returns 10 days pre-
and post a quarter-end
also does not show any
sign of obvious pumping
or reversal, at best only
a small slow-down on
T+3. T+1 returns are in
fact among the highest
over the time range.
%
Days around quarter end
Q1
0
%
-2
-1
1
2
3
-3
-4
-5