
Recommended
More Related Content
Similar to Orange Text Analytics Workshop Hands-On Guide
Similar to Orange Text Analytics Workshop Hands-On Guide (20)
More from Akuhuruf
More from Akuhuruf (20)
Recently uploaded
Recently uploaded (20)
Orange Text Analytics Workshop Hands-On Guide
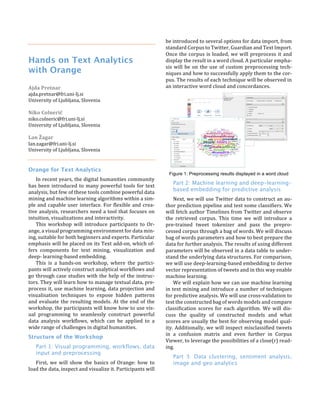
- 1. Hands on Text Analytics with Orange Ajda Pretnar ajda.pretnar@fri.uni-lj.si University of Ljubljana, Slovenia Niko Colnerič niko.colneric@fri.uni-lj.si University of Ljubljana, Slovenia Lan Žagar lan.zagar@fri.uni-lj.si University of Ljubljana, Slovenia Orange for Text Analytics In recent years, the digital humanities community has been introduced to many powerful tools for text analysis, but few of these tools combine powerful data mining and machine learning algorithms within a sim- ple and capable user interface. For flexible and crea- tive analysis, researchers need a tool that focuses on intuition, visualizations and interactivity. This workshop will introduce participants to Or- ange, a visual programming environment for data min- ing, suitable for both beginners and experts. Particular emphasis will be placed on its Text add-on, which of- fers components for text mining, visualization and deep- learning-based embedding. This is a hands-on workshop, where the partici- pants will actively construct analytical workflows and go through case studies with the help of the instruc- tors. They will learn how to manage textual data, pre- process it, use machine learning, data projection and visualisation techniques to expose hidden patterns and evaluate the resulting models. At the end of the workshop, the participants will know how to use vis- ual programming to seamlessly construct powerful data analysis workflows, which can be applied to a wide range of challenges in digital humanities. Structure of the Workshop Part 1: Visual programming, workflows, data input and preprocessing First, we will show the basics of Orange: how to load the data, inspect and visualize it. Participants will be introduced to several options for data import, from standard Corpus to Twitter, Guardian and Text Import. Once the corpus is loaded, we will preprocess it and display the result in a word cloud. A particular empha- sis will be on the use of custom preprocessing tech- niques and how to successfully apply them to the cor- pus. The results of each technique will be observed in an interactive word cloud and concordances. Figure 1: Preprocessing results displayed in a word cloud Part 2: Machine learning and deep-learning- based embedding for predictive analysis Next, we will use Twitter data to construct an au- thor prediction pipeline and test some classifiers. We will fetch author Timelines from Twitter and observe the retrieved corpus. This time we will introduce a pre-trained tweet tokenizer and pass the prepro- cessed corpus through a bag of words. We will discuss bag of words parameters and how to best prepare the data for further analysis. The results of using different parameters will be observed in a data table to under- stand the underlying data structures. For comparison, we will use deep-learning-based embedding to derive vector representation of tweets and in this way enable machine learning. We will explain how we can use machine learning in text mining and introduce a number of techniques for predictive analysis. We will use cross-validation to test the constructed bag of words models and compare classification scores for each algorithm. We will dis- cuss the quality of constructed models and what scores are usually the best for observing model qual- ity. Additionally, we will inspect misclassified tweets in a confusion matrix and even further in Corpus Viewer, to leverage the possibilities of a close(r) read- ing. Part 3: Data clustering, sentiment analysis, image and geo analytics
- 2. In the third part, we will work on geomapping and image analytics. We will transform textual and visual data into feature vectors and plot these data onto a world map to discover interesting relations. We will discuss how to acquire geolocated data from Twitter and why this is useful. Next, we will use geotagged Twitter data and apply a pre-trained senti- ment analysis model to acquire sentiment orientation. We will map the sentiment-tagged tweets and explore how to use sentiment together with geomapping. Finally, the participants will be introduced to image analytics for humanities research. We will explain why and how to transform raw images into multidimen- sional vectors and how to work with the new data. We will cluster Instagram images into groups and explore how to map image-containing tweets on a world map. Do images correspond to geolocation? We will see. Figure 2: Images from social media are embedded with ImageNet embedding, clustered with Hierarchical Clustering and displayed on a map by their geolocation.