1. 7. COOLING TOWER
135
Bureau of Energy Efficiency
Syllabus
Cooling Tower: Types and performance evaluation, Efficient system operation, Flow
control strategies and energy saving opportunities, Assessment of cooling towers
7.1 Introduction
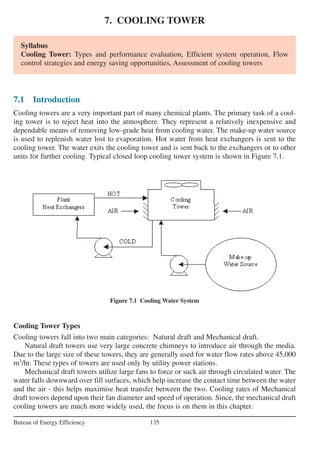
Cooling towers are a very important part of many chemical plants. The primary task of a cool-
ing tower is to reject heat into the atmosphere. They represent a relatively inexpensive and
dependable means of removing low-grade heat from cooling water. The make-up water source
is used to replenish water lost to evaporation. Hot water from heat exchangers is sent to the
cooling tower. The water exits the cooling tower and is sent back to the exchangers or to other
units for further cooling. Typical closed loop cooling tower system is shown in Figure 7.1.
Cooling Tower Types
Cooling towers fall into two main categories: Natural draft and Mechanical draft.
Natural draft towers use very large concrete chimneys to introduce air through the media.
Due to the large size of these towers, they are generally used for water flow rates above 45,000
m3
/hr. These types of towers are used only by utility power stations.
Mechanical draft towers utilize large fans to force or suck air through circulated water. The
water falls downward over fill surfaces, which help increase the contact time between the water
and the air - this helps maximise heat transfer between the two. Cooling rates of Mechanical
draft towers depend upon their fan diameter and speed of operation. Since, the mechanical draft
cooling towers are much more widely used, the focus is on them in this chapter.
Figure 7.1 Cooling Water System
2. Mechanical draft towers
Mechanical draft towers are available in the following airflow arrangements:
1. Counter flows induced draft.
2. Counter flow forced draft.
3. Cross flow induced draft.
In the counter flow induced draft design, hot water enters at the top, while the air is intro-
duced at the bottom and exits at the top. Both forced and induced draft fans are used.
In cross flow induced draft towers, the water enters at the top and passes over the fill. The
air, however, is introduced at the side either on one side (single-flow tower) or opposite sides
(double-flow tower). An induced draft fan draws the air across the wetted fill and expels it
through the top of the structure.
The Figure 7.2 illustrates various cooling tower types. Mechanical draft towers are avail-
able in a large range of capacities. Normal capacities range from approximately 10 tons,
2.5 m3
/hr flow to several thousand tons and m3
/hr. Towers can be either factory built or field
erected - for example concrete towers are only field erected.
Many towers are constructed so that they can be grouped together to achieve the desired
capacity. Thus, many cooling towers are assemblies of two or more individual cooling
towers or "cells." The number of cells they have, e.g., an eight-cell tower, often refers to
such towers. Multiple-cell towers can be lineal, square, or round depending upon the shape
of the individual cells and whether the air inlets are located on the sides or bottoms of the
cells.
Components of Cooling Tower
The basic components of an evaporative tower are: Frame and casing, fill, cold water basin,
drift eliminators, air inlet, louvers, nozzles and fans.
Frame and casing: Most towers have structural frames that support the exterior enclosures
(casings), motors, fans, and other components. With some smaller designs, such as some glass
fiber units, the casing may essentially be the frame.
Fill: Most towers employ fills (made of plastic or wood) to facilitate heat transfer by maximis-
ing water and air contact. Fill can either be splash or film type.
With splash fill, water falls over successive layers of horizontal splash bars, continuously
breaking into smaller droplets, while also wetting the fill surface. Plastic splash fill promotes
better heat transfer than the wood splash fill.
Film fill consists of thin, closely spaced plastic surfaces over which the water spreads, form-
ing a thin film in contact with the air. These surfaces may be flat, corrugated, honeycombed, or
other patterns. The film type of fill is the more efficient and provides same heat transfer in a
smaller volume than the splash fill.
Cold water basin: The cold water basin, located at or near the bottom of the tower, receives
the cooled water that flows down through the tower and fill. The basin usually has a sump or
low point for the cold water discharge connection. In many tower designs, the cold water basin
is beneath the entire fill.
7. Cooling Tower
136
Bureau of Energy Efficiency
3. In some forced draft counter flow design, however, the water at the bottom of the fill is
channeled to a perimeter trough that functions as the cold water basin. Propeller fans are mount-
ed beneath the fill to blow the air up through the tower. With this design, the tower is mounted
on legs, providing easy access to the fans and their motors.
7. Cooling Tower
137
Bureau of Energy Efficiency
Figure 7.2 Cooling Tower Types
4. Drift eliminators: These capture water droplets entrapped in the air stream that otherwise
would be lost to the atmosphere.
Air inlet: This is the point of entry for the air entering a tower. The inlet may take up an entire
side of a tower–cross flow design– or be located low on the side or the bottom of counter flow
designs.
Louvers: Generally, cross-flow towers have inlet louvers. The purpose of louvers is to equal-
ize air flow into the fill and retain the water within the tower. Many counter flow tower designs
do not require louvers.
Nozzles: These provide the water sprays to wet the fill. Uniform water distribution at the top of
the fill is essential to achieve proper wetting of the entire fill surface. Nozzles can either be
fixed in place and have either round or square spray patterns or can be part of a rotating assem-
bly as found in some circular cross-section towers.
Fans: Both axial (propeller type) and centrifugal fans are used in towers. Generally, propeller
fans are used in induced draft towers and both propeller and centrifugal fans are found in forced
draft towers. Depending upon their size, propeller fans can either be fixed or variable pitch.
Afan having non-automatic adjustable pitch blades permits the same fan to be used over a wide
range of kW with the fan adjusted to deliver the desired air flow at the lowest power consumption.
Automatic variable pitch blades can vary air flow in response to changing load conditions.
Tower Materials
In the early days of cooling tower manufacture, towers were constructed primarily of wood.
Wooden components included the frame, casing, louvers, fill, and often the cold water basin. If
the basin was not of wood, it likely was of concrete.
Today, tower manufacturers fabricate towers and tower components from a variety of mate-
rials. Often several materials are used to enhance corrosion resistance, reduce maintenance, and
promote reliability and long service life. Galvanized steel, various grades of stainless steel,
glass fiber, and concrete are widely used in tower construction as well as aluminum and vari-
ous types of plastics for some components.
Wood towers are still available, but they have glass fiber rather than wood panels (casing)
over the wood framework. The inlet air louvers may be glass fiber, the fill may be plastic, and
the cold water basin may be steel.
Larger towers sometimes are made of concrete. Many towers–casings and basins–are con-
structed of galvanized steel or, where a corrosive atmosphere is a problem, stainless steel.
Sometimes a galvanized tower has a stainless steel basin. Glass fiber is also widely used for
cooling tower casings and basins, giving long life and protection from the harmful effects of
many chemicals.
Plastics are widely used for fill, including PVC, polypropylene, and other polymers. Treated
wood splash fill is still specified for wood towers, but plastic splash fill is also widely used
when water conditions mandate the use of splash fill. Film fill, because it offers greater heat
transfer efficiency, is the fill of choice for applications where the circulating water is generally
free of debris that could plug the fill passageways.
7. Cooling Tower
138
Bureau of Energy Efficiency
5. Plastics also find wide use as nozzle materials. Many nozzles are being made of PVC, ABS,
polypropylene, and glass-filled nylon. Aluminum, glass fiber, and hot-dipped galvanized steel are
commonly used fan materials. Centrifugal fans are often fabricated from galvanized steel.
Propeller fans are fabricated from galvanized, aluminum, or moulded glass fiber reinforced plas-
tic.
7.2 Cooling Tower Performance
7. Cooling Tower
139
Bureau of Energy Efficiency
Figure 7.3 Range and Approach
The important parameters, from the point of determining the performance of cooling towers, are:
i) "Range" is the difference between the cooling tower water inlet and outlet temperature.
(See Figure 7.3).
ii) "Approach" is the difference between the cooling tower outlet cold water temperature
and ambient wet bulb temperature. Although, both range and approach should be moni-
tored, the 'Approach' is a better indicator of cooling tower performance. (see Figure 7.3).
iii) Cooling tower effectiveness (in percentage) is the ratio of range, to the ideal range, i.e.,
difference between cooling water inlet temperature and ambient wet bulb temperature,
or in other words it is = Range / (Range + Approach).
iv) Cooling capacity is the heat rejected in kCal/hr or TR, given as product of mass flow
rate of water, specific heat and temperature difference.
v) Evaporation loss is the water quantity evaporated for cooling duty and, theoretically, for
every 10,00,000 kCal heat rejected, evaporation quantity works out to 1.8 m3
. An empir-
ical relation used often is:
*Evaporation Loss (m3
/hr) = 0.00085 x 1.8 x circulation rate (m3
/hr) x (T1-T2)
T1-T2 = Temp. difference between inlet and outlet water.
*Source: Perry’s Chemical Engineers Handbook (Page: 12-17)
6. vi) Cycles of concentration (C.O.C) is the ratio of dissolved solids in circulating water to
the dissolved solids in make up water.
vii) Blow down losses depend upon cycles of concentration and the evaporation losses and
is given by relation:
Blow Down = Evaporation Loss / (C.O.C. – 1)
viii) Liquid/Gas (L/G) ratio, of a cooling tower is the ratio between the water and the air mass
flow rates. Against design values, seasonal variations require adjustment and tuning of
water and air flow rates to get the best cooling tower effectiveness through measures
like water box loading changes, blade angle adjustments.
Thermodynamics also dictate that the heat removed from the water must be equal to the
heat absorbed by the surrounding air:
where:
L/G = liquid to gas mass flow ratio (kg/kg)
T1 = hot water temperature (°C)
T2 = cold water temperature (°C)
h2 = enthalpy of air-water vapor mixture at exhaust wet-bulb temperature
(same units as above)
h1 = enthalpy of air-water vapor mixture at inlet wet-bulb temperature (same
units as above)
Factors Affecting Cooling Tower Performance
Capacity
Heat dissipation (in kCal/hour) and circulated flow rate (m3
/hr) are not sufficient to understand
cooling tower performance. Other factors, which we will see, must be stated along with flow
rate m3
/hr. For example, a cooling tower sized to cool 4540 m3
/hr through a 13.9°C range might
be larger than a cooling tower to cool 4540 m3
/hr through 19.5°C range.
Range
Range is determined not by the cooling tower, but by the process it is serving. The range at the
exchanger is determined entirely by the heat load and the water circulation rate through the
exchanger and on to the cooling water.
Range °C = Heat Load in kcals/hour / Water Circulation Rate in LPH
Thus, Range is a function of the heat load and the flow circulated through the system.
L(T1 –T2) = G(h2 – h1)
L
=
h2 – h1
G T1– T2
7. Cooling Tower
140
Bureau of Energy Efficiency
7. Cooling towers are usually specified to cool a certain flow rate from one temperature
to another temperature at a certain wet bulb temperature. For example, the cooling
tower might be specified to cool 4540 m3
/hr from 48.9°C to 32.2°C at 26.7°C wet bulb
temperature.
Cold Water Temperature 32.2°C – Wet Bulb Temperature (26.7°C) = Approach (5.5°C)
As a generalization, the closer the approach to the wet
bulb, the more expensive the cooling tower due to increased
size. Usually a 2.8°C approach to the design wet bulb is
the coldest water temperature that cooling tower manufac-
turers will guarantee. If flow rate, range, approach and wet
bulb had to be ranked in the order of their importance in
sizing a tower, approach would be first with flow rate closely
following the range and wet bulb would be of lesser
importance.
Heat Load
The heat load imposed on a cooling tower is determined by the process being served. The
degree of cooling required is controlled by the desired operating temperature level of the
process. In most cases, a low operating temperature is desirable to increase process efficiency
or to improve the quality or quantity of the product. In some applications (e.g. internal com-
bustion engines), however, high operating temperatures are desirable. The size and cost of the
cooling tower is proportional to the heat load. If heat load calculations are low undersized
equipment will be purchased. If the calculated load is high, oversize and more costly, equipment
will result.
Process heat loads may vary considerably depending upon the process involved.
Determination of accurate process heat loads can become very complex but proper considera-
tion can produce satisfactory results. On the other hand, air conditioning and refrigeration heat
loads can be determined with greater accuracy.
Information is available for the heat rejection requirements of various types of power equip-
ment. A sample list is as follows:
* Air Compressor
- Single-stage - 129 kCal/kW/hr
- Single-stage with after cooler - 862 kCal/kW/hr
- Two-stage with intercooler - 518 kCal/kW/hr
- Two-stage with intercooler and after cooler - 862 kCal/kW/hr
* Refrigeration, Compression - 63 kCal/min/TR
* Refrigeration, Absorption - 127 kCal/min/TR
* Steam Turbine Condenser - 555 kCal/kg of
steam
* Diesel Engine, Four-Cycle, Supercharged - 880 kCal/kW/hr
* Natural Gas Engine, Four-cycle - 1523 kCal/kW/hr
(18 kg/cm2
compression)
7. Cooling Tower
141
Bureau of Energy Efficiency
8. Wet Bulb Temperature
Wet bulb temperature is an important factor in performance of evaporative water cooling equip-
ment. It is a controlling factor from the aspect of minimum cold water temperature to which
water can be cooled by the evaporative method. Thus, the wet bulb temperature of the air enter-
ing the cooling tower determines operating temperature levels throughout the plant, process, or
system. Theoretically, a cooling tower will cool water to the entering wet bulb temperature,
when operating without a heat load. However, a thermal potential is required to reject heat, so
it is not possible to cool water to the entering air wet bulb temperature, when a heat load is
applied. The approach obtained is a function of thermal conditions and tower capability.
Initial selection of towers with respect to design wet bulb temperature must be made on the
basis of conditions existing at the tower site. The temperature selected is generally close to the
average maximum wet bulb for the summer months. An important aspect of wet bulb selection
is, whether it is specified as ambient or inlet. The ambient wet bulb is the temperature, which
exists generally in the cooling tower area, whereas inlet wet bulb is the wet bulb temperature of
the air entering the tower. The later can be, and often is, affected by discharge vapours being
recirculated into the tower. Recirculation raises the effective wet bulb temperature of the air
entering the tower with corresponding increase in the cold water temperature. Since there is no
initial knowledge or control over the recirculation factor, the ambient wet bulb should be spec-
ified. The cooling tower supplier is required to furnish a tower of sufficient capability to absorb
the effects of the increased wet bulb temperature peculiar to his own equipment.
It is very important to have the cold water temperature low enough to exchange heat or to
condense vapours at the optimum temperature level. By evaluating the cost and size of heat
exchangers versus the cost and size of the cooling tower, the quantity and temperature of the
cooling tower water can be selected to get the maximum economy for the particular process.
The Table 7.1 illustrates the effect of approach on the size and cost of a cooling tower. The
towers included were sized to cool 4540 m3
/hr through a 16.67°C range at a 26.7°C design wet
bulb. The overall width of all towers is 21.65 meters; the overall height, 15.25 meters, and the
pump head, 10.6 m approximately.
7. Cooling Tower
142
Bureau of Energy Efficiency
TABLE 7.1 APPROACH VS. COOLING TOWER SIZE (4540 m3
/hr; 16.67°C
Range 26.7°C Wet Bulb; 10.7 m Pump Head)
Approach °C 2.77 3.33 3.88 4.44 5.0 5.55
Hot Water °C 46.11 46.66 47.22 47.77 48.3 48.88
Cold Water °C 29.44 30 30.55 31.11 31.66 32.22
No. of Cells 4 4 3 3 3 3
Length of Cells Mts. 10.98 8.54 10.98 9.76 8.54 8.54
Overall Length Mts. 43.9 34.15 32.93 29.27 25.61 25.61
No. of Fans 4 4 3 3 3 3
Fan Diameter Mts. 7.32 7.32 7.32 7.32 7.32 6.71
Total Fan kW 270 255 240 202.5 183.8 183.8
9. Approach and Flow
Suppose a cooling tower is installed that is 21.65 m wide × 36.9 m long × 15.24m high, has
three 7.32 m diameter fans and each powered by 25 kW motors. The cooling tower cools from
3632 m3
/hr water from 46.1°C to 29.4°C at 26.7°C WBT dissipating 60.69 million kCal/hr.
The Table 7.2 shows what would happen with additional flow but with the range remaining
constant at 16.67°C. The heat dissipated varies from 60.69 million kCal/hr to 271.3 million
kCal/hr.
7. Cooling Tower
143
Bureau of Energy Efficiency
TABLE 7.2 FLOW VS. APPROACH FOR A GIVEN TOWER (Tower is
21.65 m ×
× 36.9 M; Three 7.32 M Fans; Three 25 kW
Motors; 16.7°C Range with 26.7°C Wet Bulb)
Flow m3
/hr Approach Cold Water Hot Water Million
°C °C °C kCal/hr
3632 2.78 29.40 46.11 60.691
4086 3.33 29.95 46.67 68.318
4563 3.89 30.51 47.22 76.25
5039 4.45 31.07 47.78 84.05
5516 5.00 31.62 48.33 92.17
6060.9 5.56 32.18 48.89 101.28
7150.5 6.67 33.29 50.00 119.48
8736 8.33 35.00 51.67 145.63
11590 11.1 37.80 54.45 191.64
13620 13.9 40.56 57.22 226.91
16276 16.7 43.33 60.00 271.32
For meeting the increased heat load, few modifications would be needed to increase the
water flow through the tower. However, at higher capacities, the approach would increase.
Range, Flow and Heat Load
Range is a direct function of the quantity of water circulated and the heat load. Increasing
the range as a result of added heat load does require an increase in the tower size. If the
cold water temperature is not changed and the range is increased with higher hot water
temperature, the driving force between the wet bulb temperature of the air entering the
tower and the hot water temperature is increased, the higher level heat is economical to
dissipate.
If the hot water temperature is left constant and the range is increased by specifying a
lower cold water temperature, the tower size would have to be increased considerably. Not
only would the range be increased, but the lower cold water temperature would lower the
10. approach. The resulting change in both range and approach would require a much larger
cooling tower.
Approach & Wet Bulb Temperature
The design wet bulb temperature is determined by the geographical location. Usually the design
wet bulb temperature selected is not exceeded over 5 percent of the time in that area. Wet bulb
temperature is a factor in cooling tower selection; the higher the wet bulb temperature, the
smaller the tower required to give a specified approach to the wet bulb at a constant range and
flow rate.
A 4540 m3
/hr cooling tower selected for a 16.67°C range and a 4.45°C approach to
21.11°C wet bulb would be larger than a 4540 m3
/hr tower selected for a 16.67°C range and
a 4.45°C approach to a 26.67°C wet bulb. Air at the higher wet bulb temperature is capable
of picking up more heat. Assume that the wet bulb temperature of the air is increased by
approximately 11.1°C. As air removes heat from the water in the tower, each kg of air enter-
ing the tower at 21.1°C wet bulb would contain 18.86 kCals and if it were to leave the tower
at 33.2°C wet bulb it would contain 24.17 kCal per kg of air. In the second case, each kg of
air entering the tower at 26.67°C wet bulb would contain 24.17 kCals and were to leave at
37.8°C wet bulb it would contain 39.67 kCal per kg of air. In going from 21.1°C to 32.2°C,
12.1 kCal per kg of air is picked up, while 15.5 kCal/kg of air is picked up in going from
26.67°C to 37.8°C.
Fill Media Effects
In a cooling tower, hot water is distributed above fill media which flows down and is cooled
due to evaporation with the intermixing air. Air draft is achieved with use of fans. Thus some
power is consumed in pumping the water to a height above the fill and also by fans creating the
draft.
An energy efficient or low power consuming cooling tower is to have efficient designs of
fill media with appropriate water distribution, drift eliminator, fan, gearbox and motor. Power
savings in a cooling tower, with use of efficient fill design, is directly reflected as savings in fan
power consumption and pumping head requirement.
Function of Fill media in a Cooling Tower
Heat exchange between air and water is influenced by surface area of heat exchange, time of
heat exchange (interaction) and turbulence in water effecting thoroughness of intermixing. Fill
media in a cooling tower is responsible to achieve all of above.
Splash and Film Fill Media: As the name indicates, splash fill media generates the required
heat exchange area by splashing action of water over fill media and hence breaking into small-
er water droplets. Thus, surface of heat exchange is the surface area of the water droplets, which
is in contact with air.
Film Fill and its Advantages
In a film fill, water forms a thin film on either side of fill sheets. Thus area of heat exchange
7. Cooling Tower
144
Bureau of Energy Efficiency
11. is the surface area of the fill sheets, which is in contact with air.
7. Cooling Tower
145
Bureau of Energy Efficiency
TABLE 7.3 TYPICAL COMPARISONS BETWEEN VARIOUS FILL MEDIA
Splash Fill Film Fill Low Clog Film Fill
Possible L/G Ratio 1.1 – 1.5 1.5 – 2.0 1.4 – 1.8
Effective Heat Exchange Area 30 – 45 m2
/m3
150 m2
/m3
85 – 100 m2
/m3
Fill Height Required 5 – 10 m 1.2 – 1.5 m 1.5 – 1.8 m
Pumping Head Requirement 9 – 12 m 5 – 8 m 6 – 9 m
Quantity of Air Required High Much low Low
TABLE 7.4 TYPICAL COMPARISON OF CROSS FLOW SPLASH FILL,
COUNTER FLOW TOWER WITH FILM FILL AND SPLASH FILL
Number of Towers : 2
Water Flow : 16000 m3
/hr.
Hot Water Temperature : 41.5°C
Cold Water Temperature : 32.5°C
Design Wet Bulb Temperature : 27.6°C
Counter Flow Counter Flow Cross-Flow
Film Fill Splash Fill Splash Fill
Fill Height, Meter 1.5 5.2 11.0
Plant Area per Cell 14.4 × 14.4 14.4 × 14.4 12.64 × 5.49
Number of Cells per Tower 6 6 5
Power at Motor Terminal/Tower, kW 253 310 330
Static Pumping Head, Meter 7.2 10.9 12.05
Typical comparison between various fill media is shown in Table 7.3.
Due to fewer requirements of air and pumping head, there is a tremendous saving in power
with the invention of film fill.
Recently, low-clog film fills with higher flute sizes have been developed to handle high tur-
bid waters. For sea water, low clog film fills are considered as the best choice in terms of power
saving and performance compared to conventional splash type fills.
Choosing a Cooling Tower
The counter-flow and cross flows are two basic designs of cooling towers based on the funda-
mentals of heat exchange. It is well known that counter flow heat exchange is more effective as
compared to cross flow or parallel flow heat exchange.
Cross-flow cooling towers are provided with splash fill of concrete, wood or perforated
PVC. Counter-flow cooling towers are provided with both film fill and splash fill.
Typical comparison of Cross flow Spash Fill, Counter Flow Tower with Film Fill and
Splash fill is shown in Table 7.4. The power consumption is least in Counter Flow Film Fill fol-
12. lowed by Counter Flow Splash Fill and Cross-Flow Splash Fill.
7.3 Efficient System Operation
Cooling Water Treatment
Cooling water treatment is mandatory for any cooling tower whether with splash fill or with
film type fill for controlling suspended solids, algae growth, etc.
With increasing costs of water, efforts to increase Cycles of Concentration (COC), by
Cooling Water Treatment would help to reduce make up water requirements significantly. In
large industries, power plants, COC improvement is often considered as a key area for water
conservation.
Drift Loss in the Cooling Towers
It is very difficult to ignore drift problem in cooling towers. Now-a-days most of the end user
specification calls for 0.02% drift loss.
With technological development and processing of PVC, manufacturers have brought large
change in the drift eliminator shapes and the possibility of making efficient designs of drift
eliminators that enable end user to specify the drift loss requirement to as low as 0.003 –
0.001%.
Cooling Tower Fans
The purpose of a cooling tower fan is to move a specified quantity of air through the system,
overcoming the system resistance which is defined as the pressure loss. The product of air flow
and the pressure loss is air power developed/work done by the fan; this may be also termed as
fan output and input kW depends on fan efficiency.
The fan efficiency in turn is greatly dependent on the profile of the blade. An aerody-
namic profile with optimum twist, taper and higher coefficient of lift to coefficient of drop
ratio can provide the fan total efficiency as high as 85–92 %. However, this efficiency is
drastically affected by the factors such as tip clearance, obstacles to airflow and inlet shape,
etc.
As the metallic fans are manufactured by adopting either extrusion or casting process it is
always difficult to generate the ideal aerodynamic profiles. The FRP blades are normally hand
moulded which facilitates the generation of optimum aerodynamic profile to meet specific
duty condition more efficiently. Cases reported where replacement of metallic or Glass fibre
reinforced plastic fan blades have been replaced by efficient hollow FRP blades, with resultant
fan energy savings of the order of 20–30% and with simple pay back period of 6 to 7 months.
Also, due to lightweight, FRP fans need low starting torque resulting in use of lower HP
motors. The lightweight of the fans also increases the life of the gear box, motor and bearing
is and allows for easy handling and maintenance.
Performance Assessment of Cooling Towers
In operational performance assessment, the typical measurements and observations involved
are:
7. Cooling Tower
146
Bureau of Energy Efficiency
13. • Cooling tower design data and curves to be referred to as the basis.
• Intake air WBT and DBT at each cell at ground level using a whirling pyschrometer.
• Exhaust air WBT and DBT at each cell using a whirling psychrometer.
• CW inlet temperature at risers or top of tower, using accurate mercury in glass or a digital
thermometer.
• CW outlet temperature at full bottom, using accurate mercury in glass or a digital ther-
mometer.
• Process data on heat exchangers, loads on line or power plant control room readings, as
relevant.
• CW flow measurements, either direct or inferred from pump motor kW and pump head
and flow characteristics.
• CT fan motor amps, volts, kW and blade angle settings
• TDS of cooling water.
• Rated cycles of concentration at the site conditions.
• Observations on nozzle flows, drift eliminators, condition of fills, splash bars,
etc.
The findings of one typical trial pertaining to the Cooling Towers of a Thermal Power Plant
3 x 200 MW is given below:
Observations
* Unit Load 1 & 3 of the Station = 398 MW
* Mains Frequency = 49.3
* Inlet Cooling Water Temperature °C = 44 (Rated 43°C)
* Outlet Cooling Water Temperature °C = 37.6 (Rated 33°C)
* Air Wet Bulb Temperature near Cell °C = 29.3 (Rated 27.5°C)
* Air Dry Bulb Temperature near Cell °C = 40.8°C
* Number of CT Cells on line with water flow = 45 (Total 48)
* Total Measured Cooling Water Flow m3
/hr = 70426.76
* Measured CT Fan Flow m3
/hr = 989544
Analysis
* CT Water Flow/Cell, m3
/hr = 1565 m3
/hr (1565000 kg/hr)
(Rated 1875 m3
/hr)
* CT Fan Air Flow, m3
/hr (Avg.) = 989544 m3
/hr
(Rated 997200 m3
/hr)
* CT Fan Air Flow kg/hr (Avg.) = 1068708 kg/hr
@ Density of 1.08 kg/m3
* L/G Ratio of C.T. kg/kg = 1.46
(Rated 1.74 kg/kg)
* CT Range = (44 – 37.6) = 6.4°C
* CT Approach = (37.6 – 29.3) = 8.3°C
* % CT Effectiveness = Range
(Range + Approach)
7. Cooling Tower
147
Bureau of Energy Efficiency
x100
14. = 6.4
(6.4 + 8.3)
= 43.53
* Rated % CT Effectiveness = 100 * (43 – 33) / (43 – 27.5)
= 64.5%
* Cooling Duty Handled/Cell in kCal = 1565 * 6.4 * 103
(i.e., Flow * Temperature Difference in = 10016 * 103
kCal/hr
kCal/hr) (Rated 18750 *
103
kCal/hr)
* Evaporation Losses in m3
/hr = 0.00085 x 1.8 x circulation
rate (m3
/hr) x (T1-T2)
= 0.00085 x 1.8 x 1565 x (44-
37.6)
= 15.32 m3
/hr per cell
* Percentage Evaporation Loss = [15.32/1565]*100
= 0.97%
* Blow down requirement for site COC of 2.7 = Evaporation losses/COC-1
= 15.32/(2.7-1) per cell i.e.,
9.01 m3
/hr
* Make up water requirement/cell in m3
/hr = Evaporation Loss + Blow
down Loss
= 15.32 + 9.01
= 24.33
Comments
• Cooling water flow per cell is much lower, almost by 16.5%, need to investigate
CW pump and system performance for improvements. Increasing CW flow
through cell was identified as a key result area for improving performance of cooling
towers.
• Flow stratification in 3 cooling tower cells identified.
• Algae growth identified in 6 cooling tower cells.
• Cooling tower fans are of GRP type drawing 36.2 kW average. Replacement by efficient
hollow FRP fan blades is recommended.
7.4 Flow Control Strategies
Control of tower air flow can be done by varying methods: starting and stopping (On-off) of
fans, use of two- or three-speed fan motors, use of automatically adjustable pitch fans, use of
variable speed fans.
On-off fan operation of single speed fans provides the least effective control. Two-speed
fans provide better control with further improvement shown with three speed fans. Automatic
adjustable pitch fans and variable-speed fans can provide even closer control of tower cold-
7. Cooling Tower
148
Bureau of Energy Efficiency
x100
15. water temperature. In multi-cell towers, fans in adjacent cells may be running at different
speeds or some may be on and others off depending upon the tower load and required water
temperature. Depending upon the method of air volume control selected, control strategies can
be determined to minimise fan energy while achieving the desired control of the Cold water
temperature.
7.5 Energy Saving Opportunities in Cooling Towers
– Follow manufacturer's recommended clearances around cooling towers and relocate
or modify structures that interfere with the air intake or exhaust.
– Optimise cooling tower fan blade angle on a seasonal and/or load basis.
– Correct excessive and/or uneven fan blade tip clearance and poor fan
balance.
– On old counter-flow cooling towers, replace old spray type nozzles with new square
spray ABS practically non-clogging nozzles.
– Replace splash bars with self-extinguishing PVC cellular film fill.
– Install new nozzles to obtain a more uniform water pattern
– Periodically clean plugged cooling tower distribution nozzles.
– Balance flow to cooling tower hot water basins.
– Cover hot water basins to minimise algae growth that contributes to fouling.
– Optimise blow down flow rate, as per COC limit.
– Replace slat type drift eliminators with low pressure drop, self extinguishing, PVC
cellular units.
– Restrict flows through large loads to design values.
– Segregate high heat loads like furnaces, air compressors, DG sets, and isolate cool-
ing towers for sensitive applications like A/C plants, condensers of captive power
plant etc. A 1°C cooling water temperature increase may increase A/C compressor
kW by 2.7%. A 1°C drop in cooling water temperature can give a heat rate saving of
5 kCal/kWh in a thermal power plant.
– Monitor L/G ratio, CW flow rates w.r.t. design as well as seasonal variations.
It would help to increase water load during summer and times when approach
is high and increase air flow during monsoon times and when approach is
narrow.
– Monitor approach, effectiveness and cooling capacity for continuous optimisation
efforts, as per seasonal variations as well as load side variations.
– Consider COC improvement measures for water savings.
– Consider energy efficient FRP blade adoption for fan energy savings.
– Consider possible improvements on CW pumps w.r.t. efficiency improvement.
– Control cooling tower fans based on leaving water temperatures especially in case
of small units.
– Optimise process CW flow requirements, to save on pumping energy, cooling
load, evaporation losses (directly proportional to circulation rate) and blow down
losses.
Some typical problems and their trouble shooting for cooling towers are given in Table 7.5.
7. Cooling Tower
149
Bureau of Energy Efficiency
16. 7. Cooling Tower
150
Bureau of Energy Efficiency
TABLE 7.5 TYPICAL PROBLEMS AND TROUBLE SHOOTING FOR COOLING TOWERS
Problem / Difficulty Possible Causes Remedies/Rectifying Action
Excessive absorbed 1. Voltage Reduction Check the voltage
current / electrical load 2a. Incorrect angle of axial fan blades Adjust the blade angle
2b. Loose belts on centrifugal fans Check belt tightness
(or speed reducers)
3. Overloading owing to excessive air Regulate the water flow by means
flow-fill has minimum water of the valve
loading per m2
of tower section
4. Low ambient air temperature The motor is cooled
proportionately and hence delivers
more than name plate power
Drift/carry-over of 1. Uneven operation of spray nozzles Adjust the nozzle orientation and
water outside the unit eliminate any dirt
2. Blockage of the fill pack Eliminate any dirt in the top of the
fill
3. Defective or displaced droplet Replace or realign the eliminators
eliminators
4. Excessive circulating water flow Adjust the water flow-rate by
(possibly owing to too high means of the regulating valves.
pumping head) Check for absence of damage to
the fill
Loss of water from 1. Float-valve not at correct level Adjust the make-up valve
basins/pans 2. Lack of equalising connections Equalise the basins of towers
operating in parallel
Lack of cooling and 1. Water flow below the design valve Regulated the flow by means
hence increase in of the valves
temperatures owing to 2. Irregular airflow or lack of air Check the direction of rotation of
increased temperature the fans and/or belt tension
range (broken belt possible)
3a. Recycling of humid discharge air Check the air descent velocity
3b. Intake of hot air from other sources Install deflectors
4a. Blocked spray nozzles (or even Clean the nozzles and/or the tubes
blocked spray tubes)
4b. Scaling of joints Wash or replace the item
5. Scaling of the fill pack Clean or replace the material
(washing with inhibited aqueous
sulphuric acid is possible but long,
complex and expensive)
17. 7. Cooling Tower
151
Bureau of Energy Efficiency
QUESTIONS
1. What do you understand by the following terms in respect of cooling towers?
a) Approach, b) Cooling Duty c) Range d) Cooling Tower Effectiveness
2. Explain with a sketch the different types of cooling towers.
3. What do you mean by the term of Cycles of Concentration and how it is related to
cooling tower blow down?
4. Explain the term L/G ratio?
5. CT Observations at an industrial site were
* CW Flow : 5000 m3
/hr
* CW in Temperature : 42°C
* CW Out Temperature : 36°C
* Wet Bulb Temperature : 29°C
What is the Effectiveness of the cooling tower?
6. What is the function of fill media in a cooling tower?
7. List the factors affecting cooling tower performance.
8. List the energy conservation opportunities in a cooling tower system.
9. Explain the difference between evaporation loss and drift loss?
10. What is the Blow-down Loss, if the Cycles of Concentration (COC) is 3.0?
REFERENCES
1. ASHRAE Handbook
2. NPC Case Studies