
Recommended
More Related Content
Similar to Agile Mumbai 2023 | Sustainable Agile Metrics - Pranav Menon
Similar to Agile Mumbai 2023 | Sustainable Agile Metrics - Pranav Menon (20)
More from AgileNetwork
More from AgileNetwork (20)
Recently uploaded
Recently uploaded (20)
Agile Mumbai 2023 | Sustainable Agile Metrics - Pranav Menon
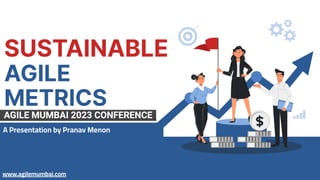
- 1. A Presentation by Pranav Menon SUSTAINABLE AGILE METRICS www.agilemumbai.com
- 2. INTRODUCTION TO THE SPEAKER Project Manager & professional Scrum Master coming with experience working with many fortune 500 companies in multitude of domains including, healthcare, tourism & hospitality, consumer goods, delivery route optometric. 7+ Years working with various organizations and stakeholders in multiple time zones and regions for developing high performing Agile delivery teams
- 3. INTRODUCTION 01 BENEFACTOR 1.1 METRICS 02 TECHNICAL & SOFT METRICS 03 TABLE OF CONTENTS CHALLENGES 04 SUCCESS STORY 05 MAJOR TAKEAWAYS 06 SUCCESS STORY
- 4. INTRODUCTION What is Sustainable Agile Metrics 01
- 5. Sustainable Agile Metrics Sustainable agile metrics are a set of key performance indicators & measurements used within agile development frameworks to assess and improve the sustainability of the development process. SAM go beyond traditional agile metrics like velocity and burndown charts, focusing on long-term success, quality, and team well-being.
- 6. BENEFACTOR PRODUCT OWNER Support product owners to adapt to customer needs CUSTOMERS Ensures customers to receive quality products on time PROJECT MANAGER Helps project managers to manage risks and resources effectively ORGANIZATION the organization as a whole is able to achieve financial success and maintain a competitive edge in the market. TEAM They empower teams to make data-driven improvements 1.1 sustainable agile metrics benefit a wide range of stakeholders by promoting efficient, high-quality, and sustainable development processes.
- 7. METRICS What are the different Sustainable Agile Metrics 02
- 8. WHAT ARE THE DIFFERENT SAM’S ? TECHNICAL SAM’S SOFT SAM’S These are statistically proven metrics that dictates agile sustainability Soft people skill metrics that indicated agile sustainability.
- 9. TECHNICAL & SOFT METRICS 03
- 10. ● Velocity Trends ● Cycle & Lead time ● WIP limits ● Sprint Success rate ● Code Quality ● Bug Density ● Technical Debt ● Artifacts ● Knowledge Sharing TECHNICAL & SOFT SAM’s ● Team Health ● Sustainability Retro ● Customer Satisfaction
- 11. ● It refers to the long-term changes in the speed or rate of growth of team efficiency in delivery over a period of time. ● This is a sustainable metric to determine the median velocity of a team and the effect on the velocity due to changes in team,its performance or its capacity TECHNICAL SAM’s VELOCITY TRENDS Sprint Velocity Change Reason Impact Sprint 1 65 SP’s - NA NA Sprint 2 60 SP’s <5 SP Planned holidays Reduced capacity for this sprint, discounted capacity for next SP Sprint 3 62 SP’s >2SP additional support from resources Increase in work output Sprint 4 62 SP’s - NA NA Sprint 5 65 SP’s >3 SP Full capacity + support Velocity restore Median Velocity 63 SP
- 12. CYCLE VS. LEAD TIME ● The Lead Time measures the time from the moment the customer makes a request to the time they receive something. The Cycle Time measures the time it takes the development team to work on the request and deliver it. ● Both are good indicators of a team’s ability to deliver value to their customers. The ultimate goal is to reduce the lead time as that is something valued by customers.
- 13. WIP LIMITS ● In agile development, work in progress (WIP) limits set the maximum amount of work that can exist in each status of a workflow. Limiting the amount of work in progress makes it easier to identify inefficiency in a team's workflow. ● Bottlenecks in a team's delivery pipeline are clearly visible before a situation becomes dire. ● WIP limits improve throughput and reduce the amount of work "nearly done", by forcing the team to focus on a smaller set of tasks.
- 14. ● The Sprint Goal Success Rate is the percentage of sprints in which the team successfully achieves all the goals they set at the beginning of each sprint. ● It is a measure of the team's ability to stay focused and complete the planned work during the sprint. SPRINT SUCCESS RATE A high success rate indicates that the team consistently meets its goals, while a lower rate indicates they need to analyze their performance and adapt their Sprint Planning and Execution.
- 15. CODE QUALITY & BUG DENSITY CODE QUALITY Refers to how well a piece of software adheres to best practices BUG DENSITY the number of confirmed bugs in a software application or module during the period of development, divided by the size of the software.
- 16. TECHNICAL DEBT ● The implied cost incurred when businesses do not fix problems that will affect them in the future. ● Accruing technical debt causes existing problems to get worse over time. ● The longer debt builds up, the more costly it becomes to rectify.
- 17. ARTIFACTS & KNOWLEDGE SHARING ● While it is a straightforward task, but often overlooked in terms of detailing. ● Every individual team has its own needs and uniqueness which should be documented keeping in mind anyone who goes through the artifact with the right skill set should be able to understand and absorb. ● By sharing the knowledge through regular knowledge discovery sessions teams can be made cross functional and build situational awareness.
- 18. TEAM HEALTH Team Health is a vital part of SDLC. this determines how efficiently the team can work based on their sense of fulfillment. The better the Team health, higher the chances of success as the team is able to move forward with a positive outlook and attitude. SOFT SAM’s
- 19. SUSTAINABILITY RETRO ● Comprehensive insights with thorough analysis that is achieved through examining retrospectives over broader periods of time. ● We try to align with organizational goals and future planning ensuring the team’s efforts are not only focused on immediate gains but also contribute to the larger vision of the org.
- 20. CUSTOMER SATISFACTION ● It’s the ultimate goal for Agile delivery, making it extremely important to measure it through constant customer feedback. ● By Prioritizing frequent interactions and collaboration between customers and development team, good customer satisfaction can be built.
- 21. 04 CHALLENGES
- 22. CHALLENGES ADAPTING TO A LARGER VISION It will be challenging to go from focusing on a few tasks to truly understanding the larger vision RESISTANCE TO CHANGE Team and stakeholders could pose resistance to change or even frequent changes that might be necessary to adapt. COLLABORATION ISSUES Working with multiple moving parts may result in collaboration issues if not done right.
- 24. MAJOR TAKEAWAYS ROOTED IN AGILE Sustainable agile metrics are deeply rooted in the Agile Manifesto's core values and principles. DATA-DRIVEN EVOLUTION SAM relies on data and KPIs & drive improvements. QUALITY-DRIVEN Code quality metrics, such as code coverage and complexity, are central to sustainable agile practices. STRATEGIC DM At the organizational level, sustainable agile metrics help leaders make strategic decisions related to resource allocation, project investments, and overall company strategy. By measuring customer satisfaction and the delivery of value, these metrics ensure that the development process aligns with real customer needs and expectations. ENHANCED TEAM WELL BEING By measuring factors like work-life balance and satisfaction, they contribute to creating a more enjoyable and sustainable work environment. CUSTOMER-CENTRIC
- 25. ● SAM’s are performance indicators used to evaluate long term success of an agile project. ● They include technical and soft techniques like lead time, cycle time, bug density, code quality and customer satisfaction. ● By implementing the metrics and inspecting, course correcting over a long period of time good sustainability in terms of agile delivery can be maintained. ● Customer satisfaction and efficient delivery team with a positive mindset is the ultimate goal to be achieved. LESSONS LEARNED
- 26. CREDITS: This presentation template was created by Slidesgo, including icons by Flaticon and infographics & images by Freepik THANK YOU!