More Related Content
Similar to Afc prevalence 06_table6-1
Similar to Afc prevalence 06_table6-1 (20)
More from Adrienne Classen
More from Adrienne Classen (20)
Afc prevalence 06_table6-1
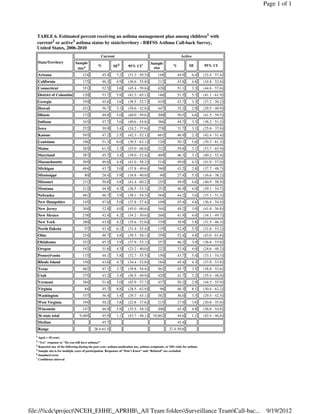
- 1. 1 Aged < 18 years
2 "Yes" response to "Do you still have asthma?"
3 Reported any of the following during the past year: asthma medication use, asthma symptoms, or MD visits for asthma
± Sample size is for multiple years of participation. Responses of “Don’t Know” and “Refused” are excluded.
§ Standard error
† Confidence interval
State/Territory
Current Active
Sample
size± % SE§ 95% CI† Sample
size
% SE 95% CI
Arizona 124 45.4 7.2 (31.3 - 59.5) 148 44.9 6.4 (32.4 - 57.4)
California 175 46.2 4.9 (36.6 - 55.8) 212 43.8 4.6 (34.8 - 52.8)
Connecticut 351 52.5 3.6 (45.4 - 59.6) 420 51.1 3.3 (44.6 - 57.6)
District of Columbia 120 53.7 5.8 (42.3 - 65.1) 146 51.5 5.3 (41.1 - 61.9)
Georgia 350 45.6 3.6 (38.5 - 52.7) 410 43.7 3.3 (37.2 - 50.2)
Hawaii 421 36.7 3.1 (30.6 - 42.8) 447 35.2 2.9 (29.5 - 40.9)
Illinois 172 49.8 5.0 (40.0 - 59.6) 200 50.5 4.6 (41.5 - 59.5)
Indiana 343 47.7 3.6 (40.6 - 54.8) 386 44.7 3.3 (38.2 - 51.2)
Iowa 252 30.9 3.4 (24.2 - 37.6) 278 31.7 3.1 (25.6 - 37.8)
Kansas 593 47.2 2.5 (42.3 - 52.1) 661 46.9 2.3 (42.4 - 51.4)
Louisiana 106 51.3 6.0 (39.5 - 63.1) 120 50.3 5.6 (39.3 - 61.3)
Maine 283 61.5 3.3 (55.0 - 68.0) 332 59.8 3.1 (53.7 - 65.9)
Maryland 387 45.7 3.4 (39.0 - 52.4) 469 46.3 3.1 (40.2 - 52.4)
Massachusetts 269 49.6 4.4 (41.0 - 58.2) 314 49.0 4.1 (41.0 - 57.0)
Michigan 484 43.7 3.0 (37.8 - 49.6) 540 43.2 2.8 (37.7 - 48.7)
Mississippi 80 28.4 5.9 (16.8 - 40.0) 94 27.4 5.5 (16.6 - 38.2)
Missouri 231 50.8 4.8 (41.4 - 60.2) 255 49.9 4.6 (40.9 - 58.9)
Montana 212 44.9 4.3 (36.5 - 53.3) 253 46.9 4.0 (39.1 - 54.7)
Nebraska 481 46.7 3.9 (39.1 - 54.3) 544 44.2 3.6 (37.1 - 51.3)
New Hampshire 145 47.6 5.0 (37.8 - 57.4) 169 45.4 4.6 (36.4 - 54.4)
New Jersey 304 52.8 4.0 (45.0 - 60.6) 344 49.2 3.9 (41.6 - 56.8)
New Mexico 238 42.4 4.2 (34.2 - 50.6) 266 41.9 4.0 (34.1 - 49.7)
New York 280 43.8 4.2 (35.6 - 52.0) 339 38.9 3.8 (31.5 - 46.3)
North Dakota 97 43.4 6.1 (31.4 - 55.4) 119 42.4 5.5 (31.6 - 53.2)
Ohio 224 48.7 4.8 (39.3 - 58.1) 259 52.4 4.8 (43.0 - 61.8)
Oklahoma 252 45.5 3.9 (37.9 - 53.1) 257 46.2 3.9 (38.6 - 53.8)
Oregon 192 31.6 4.3 (23.2 - 40.0) 222 32.4 4.0 (24.6 - 40.2)
Pennsylvania 133 44.1 5.8 (32.7 - 55.5) 156 43.7 5.4 (33.1 - 54.3)
Rhode Island 158 43.6 4.7 (34.4 - 52.8) 184 45.4 4.3 (37.0 - 53.8)
Texas 482 47.1 3.7 (39.8 - 54.4) 562 45.7 3.5 (38.8 - 52.6)
Utah 375 43.2 3.4 (36.5 - 49.9) 420 41.7 3.2 (35.4 - 48.0)
Vermont 384 51.8 3.0 (45.9 - 57.7) 437 50.2 2.9 (44.5 - 55.9)
Virginia 84 45.7 8.8 (28.5 - 62.9) 96 46.3 8.1 (30.4 - 62.2)
Washington 337 36.4 3.4 (29.7 - 43.1) 382 36.0 3.3 (29.5 - 42.5)
West Virginia 194 30.2 3.8 (22.8 - 37.6) 215 27.9 3.6 (20.8 - 35.0)
Wisconsin 147 46.9 5.8 (35.5 - 58.3) 206 45.4 4.8 (36.0 - 54.8)
36 state total 9,460 45.9 1.1 (43.7 - 48.1) 10,862 44.6 1.1 (42.4 - 46.8)
Median 45.7 45.4
Range 28.4-61.5 27.4-59.8
Page 1 of 1
1TABLE 6. Estimated percent receiving an asthma management plan among children with
2 3current or active asthma status by state/territory - BRFSS Asthma Call-back Survey,
United States, 2006-2010
file://cdcprojectNCEH_EHHE_APRHB_All Team foldersSurveillance TeamCall-bac... 9/19/2012